Over the past few years, shopping has evolved in many ways. To start with, the consumers would visit stores to purchase items. Then online shopping (e-commerce) caught on, you order online and the product arrives in a few days.
There is even something faster now, the feature of Quick Commerce (Q-Commerce). Using Q-Commerce, the ability to purchase and get things delivered to your door within 10 to 30 minutes is readily available.
This article will explain what Quick Commerce is, how it is done, what its features, advantages, and drawbacks as well as how it varies as compared to ordinary online shopping.
What is Quick Commerce (Q-Commerce)?
Q-Commerce is also known as Quick Commerce, which is an ultra-rapid delivery. It allows consumers to place orders for everyday items that are to be used – groceries, snacks, medicines, personal care items, among others, and have them delivered within less than an hour and sometimes in 10-30 minutes.
It is more or less like internet shopping, but a lot quicker. Your stuff arrives nearly instantly instead of waiting 2-3 days. This model is used by companies in India such as Blinkit, Zepto, and Swiggy Instamart, or companies outside of India, such as Gopuff and Getir.
Example: You need milk at night. Instead of going out, you open the app, order milk, and get it at your door in 15 minutes.
How Quick Commerce Works
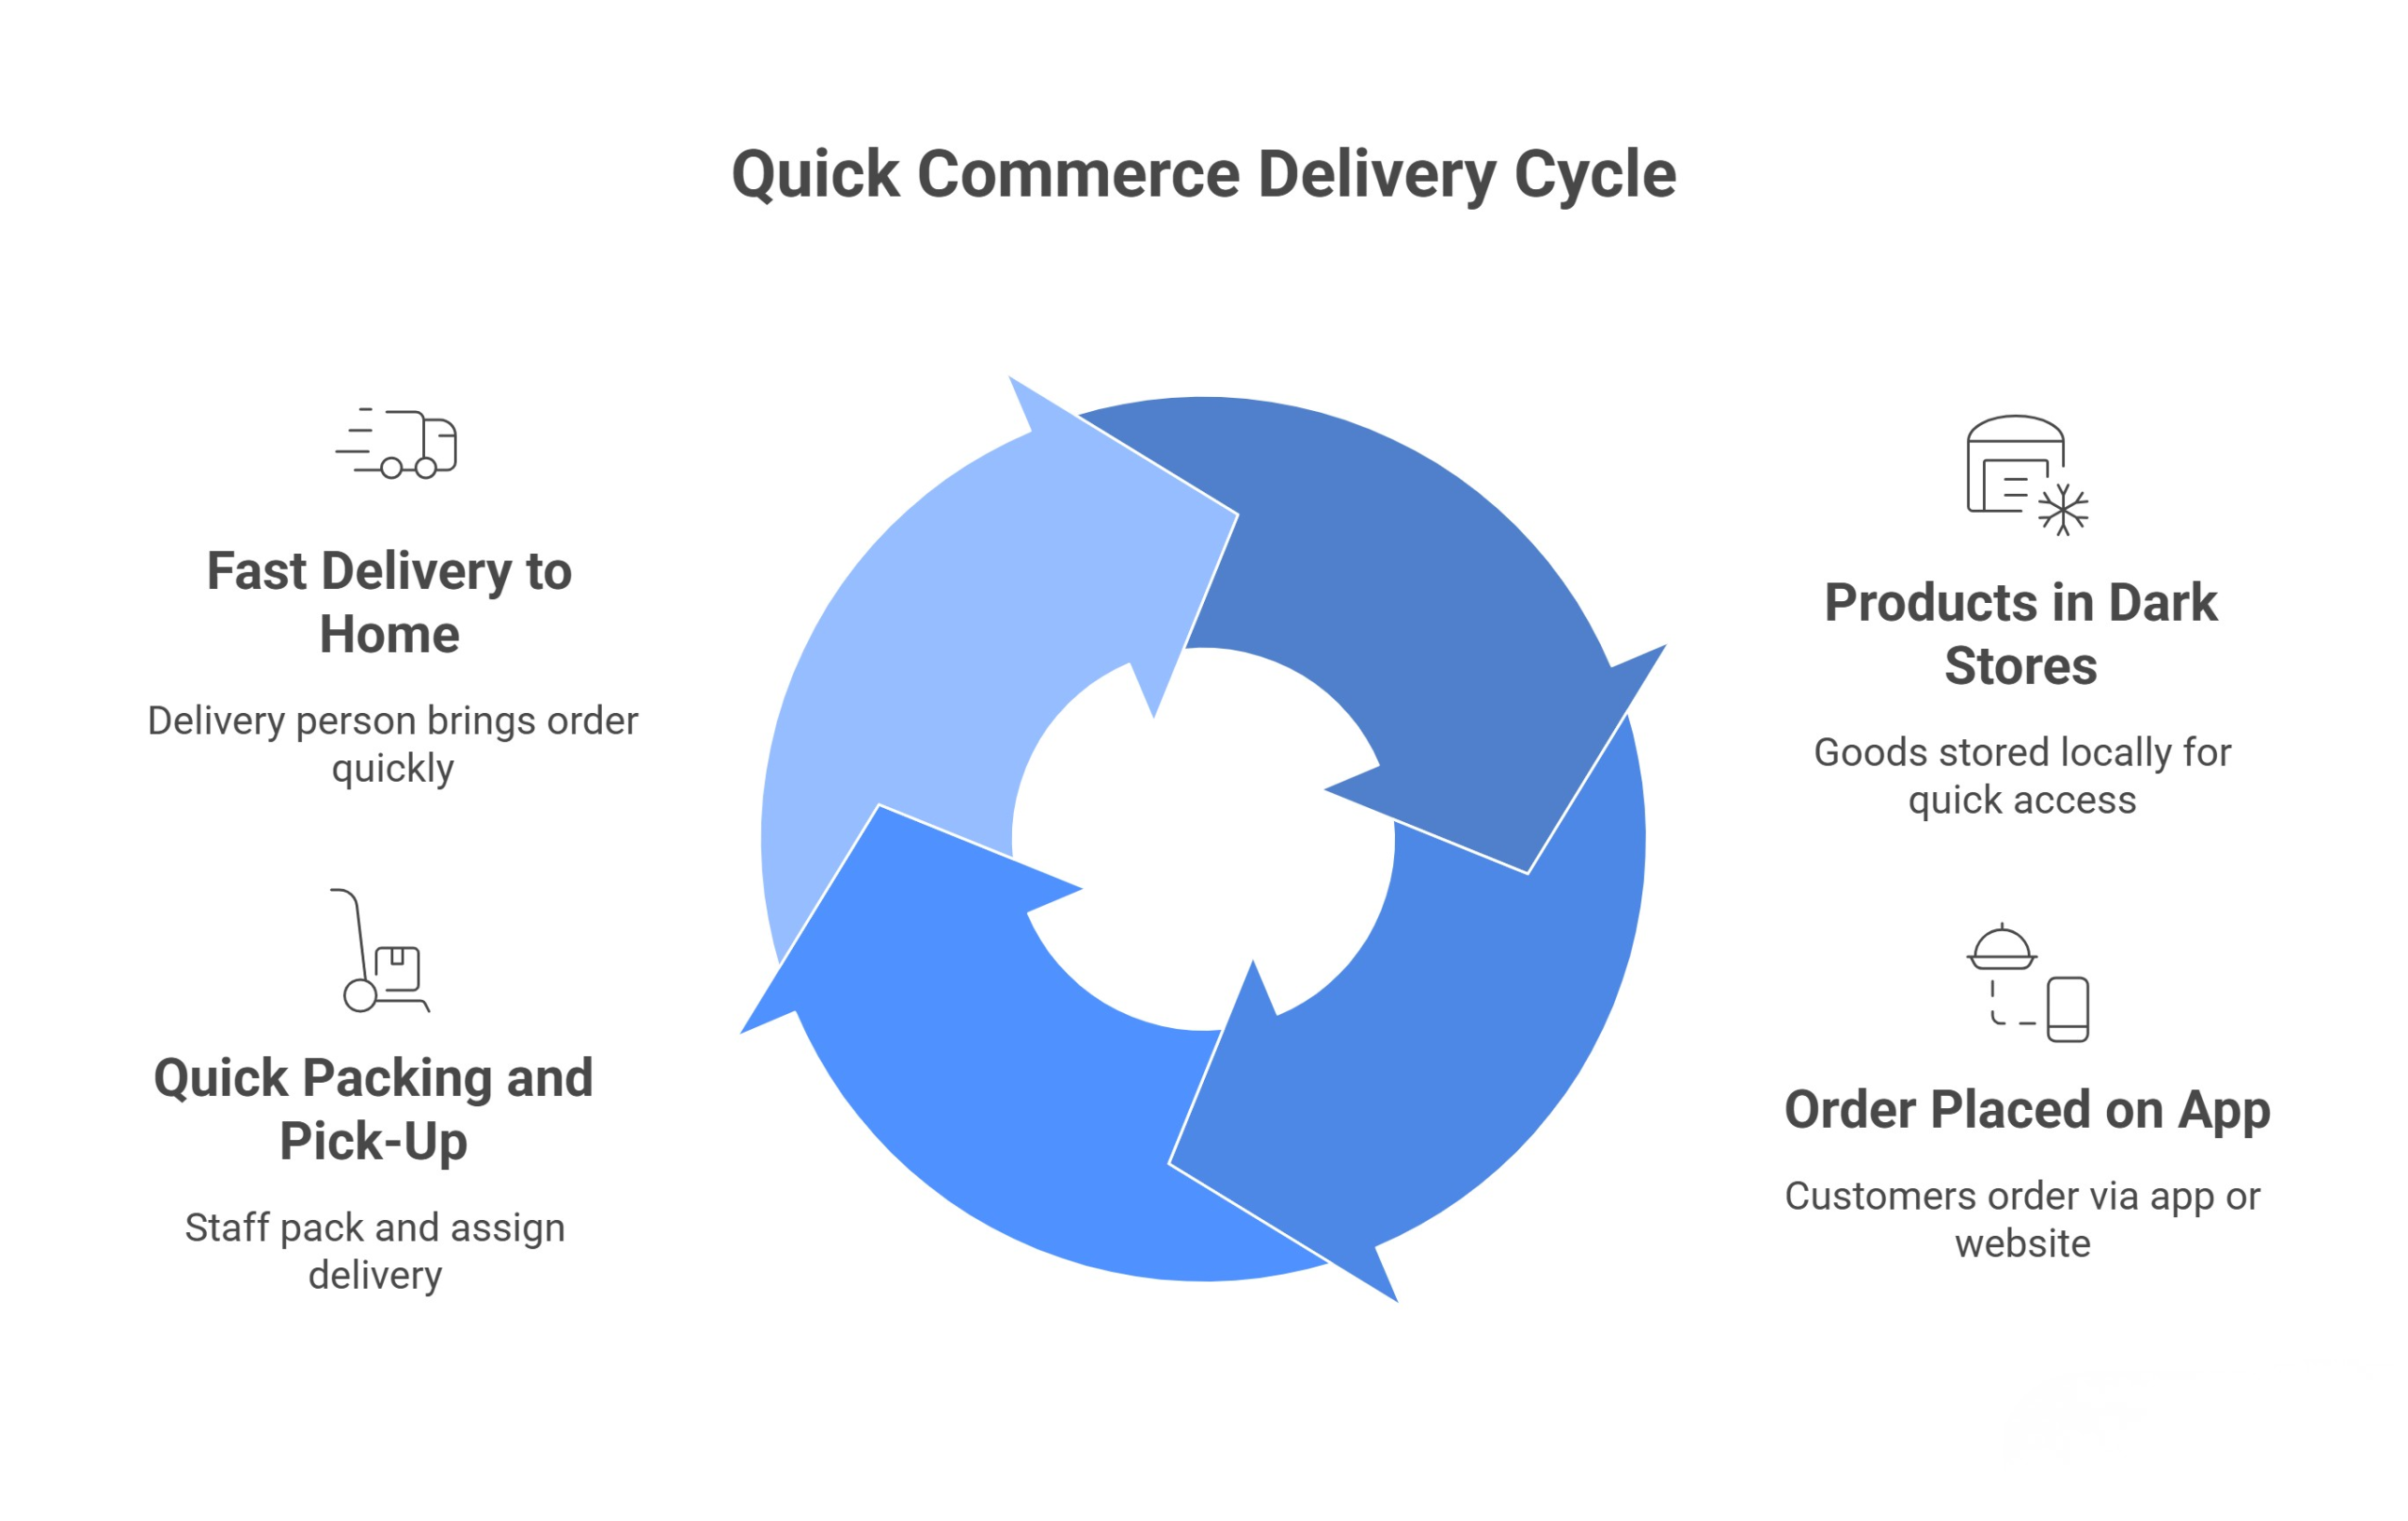
Quick Commerce is designed for speed, so the process is much faster than normal online shopping. Here’s how it usually happens:
- Products Kept in Local “Dark Stores” – Instead of keeping everything in one big warehouse far away, Quick Commerce companies keep goods in many small storage places inside the city. These are called dark stores. They are not open to the public but are filled with fast-selling items like groceries, snacks, medicines, and daily essentials. Because they are close to where customers live, orders can be delivered much faster.
- Order Placed on the App – You open the Quick Commerce app or website, search for what you need, and place your order. The system sends your order to the nearest dark store so it can be prepared quickly.
- Quick Packing and Pick-Up – When the store gets your order, staff take the items from the shelves and pack them neatly. A delivery person nearby is given the job right away and comes to collect the package.
- Fast Delivery to Your Home – The delivery person takes the shortest way to your house and brings your order, usually in 10–30 minutes. Since the store is nearby, the travel time is very short, which makes the delivery super quick.
Example: You’re out of milk at night — you order it on the app, and before you’ve even finished watching your favourite TV scene, it’s delivered to your door.
Read Also: Top Quick Commerce Companies in India
Key Features of Quick Commerce
Quick Commerce has some special features that make it different from regular online shopping:
- Very Fast Delivery: 10 to 30 minutes in most cases.
- Small Basket Orders: Usually for small, daily needs, not big furniture or electronics.
- Local Dark Stores: Items stored close to customers to save delivery time.
- Limited Product Range: Focuses on essential, fast-selling items.
- App-based Ordering: Easy-to-use mobile apps for instant shopping.
- 24/7 Availability: Many Q-Commerce companies deliver late at night or early morning.
Quick Commerce Business Model Explained
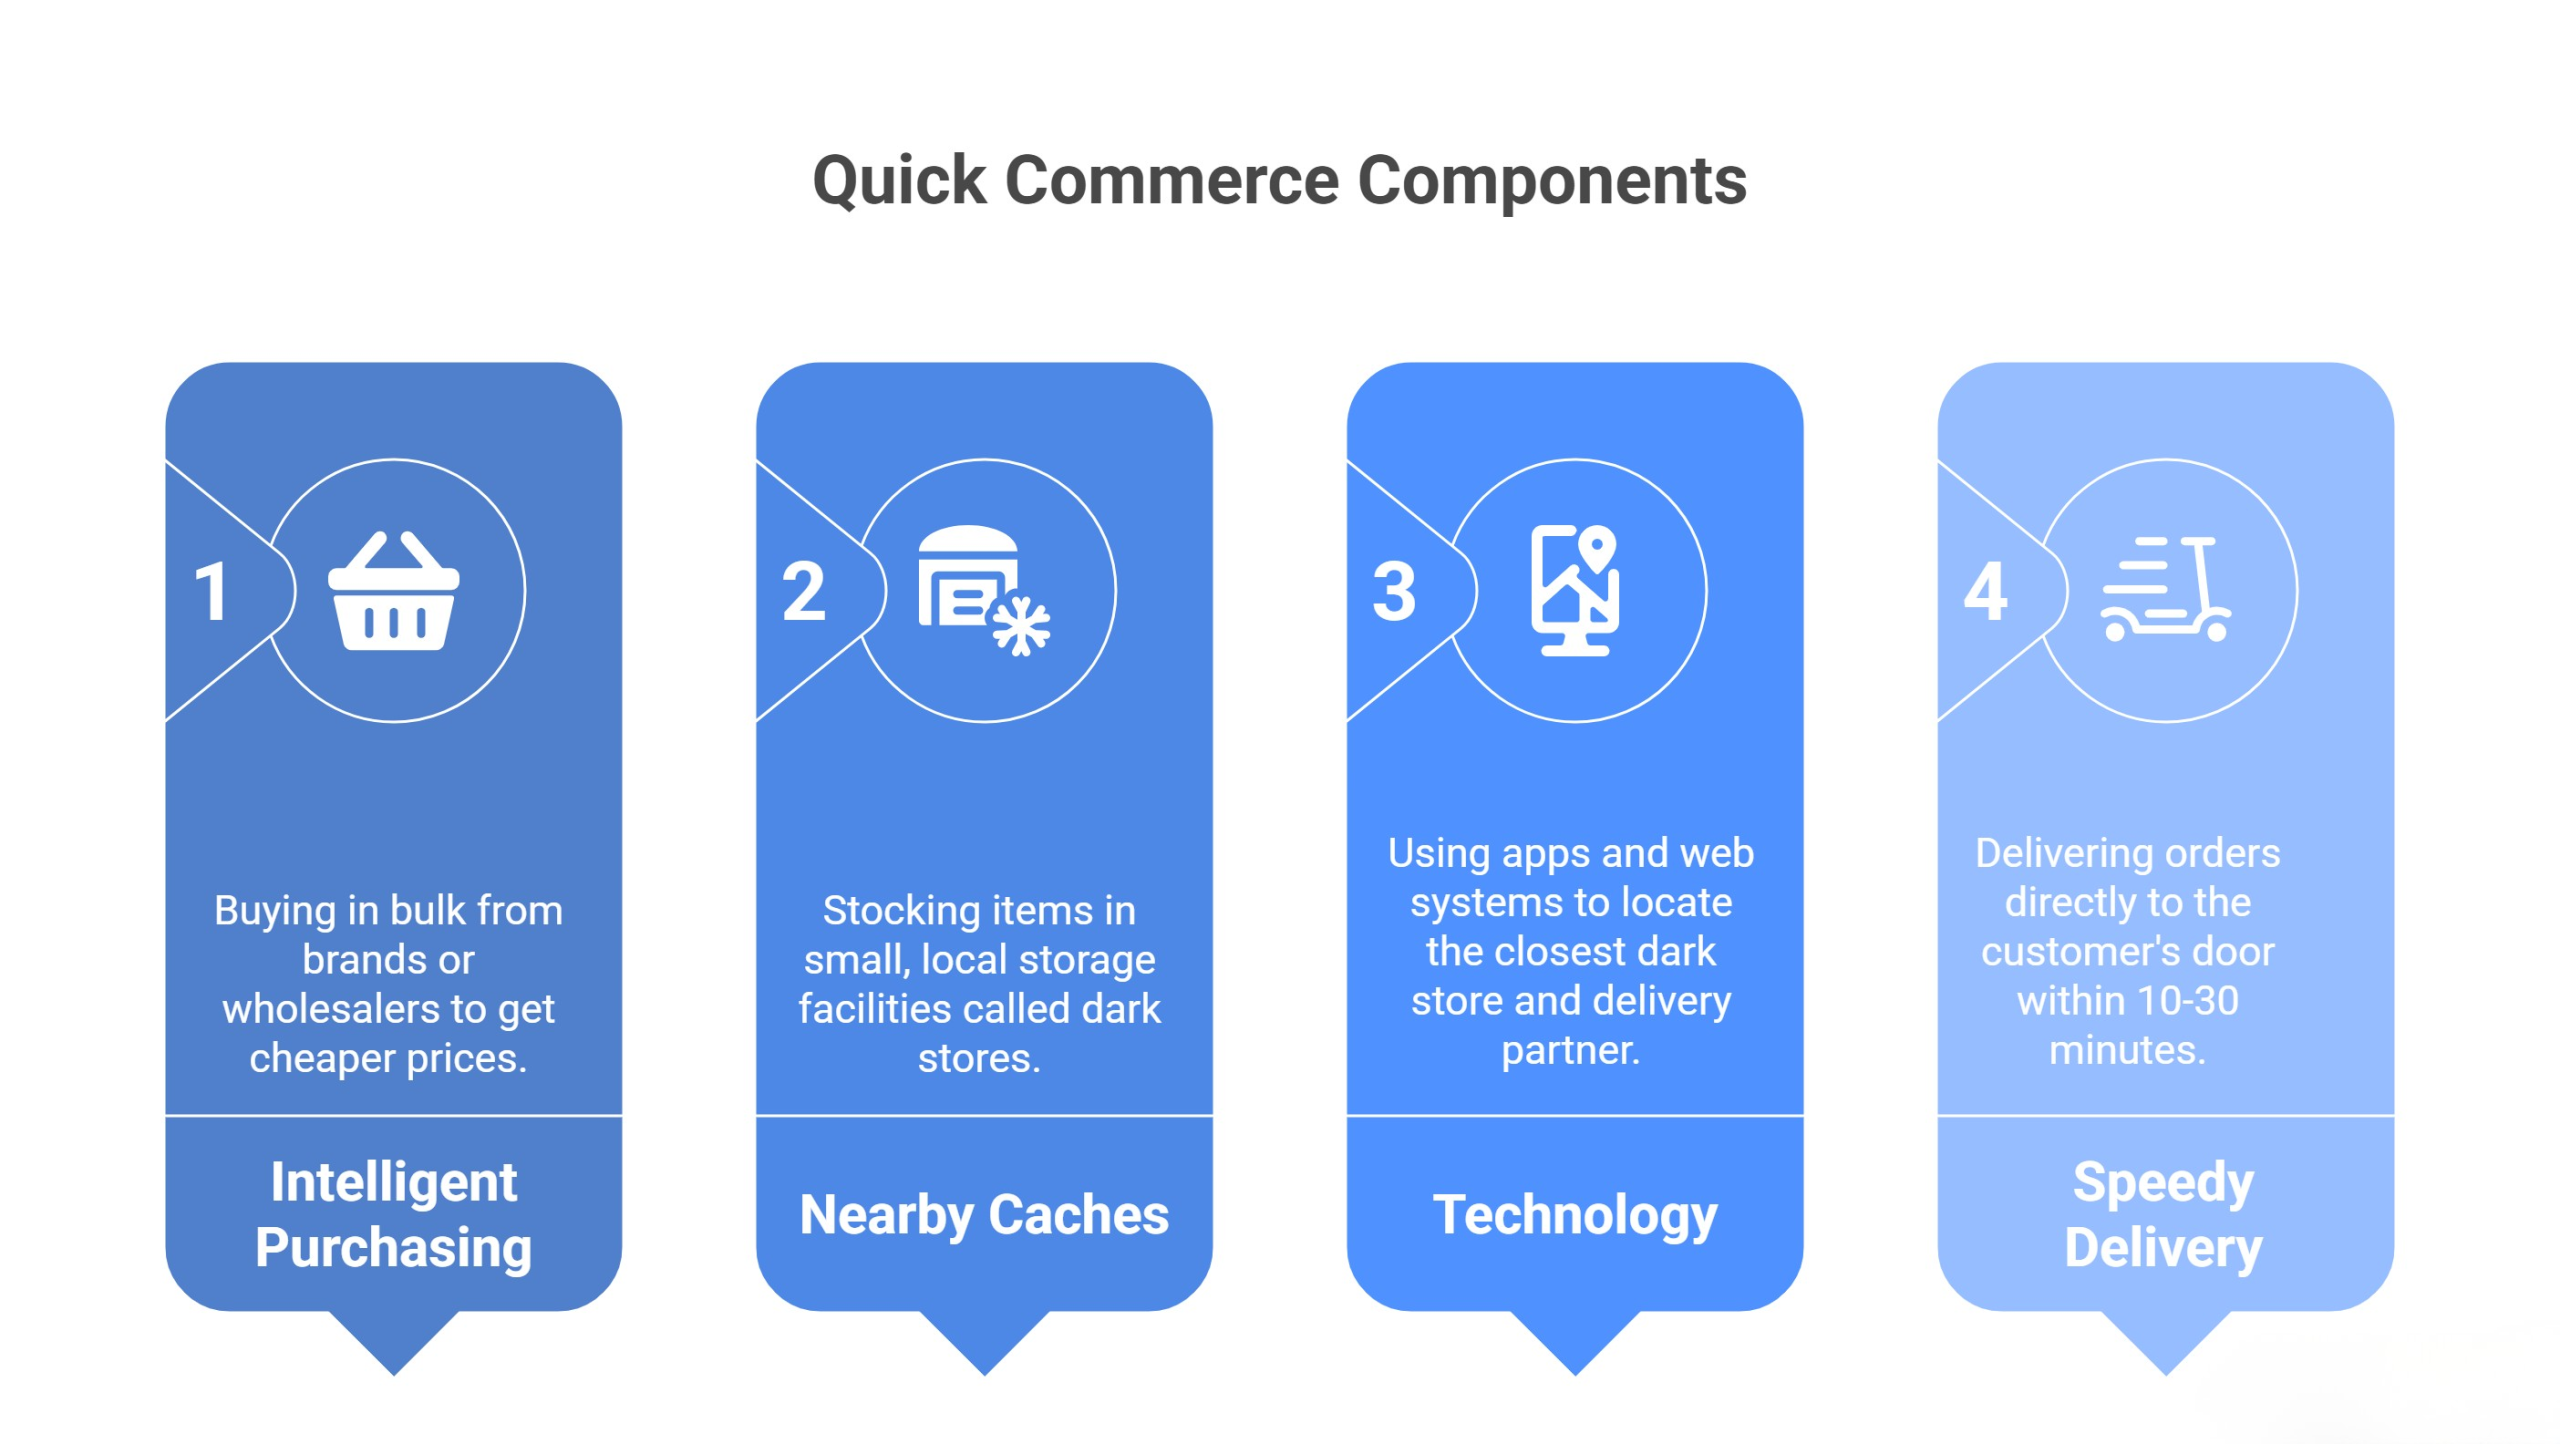
Quick Commerce is based on a premise that is rather easy to understand: it tries to keep products near customers and deliver them as fast as possible. In order to achieve this, firms are relying on intelligent purchasing, nearby caches, technology, and speedy delivery teams.
To begin with, they purchase products in large quantities either directly from the brands, manufacturers, or wholesalers. They purchase bulk products so as to obtain cheaper prices. Their products are typically products that people purchase on a regular basis, such as groceries, snacks, dairy items, medicines, and personal care products. At normal or slightly higher prices, they can make a profit by buying cheaply and selling at normal prices.
Then, rather than holding all the products in a large warehouse somewhere out of town, they stock items in numerous, small, local storage facilities that they call dark stores. These do not open to the customers as ordinary shops do. They are also situated in areas that are near the residential areas in a way that the delivery partners do not travel long distances. Such an arrangement means that the products will be close to the customer.
Technology also has a large part. Once an order is placed by a customer on the app or the web, the system itself locates the closest dark store that has the proper stock of those items in case. It also transfers the order to a delivery partner that is nearest to that store. Waiting time is decreased by this swift synchronization.
Lastly, the delivery partner picks up the order and delivers it directly to the door of the customer. The distance between the dark store and the consumer is small, so the shopping does not take much time, and delivery traditionally takes place within 10-30 minutes. The company makes revenue on the difference between the cost of purchasing and selling products, small delivery charges, and, in some cases, through a partnership with a brand or memberships.
This model is effective since individuals believe in fast and convenient services, and they are usually willing to pay slightly more to acquire them.
Read Also: Top 10 Food Delivery Stocks in India
Advantages of Quick Commerce
Quick Commerce is getting popular because it has many benefits:
- Fast Delivery – Orders usually come in 10–30 minutes, much faster than normal online shopping. Good for urgent needs like baby food, medicine, or cooking items.
- Very Easy – No need to go out or stand in lines. You can order on your phone, and it comes to your door.
- Good for Everyday Items – Mostly sells things people use daily like groceries, milk, snacks, and cleaning products.
- Works Anytime – Many services deliver late at night or early in the morning, even when shops are closed.
- Saves Time – No travel to the shop. You can get items while doing other work.
- Less Waste – You only buy what you need, so less chance of things going bad.
- Happy Customers – Fast and reliable service makes people order again and again.
Challenges and Limitations
Even though Quick Commerce is very useful, it also has some problems:
- High Delivery Costs – Delivering orders in 10–30 minutes means companies need many delivery people ready all the time. This costs a lot in fuel, payments to riders, and managing deliveries. For small orders, it’s hard to cover these costs.
- Low Profits – Most Quick Commerce orders are for cheap items like milk, snacks, or bread. The company earns only a small profit on each item, and with the high cost of fast delivery, it’s difficult to make good money.
- Pressure on Delivery People – Riders have to deliver very quickly, which can cause stress. Sometimes they may drive unsafely to save time, which can lead to accidents, especially in busy traffic.
- Limited Choice of Products – Quick Commerce mainly sells daily-use items. It is not meant for large things like furniture or uncommon products, so customers have fewer choices.
- Stock Problems – Keeping all popular items available in every store is hard. If stock runs out, customers may see “out of stock” often, which can make them unhappy.
- Impact on the Environment – Fast delivery uses more packaging and increases traffic, which can cause more pollution and waste.
- Tough Competition – Many companies are doing Quick Commerce now. To attract customers, they try to deliver faster and sell cheaper, but this can make the business hard to sustain.
Read Also: List of Quick Commerce Company Stocks
Future of Quick Commerce
Quick Commerce is still growing and changing. In the future, we may see:
- More Automation: Use of robots and drones for delivery.
- Expansion to More Cities: Not just metro cities, but smaller towns too.
- Better Sustainability: Eco-friendly packaging and electric delivery vehicles.
- More Variety: Companies may add electronics, clothes, and other items for fast delivery.
Experts believe Q-Commerce will continue to grow, especially in urban areas where people value time over money.
Q-Commerce vs E-Commerce vs Traditional Retail
| Feature | Q-Commerce | E-Commerce | Traditional Retail |
|---|---|---|---|
| Delivery Time | 10–30 mins | 1–3 days | Immediate (buy & take) |
| Product Range | Limited essentials | Very large | Depends on shop size |
| Shopping Method | App-based | Website/App | Physical store |
| Convenience | Very high | High | Medium |
| Price | Slightly higher than wholesale | Competitive | Varies |
In short:
- Q-Commerce is for speed.
- E-Commerce is for variety.
- Retail is for the physical shopping experience.
Conclusion
Quick Commerce is transforming the shopping experience. It is ideal when in an emergency and when small items are needed every day. Q-Commerce is a strategy of making the delivery of products within minutes with the aid of technology, local warehouses, and delivery partners.
Although it is extremely convenient, businesses have to deal with issues such as excessive expenses, safety, and sustainability. Q-Commerce will only get quicker, more environmentally-friendly, and accessible even in the future.
For now, it’s safe to say — shopping has never been this quick!
Frequently Asked Questions (FAQs)
What is Quick Commerce?
Quick Commerce delivers essential items like groceries or medicines to customers within 10–30 minutes using local dark stores.
How does Quick Commerce work?
Orders are placed on an app, packed in nearby dark stores, and delivered instantly by local riders.
Which companies use the Quick Commerce model?
Blinkit, Zepto, and Swiggy Instamart in India; Gopuff and Getir internationally.
What are the benefits of Quick Commerce?
Fast delivery, convenience, 24/7 availability, and access to daily essentials anytime.
What challenges does Quick Commerce face?
High delivery costs, low profits, stock shortages, and sustainability concerns.