The number of credit cards in India reached 108 million in December 2024, which is more than double the number in 2019. Over the past few years, the number of digital payments has grown 6.7 times and the transaction value 1.6 times, making India one of the fastest growing digital economies in the world . With time, the credit card providers have started providing various features and benefits such as contactless payments, UPI integration, BNPL facilities, and advanced security measures.
In this blog, we’ll explore the top 10 best credit cards in India for 2026 and highlight the key factors you should consider before choosing the right credit card for your financial needs.
Top 10 Best Credit Cards in India 2026
| Credit Card Name | Category | Best For | Joining Fee |
|---|---|---|---|
| Axis Bank ACE Credit Card | Cashback & Shopping | Bill, food & recharge discounts | ₹499 + GST |
| Flipkart Axis Bank Credit Card | Cashback & Shopping | Flipkart, Myntra, Cleartrip rewards | ₹500 + GST |
| Amazon Pay ICICI Credit Card | Cashback & Shopping | Amazon shopping, Prime members | 0 |
| SBI Cashback Card | Cashback & Shopping | Weekly shopping, groceries, and movies | ₹999 + GST |
| HDFC Regalia Gold Credit Card | Travel & Lounge Access | Frequent domestic/international travel | ₹2,500 + GST |
| Axis Bank ATLAS Credit Card | Travel & Lounge Access | Edge miles, multi-airline travellers | ₹5,000 + GST |
| HDFC Infinia Metal Edition | Travel & Lounge Access | Luxury global travel & concierge | ₹12,500 + GST |
| American Express Platinum Travel Card | Travel & Lounge Access | Travel vouchers & Taj stays | ₹5,000 + GST |
| HPCL IDFC FIRST Power Credit Card | Fuel & Utility | Petrol discounts & utility expenses | ₹199 + GST |
| IndianOil Axis Bank Credit Card | Fuel & Utility | Fuel at IndianOil pumps | ₹500 + GST |
Overview of the Best Credit Cards in India 2026
An overview of the top 10 credit cards in India is given below:
1. Axis Bank ACE Credit Card
If you want to save money directly from everyday expenses be it bills, food delivery or travel then Axis Bank ACE is the best choice for you. This card offers straight cashback, without any complicated reward points system.
Cashback Highlights
- 5% cashback on utility bills & mobile‑DTH recharges via Google Pay (up to ₹500 per month)
- 4% cashback on apps like Swiggy, Zomato, Ola (up to ₹500 per month)
- 1.5% cashback on all other spends, without any cap
Extra Rewards
- 4 free domestic lounge visits on spends of ₹50,000 in the last 3 months.
- Fuel surcharge waiver: Up to 1% in ₹400–₹4,000 range (₹500/month cap)
- Up to 15–20% discount at 4,000+ partner restaurants.
Fees & Waiver :
- Joining Fee: ₹499 + GST (First year waiver possible)
- Annual Fee: ₹499 + GST from second year onwards, waiver on fees if annual spend is more than ₹2 lakh.
Overall, Axis ACE is a simple and powerful cashback card, helping you earn cashbacks on everyday spends in a smart way.
2. Flipkart Axis Bank Credit Card
For those who buy from platforms like Flipkart, Myntra or Swiggy for their daily needs, this card proves to be a great deal. With guaranteed cashback on every purchase and numerous partner offers, this card makes daily spending rewarding.
Cashback benefits
- 5% assured cashback on transactions on Flipkart and Cleartrip
- 4% cashback on brands like Swiggy, Uber, PVR
- 1.5% cashback on all other spends, without any limit
- Upon activation, get a Flipkart voucher of ₹500 and exclusive discounts on Swiggy
Extra rewards on travel and lifestyle
- 4 complimentary domestic lounge visits on spending ₹50,000 annually
- Up to 20% discount at select restaurants, under the Dining Delights program
Fuel and EMI convenience
- 1% surcharge waiver on fuel transactions from ₹400 to ₹4,000, up to ₹400 per month
- 1.5% unlimited cashback on transaction value on converting Flipkart merchant transaction to EMI.
Fees and Variants
- Joining Fee ₹500 + GST
- Annual fee waiver from next year if spending ₹3.5 lakh in a year
For those who shop regularly on e-commerce, this card offers great cashback along with travel and dining benefits. A complete rewards package that gives more value at a low fee.
3. Amazon Pay ICICI Bank Credit Card
If shopping from Amazon has become a habit, then this card opens the way to smart savings with great cashback on every order. The best part – this card is life-time free, i.e. no joining or annual fee is required.
Cashback Benefits :
- Prime members get 5% cashback on Amazon
- Non-Prime members get 3% cashback
- 2% cashback on Amazon Pay partners like Swiggy, BookMyShow
- 1% cashback on all other expenses, directly in Amazon Pay balance
Key points :
- No limit on cashback
- Completely digital onboarding, without any paperwork
- The card can be used instantly by linking it to Amazon account
Fuel surcharge and EMI facility :
- 1% surcharge waiver on fuel transactions of ₹400 to ₹4,000
- Facility to convert any big expense into EMI is also available
Fees and charges :
- Zero joining fee and zero annual fee, i.e. completely free
- No hidden charges, everything is transparent
Whether you are a Prime member or occasional shopper – Amazon Pay ICICI card gives you the opportunity to save on every transaction, without any hassle. This free card turns every spend into a smart investment.
4. SBI Cashback Card
For those making frequent digital payments, this card is very beneficial. You get assured cashback on every expense, which gets adjusted directly in the next billing cycle – no reward points, no hassle of redemption.
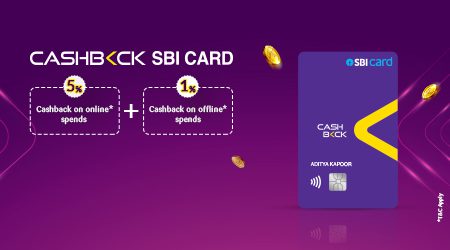
Cashback Highlights :
- 5% cashback on online partner brands
- 1% cashback on all other card spends
- Cashback gets automatically adjusted in the monthly billing statement
- No manual redemption required
Travel & EMI Benefits :
- 4 complimentary lounge access annually at domestic airports
- Facility to convert big spends into EMIs also available
Fuel Waiver & Limitations:
- 1% surcharge waiver on fuel spends between ₹500 and ₹3,000
- No cashback on wallet load, rent, and select utility payments
Fees & Waiver :
- Joining & Annual Fee: ₹999 + GST
- Full annual fee waived off after spending ₹1 lakh in a year
Cashback SBI Card is the easiest way to get direct cashback — without any technical points system, providing benefits directly in the credit card bill.
5. HDFC Regalia Gold Credit Card
HDFC Regalia Gold is designed for those who want to get something extra from every expense – be it shopping, travel or luxury lifestyle. It offers huge rewards and great travel benefits.
Key Highlights :
- Get 20 reward points per ₹150 on spends at Marks & Spencer, Myntra, Reliance Digital and Nykaa
- Get 4 reward points per ₹150 on all other spends
- Get flight vouchers worth up to ₹10,000 on annual spends of ₹5 lakh and an additional voucher of ₹5,000 on spends of ₹7.5 lakh
- ₹1,500 vouchers on spending ₹1.5 lakh every quarter
Lounge & Travel Privileges :
- 12 complimentary lounge access annually in India
- 6 complimentary accesses through Priority Pass for international travel
- Accidental air insurance worth ₹1 crore and overseas hospitalization cover up to ₹15 lakh
Redemption & Flexibility :
- Reward points can be redeemed for flights, hotels, luxury gifts and statement balance
- From SmartBuy Value on redemption is ₹0.50-₹0.65 per point
Charges & Waiver :
- Joining & Annual Fee: ₹2,500 + GST
- Fee waiver for next year if you spend ₹4 lakh in a year
HDFC Regalia Gold is a premium card that rewards smart spenders at every level – be it luxe shopping or annual international trips.
6. Axis Bank ATLAS Credit Card
Axis Bank Atlas is designed for those who travel frequently and want to make the most of every international or domestic trip. This card covers your every travel need — from lounge access to airmiles.
Travel-Focused Benefits :
- Complimentary lounge access at both domestic and international airports
- Silver, Gold and Platinum Tier Status available as per spending
- Miles System Earned EDGE Miles can be redeemed across multiple international airline partners.
Milestone & Rewards :
- 5 EDGE Miles are earned for every ₹100 spent internationally
- 2 EDGE Miles are earned per ₹100 spent domestically
- Platinum Tier benefits are unlocked when you spend ₹7.5 lakh annually
- ₹5,000 Welcome Voucher (in lieu of ₹5,000 joining fee)
Global Lounge & Insurance :
- Up to 12 complimentary international lounge access per year via Priority Pass
- Comprehensive Travel Insurance which includes air accident cover and emergency hospitalization
Miles Redemption :
- EDGE Miles can be converted into flights, hotels or partner airline miles
- 1 EDGE Mile can be worth up to ₹1 when redeemed through Axis Bank Travel EDGE platform for flight and hotel bookings.
Charges & Waiver :
- Joining/Annual Fee: ₹5,000 + GST
Axis Atlas is perfect for travellers who want to earn rewards from every flight booking, international trip or luxury travel. This card not only gives miles but also access to a premium lifestyle.
7. HDFC Infinia Metal Edition
If you are looking for a card that is the perfect combination of luxury, travel and high-end rewards, then HDFC Infinia Metal Edition is the best option. This card is available on an invite-only basis, and is designed for high-spenders.

Key Highlights :
- 5 reward points on every ₹150 spent
- Unlimited Complimentary Airport Lounge Access – both in India and abroad
- Club Marriott membership is available in leading hotel chains, which can save up to 20%
- For golf enthusiasts: Unlimited complimentary golf games
Travel & Lifestyle Privileges :
- Points redemption value up to ₹1 per point on flights, hotels and premium products
- Global lounge network benefits through Diners Club network
- Air accident insurance and medical emergency coverage worth ₹1 crore
Rewards & Benefits :
- Points have no expiry
- Reward Points can be converted into flights, hotels, airmiles or statement credit
- 10X rewards on select transactions through SmartBuy
Charges & Eligibility :
- Joining & Annual Fee: ₹12,500 + GST
- Next year’s fee gets waived once you spend ₹10 lakh annually
HDFC Infinia is for those who live a premium lifestyle and want maximum value from every spend. This card is not just a payment tool, but a statement – of luxury and status.
8. American Express Platinum Travel Card
For frequent travellers, this card makes every flight and hotel booking more rewarding. With great reward points and travel vouchers, you get the most out of every spend.
Key Travel Benefits :
- Get a Taj Experiences E-Gift card worth ₹10,000.
- 15,000 membership points on annual spend of ₹1.9 lakh that can be redeemed on Platinum Travel Collection or Amex Travel Online.
- Complimentary airport lounge access – 8 domestic visits every year
Reward Program :
- 1 Membership Reward Point for every ₹50 spent
- MR Points can be easily redeemed for flights, hotel bookings and gift vouchers
- Milestone-based benefits increase travel rewards every year
Annual Fees & Charges :
- Joining Fee: ₹3,500 + GST
- Renewal Fee: ₹5,000 + GST
- Extra value through Amex Offers and dining privileges
American Express Platinum Travel Card is a perfect choice for those who want to spend more significantly on travel. Travel is a huge part of lifestyle and the more you spend, the greater the travel benefit — that too with a seamless and premium experience.
9. HPCL IDFC FIRST Power Credit Card
The HPCL IDFC FIRST Power Credit Card is designed for individuals who frequently spend on fuel, utility bills, and daily essentials. With impressive fuel savings, UPI compatibility, and added perks like roadside assistance, it’s one of the most value-driven fuel credit cards in India.
Key Benefits :
- Up to 5% savings on fuel at HPCL outlets
- 2.5% savings on grocery, utility bills, and IDFC FASTag recharges
- 2X Reward Points on all other retail and UPI spends
- Complimentary Roadside Assistance up to 4 times a year (worth ₹1,399)
Reward Structure :
- 15X Reward Points on fuel purchases at HPCL outlets (up to 5% value)
- 15X Reward Points on grocery, utility, and FASTag recharge (up to 2.5% value)
- 2X Reward Points on all other UPI and retail spends (up to 2.5% value)
- 1 Reward Point = ₹0.25 when redeemed
Annual Charges :
- Joining Fee: ₹199 + GST
- Annual Renewal Fee: ₹199 + GST
- Fee Waiver: Annual fee is waived on spends of ₹50,000 or more in a card anniversary year
If your monthly budget includes regular fuel, utility, and UPI spends, the HPCL IDFC FIRST Power Credit Card is a smart, low-fee option. It combines practical benefits with good cashback potential and extra perks like roadside assistance, making it an excellent everyday card.
10. IndianOil Axis Bank Credit Card
If you want to manage your everyday fuel expenses smartly, then IndianOil Axis Bank Credit Card is a practical and rewarding option. Especially for those who use their vehicle daily.
Key Benefits :
- Up to 5% benefit at IndianOil petrol pumps (4% value back + 1% surcharge waiver)
- 20 Reward Points are available on ₹100 spent at IOCL outlets.
- 1% cashback is available on online shopping
- Up to 15% discount on dining – through Axis Bank’s Dining Delights program
Reward Structure :
- ₹100 fuel spend = 20 RP (₹5 value)
- ₹100 online spends = 1 RP
- ₹100 other spends = 1 RP
- RP can be converted into cashback or vouchers
Annual Charges :
- Joining Fee: ₹500 + GST
- Annual Fee: ₹500 (waived off on ₹50,000 annual spend)
- Welcome benefit: ₹250 worth fuel vouchers on 1st transaction within 30 days
This card is for people who spend a significant portion of the month on fuel and want a consistent cashback on the same spend. If you want to make your daily commute a little more economical, this is a solid choice.
Read Also: Understanding the Difference Between Credit and Debt
How to Choose the Best Credit Card in India in 2026
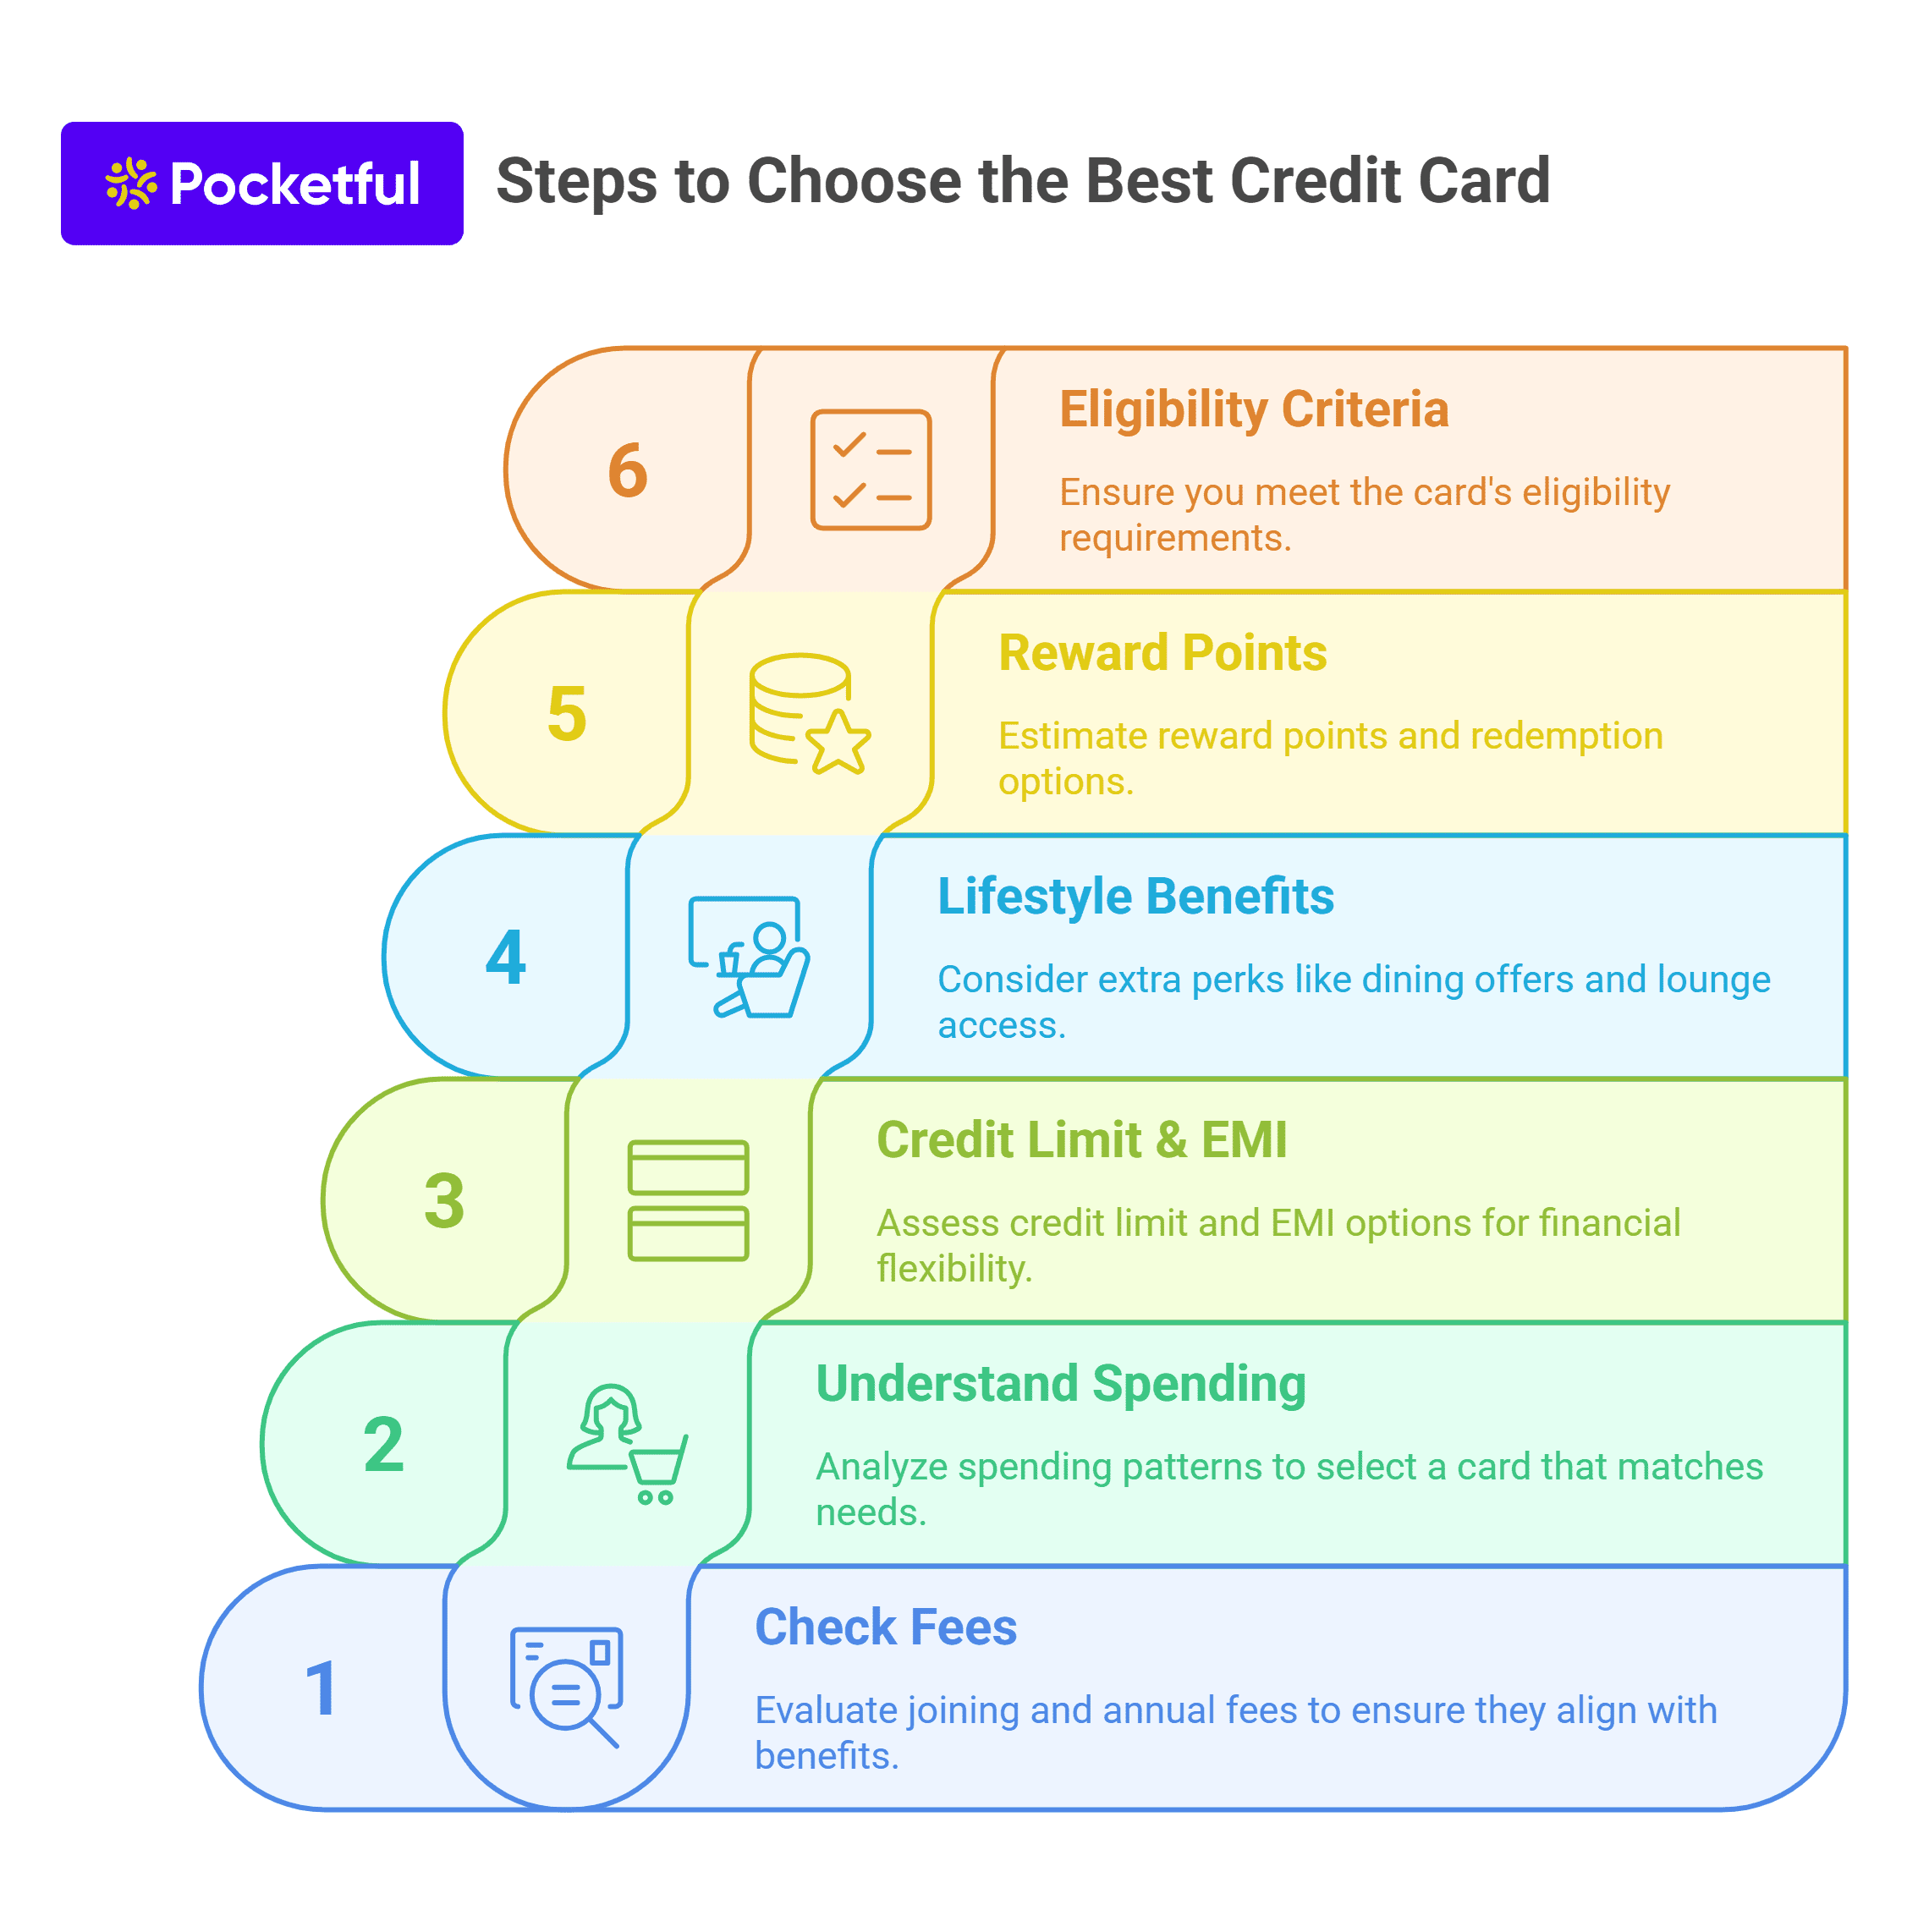
It is crucial that a credit card be chosen wisely as cards with non-exclusive features and hefty fees can become a burden instead of a benefit. Therefore, some checks should be done before getting a card.
- Check Joining and Annual Fees : Many credit cards have a joining or annual fee attached to it. If the benefits are less and the fees are high, then that card will not be beneficial.
- Understand the Spending Pattern : It is important to know how you spend your money – online shopping, travel or daily use so that the card can be chosen according to your needs.
- Credit Limit and EMI facility : Check the limit of the card and whether there is a facility to convert big expenses into EMI – move ahead only after knowing this.
- Focus on Lifestyle Benefits : Extra benefits like dining offers, airport lounge access, fuel surcharge waiver add a lot of value in the long run.
- Check the Reward Point System : Estimate the number of reward points that can be received based on your average expenditure and check how they can be redeemed.
- Understand the Eligibility Criteria : Before choosing any card, make sure to check how easy or difficult its eligibility criteria are as some cards are invite-only.
Read Also: Credit Score: What Is It And How It Impacts You?
How to Invest in Credit Card Stocks in India
- Direct Investment:
- SBI Cards and Payment Services Ltd. (SBICARD): The only publicly listed pure-play credit card company in India.
- Process: Open a Demat and trading account with a stockbroker (e.g., via apps like Pocketful, INDmoney, Groww). Search for “SBICARD” and place a buy order.
- Indirect Investment (via Banks):
- Major Banks: Invest in large banks with significant credit card operations, as this segment contributes to their overall profitability.
- Examples: HDFC Bank, ICICI Bank, Axis Bank, Kotak Mahindra Bank, RBL Bank.
- Process: Similar to SBICARD, buy shares of these banks through your stockbroker.
Conclusion
Choosing a suitable credit card should not be based only on the offers or rewards but also on the user’s lifestyle, spending pattern and the facilities offered. In this blog, we have covered the top credit cards across different categories along with their features, charges and benefits. It is important to carefully understand the rewards structure, fees and eligibility criteria of each card before making a final decision so that the choice is in line with your financial goals.
Read Also: Decoding Credit Risk Funds In India
Frequently Asked Questions (FAQs)
What are Credit Cards?
A credit card allows cardholders to borrow money and repay it, including interest and other agreed-upon charges, either in full by the billing date or over time in the form of EMIs.
Which debit card type is most prevalent in India?
The popularity of Contactless Debit Cards has seen a massive uptrend.
Should I get a credit card?
A credit card helps you manage your finances by allowing you to repay after the billing cycle. While this is a revolutionary invention, people should be cautious and prevent maxing out their credit card limits. So, the decision to opt for a credit card should be taken after careful consideration.
What was the first credit card in India?
The first credit card in India was introduced by the Central Bank of India in collaboration with MasterCard and Visa in the late 1970s. It was known as the “Central Card”.
Can cash be withdrawn from an ATM using a credit card?
Yes, but immediate interest and cash advance charges are levied on it.
How is the credit card limit decided?
It depends on your income, credit score and repayment history.
Is there an annual fee for every card?
Some credit cards are lifetime free while others have annual charges.
What is the impact of delayed credit card payment?
Late payment attracts a late fee and also affects the credit score.
Is it necessary to provide income proof for every credit card?
Yes, income proof or ITR is required for most cards.
What is the most widely accepted type of credit card?
Visa and Mastercard are the most widely accepted credit cards due to their international presence.