Category: Trading

  • What Does CNC, MIS and NRML Mean?

    What Does CNC, MIS and NRML Mean?

    When trading, knowing the types of orders is crucial for maximising your profit potential. For both experienced investors and inquisitive beginners, technical jargon such as CNC, MIS, and NRML can be daunting if they are not well-versed in their meanings and uses. By breaking down these concepts, you can make more informed decisions that align with your trading strategy. Each order type holds a distinct purpose, catering to participants with different risk profiles and investment objectives.

    In this blog, we will explain CNC, MIS and NRML orders to help you make better investment decisions. Understanding various order types will help you improve your efficiency in the financial markets.

    What are CNC, MIS, and NRML orders?

    The acronyms CNC, MIS, and NRML stand for:

    • CNC – Cash & Carry
    • MIS – Margin Intraday
    • NRML – Normal

    These terms are used in stock trading to describe different types of orders or margin needs for trading. Now, let us understand each one of them separately.

    Cash & Carry (CNC)

    CNC orders are used for equity delivery trading, allowing traders to buy shares and hold them in their demat accounts until they decide to sell. No margin is given for CNC orders, and full payment for the stocks is done by the trader. For example, if you buy shares worth INR 5000, then you must have INR 5,000 in your trading account to complete the transaction.

    There are no time constraints or expiration dates, and you can retain the shares for as long as you desire. When you buy shares with CNC orders, they are delivered to your account and are kept there until you choose to sell them. This type of order is considered ideal for long-term investors who want to accumulate shares and sell them later for possible capital gains.

    Example: When you buy 100 shares of a company at INR 500 each through a CNC order, your total investment amount will be INR 50,000. The shares bought will be credited to your demat account, and you can hold them as long as you wish.

    Similarly, when you sell shares through a CNC order, the shares are debited from your demat account, and the proceeds from the sale are credited to your trading account within the T+1 days (trade day plus one working day).

    MIS Orders

    MIS stands for Margin Intraday Square-Off. It is a type of order used for intraday trading. When you execute an MIS order, you are borrowing more money from your broker to buy or sell shares, with the understanding that you will square off all your trading positions by the end of the trading day.

    If you do not close your position before the market closes, your broker will do it for you, regardless of your profit or loss. These orders carry more risk than CNC orders because of the leverage used, which can lead to huge losses if the market does not move in your preferred direction. MIS orders are a smart choice for traders who understand the market well and understand the related risks. However, it is important to use them carefully and have a clear trading strategy.

    Example: Let’s say you want to buy 100 shares of ABC company at INR 2500 per share, and you have INR 25000 in your demat account. Without MIS, you can only buy 10 shares (INR 25,000/INR 2500 = 10 Quantity). With MIS, your broker can provide you leverage and help you buy 100 shares even though you do not have the full amount. Keep in mind that MIS orders need to be squared off before the market closes.

    NRML Orders

    NRML Orders, or Normal Margin Orders, are a specific category of orders used in the Indian stock market, mainly for trading futures and options (F&O). These orders let traders hold their futures and options positions until the contract expires, unlike day trading orders that must be sold on the same day. This flexibility allows traders to capitalise on trends that develop over several trading sessions. NRML orders require traders to keep the full margin amount set by the exchange.

    Example: Suppose you place a NRML order on your trading platform to buy a futures contract and wish to hold the derivative contract for several days. The exchange will evaluate the required margin for this order based on the underlying asset’s current market price. Let us say that the margin requirement is INR 25,000. The broker will verify that you have enough funds in your account to cover the margin requirements. If the order is executed, then the trader holds a long position in the derivative contract.

    Difference between CNC and MIS orders

    Basis CNC OrdersMIS Orders
    Full FormCash & CarryMargin Intraday Square-off
    PurposeUsed for equity delivery tradingUsed for intra-day trading
    Holding PeriodYou can hold the shares as long as you want to without any time limit.Positions must be squared off by the end of the trading day. If you do not manually close the trade, the broker will do it on your behalf.
    Margin & LeverageNo leverage is given. A trader needs to pay the full price of the shares when he buys.Leverage is given, i.e., a trade can trade with a higher amount than the money he actually has.
    Trading StrategyGood fit for long-term investors who want to hold shares for weeks, months or years.Good fit for day traders who want to make quick profits from short-term price fluctuations in the market.

    Conclusion

    Understanding the differences between CNC, MIS, and NRML orders is important for effective trading and risk management. Aligning your choice of orders with your trading goals, such as short-term gains or long-term wealth accumulation, can help you navigate the stock market and optimise your returns. Understand how each order type aligns with your trading plan and trade with a clear strategy.

    Frequently Asked Questions (FAQs)

    1. Do I get leverage in CNC orders?

      No, CNC orders do not provide leverage. One must pay the full amount for the shares.

    2. Is trading done via CNC orders risky?

      Trading with CNC orders is generally less risky as it does not involve leverage, and you can hold the shares as long as you want without any time restriction.

    3. Can I convert an MIS order to CNC?

      Some brokers allow you to convert MIS orders to CNC if you want to hold the shares overnight. However, you will need extra funds to hold the shares overnight.

    4. Can NRML orders be used for intra-day trading?

      NRML orders can be used for intraday trading, but they are mainly used for carry-forward trading in futures and options.  

    5. Which order type should I use for long-term investing?

      CNC is best for long-term investing since it allows you to hold stocks in your demat account without any time limit.

  • Top 10 Books for Beginners in Trading & Investing

    Top 10 Books for Beginners in Trading & Investing

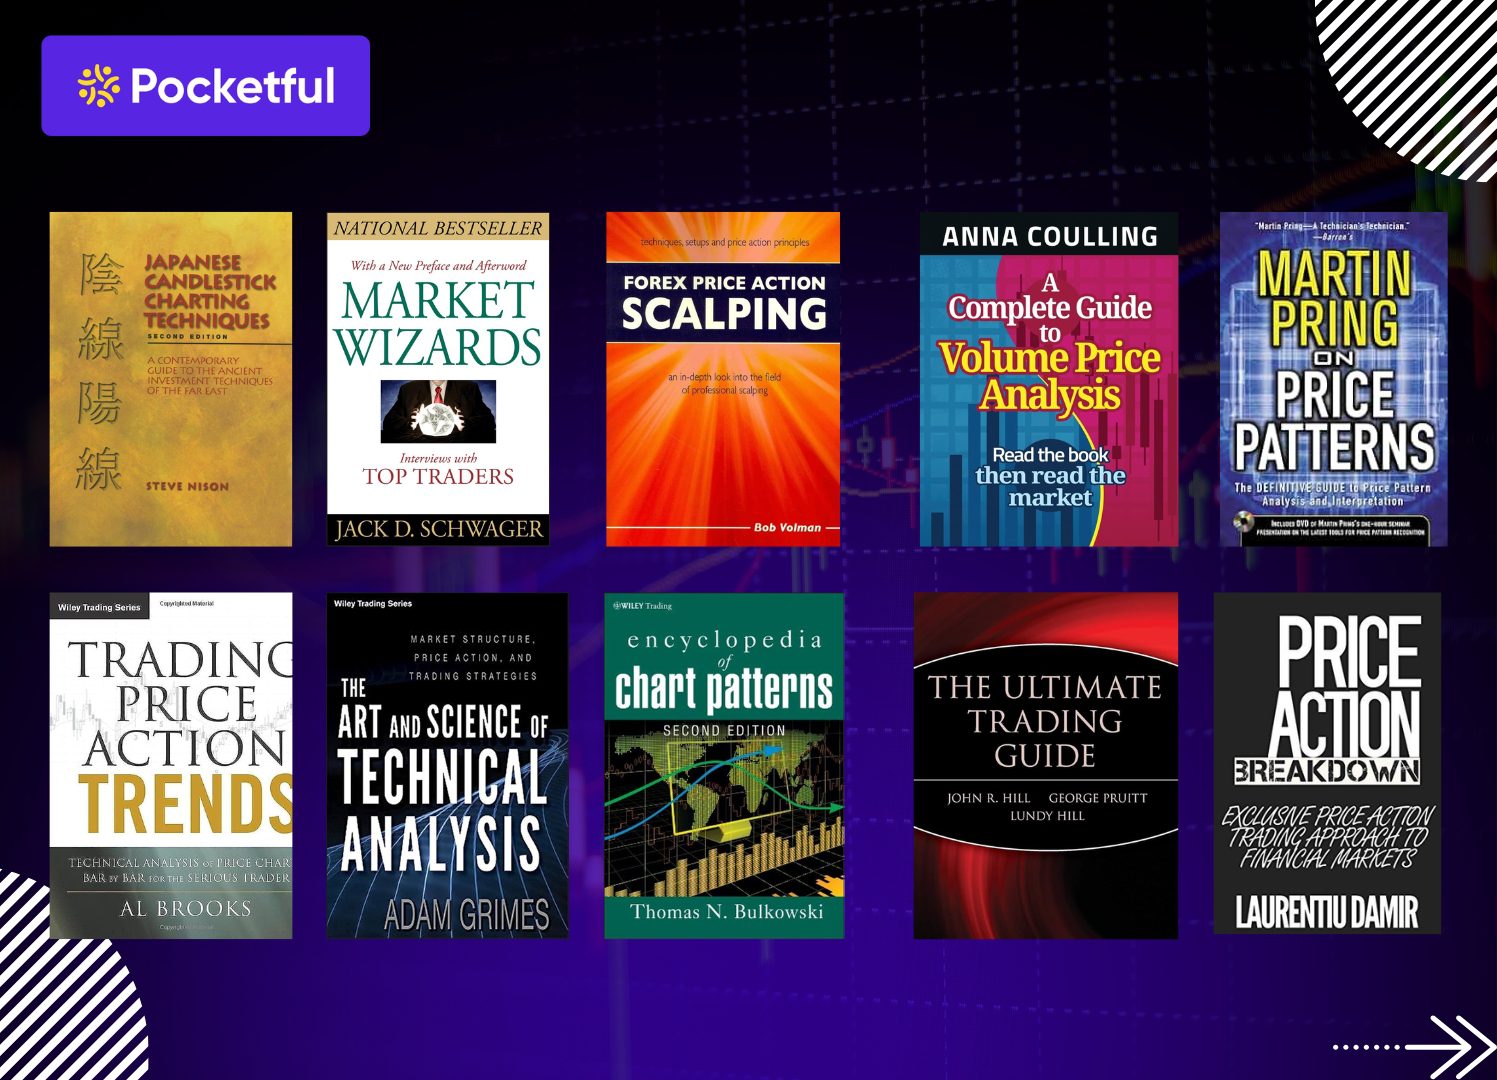
    Welcome to our guide on the top 10 books for beginners in trading and investing. These carefully selected books will give you invaluable insights, regardless of your investing experience. These books are put together in such a way that one gets knowledge and develops confidence in the successful navigation of the stock market – from foundational principles to practical strategies. Dive in to uncover the best resources you need to build a solid investment foundation!

    List of Top 10 Trading & Investing Books for Beginners

    S.No.Book NameYearName of the AuthorPagesRating (Goodreads)
    1The Intelligent Investor1949Benjamin Graham6404.22
    2A Beginner’s Guide to the Stock Market2020Matthew R. Kratter2824.3
    3A Random Walk Down Wall Street1973Burton G. Malkiel4964.14
    4Common Stocks and Uncommon Profits1958Philip A. Fisher2724.16
    5The Little Book That Still Beats the Market2005Joel Greenblatt1764.2
    6One Up on Wall Street1989Peter Lynch & John Rothchild3044.25
    7The Warren Buffett Way1994Robert G. Hagstrom3204.18
    8How to Make Money in Stocks1988William J. O’Neil4644.1
    9The Little Book of Common Sense Investing2007John C. Bogle2404.32
    10Rule #12006Phil Town3224.12

    Best Books on the Stock Market – An Overview

    An overview of the best books for beginners in trading and investing are given below:

    1. The Intelligent Investor

    This book by Benjamin Graham is one of the best investment books for beginners and experts. The motive of this book is to help potential investors avoid errors while making investments and help them achieve their investment goals. Benjamin Graham was Warren Buffet’s mentor. The principles and investment strategies mentioned by Graham in this book can help investors develop a successful investing strategy without taking excessive risk. This book clears up every doubt of first-time investors and enhances the understanding of the stock market and value investing. The book is filled with practical examples of what to look for while choosing stocks. 

    The Intelligent Investor

    2. A Beginner’s Guide to the Stock Market

    “A Beginner’s Guide to the Stock Market” by Matthew R. Kratter provides an easily understood introduction to investing in the stock market for a beginner. A hedge fund manager himself, Kratter shares practical knowledge and insights he has amassed during his years in financial markets. He includes vital information on how to purchase and sell stocks, understand the mechanics of the market, and common mistakes one should avoid. He simplifies these concepts so they are easily understood by someone new to investing. Readers learn practical strategies for stock picking, risk management, and building a profitable portfolio from scratch.

    A Beginner’s Guide to the Stock Market

    3. A Random Walk Down Wall Street

    “A Random Walk Down Wall Street” by Burton G. Malkiel is a classic, timeless book that explains a path toward long-term investing. The book provides in-depth views on the efficient market hypothesis, indexing, and asset allocation, focusing on how selecting individual stocks and timing the market often results in a waste of time. He makes the case that for most people, the smartest choice is to go with low-cost index funds. He offers historical evidence and practical advice to support his approach, which would form a good resource for a beginning investor interested in a clear, evidence-based investment approach.

    A Random Walk Down Wall Street

    4. Common Stocks and Uncommon Profits

    “Common Stocks and Uncommon Profits” by Philip Fisher is nothing less than a seminal work in growth investing, generally regarded as essential reading for any investor who wants to identify high-quality stocks. Fisher is a highly respected pioneer in investment analysis, known, among other things, for his observation that qualitative information about companies is even more important than quantitative information. Fisher points out the 15-point stock checklist he adheres to, ranging from management quality to competitive advantage to market potential to help investors identify, buy, and hold on to great companies. He also stresses that one should conduct enough research to understand a company’s true potential rather than mere financial statements.

    Common Stocks and Uncommon Profits

    5. The Little Book That Still Beats the Market

    “The Little Book That Still Beats the Market” by Joel Greenblatt outlines in a very simple yet powerful way how to invest in stocks with his “magic formula” so that even unsophisticated investors can beat the market. This book lays out in a structured manner how one might find undervalued stocks that have high returns on capital, which includes buying good companies at bargain prices. Greenblatt describes his formula in a super simple way that any reader can understand. Through a step-by-step process, readers learn how to build a portfolio of stocks to generate consistent and above-average returns. 

    6. One Up on Wall Street

    “One Up on Wall Street” by Peter Lynch is a timeless guide that allows individual investors to use their own experiences and knowledge from everyday life to find winning stocks before the professionals on Wall Street can. Lynch, known for his long tenure as manager of Fidelity’s Magellan Fund, had unsurpassed success, time and again beating the market through his practical, hands-on investment approach. The book lays out Lynch’s investment philosophy-what to do, what not to do. He discusses how one has to do one’s own research and invest in what one knows. He teaches how to value companies and when to buy, hold, and sell. Lynch’s approach focuses on common sense in identifying opportunities in everyday life and knowing companies inside and out.

    7. The Warren Buffett Way

    “The Warren Buffett Way” by Robert G. Hagstrom gives an in-depth insight into the investment strategies and philosophies of Warren Buffett, one of the most successful investors in history. As an experienced portfolio manager and author, Hagstrom breaks down Buffett’s investment approach and makes it available to investors who want to model their investments after his proven track record. He enumerates Buffett’s principles on value investing: a comprehensive business analysis, evaluation of management, and breakdowns of financial statements. Furthermore, the author explains case studies that summarize Buffett’s major investments and shows how he applies those principles in practice. Patience, discipline, and exhaustive research are taught as key tenets to adhere to when making investment decisions. 

    The Warren Buffett Way

    8. How to Make Money in Stocks

    “How to Make Money in Stocks” by William J. O’Neil explains the CAN SLIM investment strategy, developed to help investors pick high-growth stocks and build a lucrative portfolio. The founder of Investor’s Business Daily, William J. O’Neil, is an investor and financial markets expert recognized for using data in his investment approach. The author explains how to implement the CAN SLIM strategy- a technical analysis-based method of stock selection centered on seven characteristics shared by winning stocks. Major themes discussed include chart reading, risk management, and timing. O’Neil stresses the importance of sticking with market trends and investing in stocks with huge earnings growth. 

    How to Make Money in Stocks

    9. The Little Book of Common Sense Investing

    “The Little Book of Common Sense Investing” by John C. Bogle is a straightforward guide that has generally argued for the lowest-cost index fund investing and has presented a simplified and uncomplicated way to implement a very effective long-term wealth-building strategy. This book contends that most actively managed funds cannot beat the market because of the high fees and turnover. Bogle shows that for the average investor, a low-cost index fund has the highest probability of success because such a fund represents the overall market. He stresses key concepts such as patience, low costs, and the magic of compounding for investing success. 

    10. Rule #1

    “Rule #1” by Phil Town provides an easy-to-follow guide to value investing as it demystifies the process of finding high-quality stocks with potentially substantial returns. An accomplished investor and author, Town shares his investment philosophy rooted in the principles of Warren Buffett while showing individual investors how to take action. The book shows Town’s “Rule #1” investment methodology, where much emphasis is placed on buying stocks at a significant discount to their intrinsic value. It explains how to assess companies through a simple framework and places considerable emphasis on financial analysis and disciplined investing. Readers learn how to identify undervalued stocks, manage risk, and construct a solid investment portfolio with a long-term outlook. 

    Rule #1

    Read Also: Trading For Beginners: 5 Things Every Trader Should Know

    Conclusion

    To summarize, the 10 books mentioned above would be very helpful in teaching you essential concepts to start your trading and investment journey. Each book imparts knowledge and practical advice in ways that will help you develop a strong understanding of the market and investment skills. You will gain the ability and professional acumen required to make better investment decisions and achieve your financial goals. Enjoy reading these books, and all the best for your success in the world of investing.

    S.NO.Check Out These Interesting Posts You Might Enjoy!
    1Top 10 Option Trading Books in India
    310 Best Algorithmic Trading Books
    4Best Stock Market Traders in the World
    65 Must-Read Best Swing Trading Books for Trader
    710 Best Personal Finance Books to Read

    Frequently Asked Questions (FAQs)

    1. Do I need to read all these books to start investing?

      No, it is not necessary to read them all. It’s sufficient to start with a few books that interest you the most and gradually move on to other books as your knowledge base expands.

    2. How do you choose which book to start with among the 10 books mentioned above?

      An individual should consider his/her level of knowledge and investment goals. “A Beginner’s Guide to the Stock Market” by Matthew R. Kratter is one of the best books for building a strong foundation.

    3. How can I put into practice what I learn from these books?

      Apply strategies and principles learned from these books by making small investments, analyzing companies, and building new techniques based on your investing style over time. However, it is advised to consult a financial advisor before investing.

    4. Are these books available in digital formats?

      Most of the above-mentioned books are available in digital formats, such as eBooks and audiobooks.

    5. Will any of these books be useful in planning my retirement?

      The principles and strategies discussed in these books can be used for retirement planning by building a diversified portfolio focusing on long-term growth.

  • Bullish Doji Star Pattern

    Bullish Doji Star Pattern

    Are you eager to enhance your technical analysis skills? This candlestick pattern can assist you in recognizing possible trend reversals. This blog post will examine the Bullish Doji Star, including its components, trading implications, advantages, and limitations, along with a real-world example. Understanding this pattern can give both seasoned traders and beginners a good command of the financial markets.

    What is the Bullish Doji Star Pattern?

    Bullish Doji Star Pattern

    The Bullish Doji Star is a candlestick pattern indicating a possible bullish reversal from a downtrend. The pattern consists of two candlesticks and the market should be in a downtrend before the formation of the pattern. The traders need to observe certain criteria:

    • A long red bearish candle shows a significant downtrend and highlights its intensity leading up to a possible reversal.
    • A Doji candle featuring a small body indicates that the opening and closing prices are virtually identical. It shows uncertainty or a pause in the market.

    How to Determine Target and Stop-Loss?

    A simple method is to set a target just below the next resistance level. During a downtrend, previous highs can act as resistance following a market reversal.

    An alternative approach is to establish the target price according to a predefined risk-reward ratio. For instance, traders pursue a risk-reward ratio of 1:2 or 1:3, which means that for every unit of risk assumed, the goal is to secure two or three times that amount in profit.

    Setting a stop-loss is important for managing risks when trading a Bullish Doji Star pattern. A highly effective strategy involves positioning the stop-loss just beneath the low of the Doji candle. Traders sometimes set their stop-loss below a key support level. A drop below this level means the bullish reversal has failed, suggesting the downtrend will continue.

    You can also trail the stop-loss as the asset price moves upwards. It will help you to secure profits as prices rise while also protecting against losses. 

    Read Also: Dragonfly Doji Pattern

    Example of Bullish Doji Star of IRB Infra Dev Ltd.

    Example of Bullish Doji Star of IRB Infra Dev Ltd.

    The chart above clearly shows the formation of the Bullish Doji Star pattern on the daily timeframe of IRB INFRA.

    A long red candle is formed after a strong downtrend and is followed by a small green Doji candle. Afterwards, an uptrend can be seen.

    Advantages of Bullish Doji Star Pattern

    The advantages of the Bullish Doji Star Pattern are:

    • The main benefit of Bullish Doji Star is its clear signal of a possible trend reversal. It helps traders choose the best point to enter long positions by identifying the shift from a downtrend to an uptrend.
    • The pattern reveals the prevailing market sentiment. The initial bearish candle shows strong selling pressure, followed by indecision, and then a bullish candle confirms that buyers are in control. Recognizing this shift helps traders better understand market sentiment.
    • It can be applied effectively in several market conditions and can be used across various timeframes, providing traders with valuable insights into possible reversals. This adaptability makes it a popular choice among both novice and experienced investors alike.

    Limitations of Bullish Doji Star Pattern

    The limitations of the Bullish Doji Star Pattern are:

    • A major drawback of the Bullish Doji Star pattern is that it necessitates confirmation from the subsequent candlestick to validate its reliability. Any delay can lead to missed trading opportunities.
    • Similar to many technical indicators, the Bullish Doji Star may not consistently provide reliable signals. It can give false signals, especially in highly volatile markets.
    • The pattern needs confirmation, so it often lags behind the market. This lag can be especially problematic in volatile markets where conditions change rapidly. By the time the pattern plays out and a trader enters the market, much of the price movement may already have taken place, diminishing the profit.

    Read Also: Long-Legged Doji Candlestick Pattern

    Conclusion

    The Bullish Doji Star is an effective pattern to identify possible reversal from a downtrend to an uptrend. Traders can increase their likelihood of executing successful trades by grasping the psychology behind market patterns, utilizing volume as a filter, and validating the patterns with the subsequent bullish candle. While technical patterns can be helpful, they are not always reliable. Traders should always use it alongside other tools and indicators to find a high-probability setup and manage risk effectively. It is advisable to consult a financial advisor before trading.

    Frequently Asked Questions (FAQs)

    1. What does the Doji candle represent?

      The Doji candle represents market indecision, where the opening and closing prices are almost equal.

    2. When should I enter a trade while using the Bullish Doji Star pattern?

      A trader can create a long position after confirmation, such as the occurrence of a bullish candle, increased volumes, or using other technical indicators.

    3. Can the Bullish Doji Star appear in any market?

      Yes, the pattern works on different timeframes and various markets like stocks, forex, commodities etc.

    4. Is the Bullish Doji Star pattern reliable?

      The Bullish Doji Star pattern can be helpful while trading, but it is not completely reliable. Combining it with other technical analysis tools can improve its reliability.

    5. Should I consult with a financial expert before trading a Bullish Doji Star pattern?

      Yes, it is always suggested to consult with a financial expert before making any investment or trading decisions. 

  • Long-Legged Doji Candlestick Pattern

    Long-Legged Doji Candlestick Pattern

    The Long-Legged Doji candlestick represents a situation where the market indecision meets volatility. A Long-Legged Doji is a candlestick pattern usually accompanied by high volatility but ends with no clear winner between bulls and bears. The pattern suggests indecision and can behave both as a reversal or a continuation pattern. Let’s dig deeper into it.

    What is a Long-Legged Doji Candlestick Pattern?

     Long-Legged Doji Candlestick Pattern

    A Long-Legged Doji pattern is a type of candlestick pattern that can be observed in a candlestick chart. It is characterized by a long upper and lower shadow (or wick), with a very small or nearly invisible real body. The real body is small because the open and close prices of the asset are very close or equal to each other, indicating high volatility. This pattern reflects that both bulls and bears tried to influence the price of the security during the trading period but ultimately couldn’t push the price in one clear direction.

    Characteristics of the Long-Legged Doji

    The Long-Legged Doji pattern is a candlestick pattern used to identify a state of indecision in the market before the next big move occurs. It unfolds in the following phases:

    • A small real body: The real body of the candle is small as both the open and close of the candlestick are nearly identical. 
    • Long upper and lower shadows: The long wick above and below the real body indicates both volatility and indecision. During the trading session, both the buyers and sellers tried to push the asset price in either direction, but neither of them had substantial influence, and the price closed near the opening price.
    • Volatility: The length of the shadows shows high volatility. 
    • Market indecision: The Long-Legged Doji candlestick indicates that both buyers and sellers were active during the session, but nobody had control.
    • Location: The significance of Long-Legged Doji increases when it appears after a strong uptrend or strong downtrend as it signals momentum is weakening.
    • Other Considerations:  Always wait for confirmation in the form of further price increases or declines after making the Long-Legged Doji candle. Once the next candle gives a breakout above the high or a breakdown below the low of the Doji candle, an individual should check the volumes. High trading volume during a breakdown or breakout confirms the change in trend, after which traders can create long or short positions.

    This pattern helps traders recognize when a bullish or bearish trend may have come to an end. After confirmation, traders can create long or short positions. 

    Trading Setup

    The Long-Legged Doji candlestick pattern can be effectively used by following the below trading setup:  

    • Entry Point: The entry point should be when the price gives a breakout and closes above the Doji candle’s high for a long position or gives a breakdown and closes below the Doji candle’s low for a short position. 
    • Stop-Loss: A stop-loss should be placed just above the high of the Long-Legged Doji for a short position or just below the low of the Long-Legged Doji candle for a long position. 
    • Target: The target can be set at the next major support or resistance levels, Fibonacci levels, or traders can use a risk-to-reward ratio such as 1:2, 1:3, etc.

    Read Also: Morning Doji Star Candlestick Pattern

    Advantages of the Long-Legged Doji Candlestick Pattern

    The advantages of using the Long-Legged Doji candlestick pattern are:

    • This pattern can be identified in any market, such as equity, currency, or commodity markets.
    • The pattern works in any time frame, but a higher time frame means a strong trend reversal is expected.
    • It’s one of the popular candlestick patterns.
    • It is very easy to identify.
    • It indicates market indecision, which can signal a potential change in trend.
    • The pattern provides a logical understanding of price action and a complete trading setup.
    • The pattern can be used in combination with other indicators.
    • The pattern offers both buying or shorting opportunities in the market and a favorable risk-to-reward ratio.

    Limitations of the Long-Legged Doji Candlestick Pattern

    The limitations of using the Long-Legged Doji candlestick pattern are:

    • The pattern doesn’t provide clear bullish or bearish signals and shows indecision in the market.
    • The pattern can give false signals in sideways or range-bound markets.
    • The pattern could give a false breakout or breakdown and fail like any other chart pattern, which can result in losses.
    • This pattern could be affected by various market factors like volatility, news, policy change, political instability, etc.
    • The pattern doesn’t always signal a reversal; it could also signal a continuation of the trend.
    • The interpretation of a pattern’s signal is context-driven. For example, the pattern’s signal strength is weak if it occurs in the middle of the trend, without strong support and resistance levels nearby.
    • It requires confirmation.

    Example of Long-Legged Doji Pattern of Shakti Pumps Ltd: 

    Long-Legged Doji candlestick pattern example of Shakti Pumps Ltd.

    The above image shows the weekly chart of Shakti Pumps Ltd. The stock was in an uptrend from May 2023 to January 2024, but then it faced resistance and came down a bit. The stock made a Long-Legged Doji chart pattern in March 2024, which depicted market indecision. Within the next few weeks, the stock price gave a breakout above the high of that Doji candle and closed above it. The stock price took support from INR 1,150 levels, which after the breakout became a strong support level. It confirmed the continuation of the trend, and the stock went up from the high of the Long-Legged Doji, which was around INR 1300, to INR 3000 in just two months and is trading at INR 4,067 as of 27 September 2024. The target zone can be marked near major resistance levels or Fibonacci levels. Stop-loss should be placed just below the Long-Legged Doji candle’s low. Traders can trail stop-loss once stock starts to go up.

    Read Also: Dragonfly Doji Pattern

    Conclusion

    The Long-Legged candlestick pattern is a popular and powerful technical tool for investors and traders alike. The pattern involves a Long-Legged Doji candle, which indicates indecision and depends on the next candle for confirmation. The real body of the Doji candle is so small that the asset price closes near the open of the candle. The Long-Legged Doji can be a valuable tool for detecting potential trend changes, but it must be used carefully and in conjunction with other technical indicators because it may generate false signals in the sideways market or due to sensitive news. Hence, it is very important to understand the pattern’s characteristics, trade setup, risk management, and strategies before trading this pattern. It is advised to consult a financial advisor before trading.

    Frequently Asked Questions (FAQs)

    1. Does a Long-Legged Doji always signal a reversal?

      No, it doesn’t always signal a reversal. Sometimes, it can signal a continuation of the current trend. Hence, confirmation from the next candle is important before making any trading decision.

    2. Where is a Long-Legged Doji pattern most effective?

      The pattern is most effective when it appears at the end of a trend. The candlestick could appear at the top of an uptrend, the bottom of a downtrend, or near key support or resistance levels.

    3. What does a Long-Legged Doji indicate?

      It indicates indecision in the market as both buyers and sellers are unable to control the direction of the asset price. It can indicate that the current trend is losing momentum and that a reversal or consolidation is expected.

    4. What is the difference between a Doji and a Long-Legged Doji?

      A regular Doji has small or nonexistent upper and lower shadows and looks like a plus sign, indicating very little movement during the session. A Long-Legged Doji has longer upper and lower shadows, showing that there was much more volatility during the session before the price settled near the open.

    5. Where should the stop-loss be placed for the Long-Legged Doji candlestick pattern?

      Stop-loss can be placed just above the high of the Long-Legged Doji candle in case of a short position or just below the low of the Long-Legged Doji in case of a long position.

  • Hanging Man Candlestick Pattern

    Hanging Man Candlestick Pattern

    Picture yourself involved in a gripping thriller movie, and out of nowhere, a dark figure appears on the screen. This closely resembles coming across a Hanging Man candlestick pattern on a price chart. It is a sign that something might be off with the current trend in the market, suggesting the market participants to be vigilant and attentive.

    In this blog, we will learn about the Hanging Man candlestick pattern, its target and stop-loss, and its advantages and limitations.

    What is the Hanging Man Candlestick Pattern?

    The hanging man is a single candlestick pattern that frequently suggests a shift from an uptrend to a downtrend. It is defined by a small real body, signifying that the opening and closing prices are nearby, which reflects a state of indecision. Also, the long lower shadow indicates strong selling pressure that pushed the price down during the trading session, and a minimal or absent upper shadow suggests that buying pressure remained quite weak.

    The combination of these factors shows that buyers were unable to maintain control, and sellers may be gaining strength. Traders often look for confirmation through subsequent price action before making any decision.

    The pattern is more meaningful when it appears after a sustained uptrend. However, waiting for confirmation from subsequent candlestick or other technical indicators is often recommended before entering a short position.


    How to Determine Target and Stop-Loss?

    The Hanging Man pattern indicates a possible reversal, so traders must keep their target levels close to the nearest support zone from where the price had previously bounced back. Support levels can be determined by analyzing historical price charts. Furthermore, numerous traders adhere to a risk-reward ratio, such as 1:2 or 1:3. This approach helps traders maximize their possible profits while minimizing losses.

    Positioning your stop-loss just above the peak of the Hanging Man candlestick is one of the most prevalent and secure strategies to protect your investment against losses. If the price rises above the previous high, it indicates that the downtrend suggested by the pattern may not occur, and upward momentum can persist. Additionally, certain traders opt to include a slight buffer above the high, generally ranging from 1-2%, to protect themselves from minor market fluctuations or false breakouts.

    Read Also: Introduction to Bearish Candlesticks Patterns: Implications and Price Movement Prediction

    Example of the Hanging Man Candlestick of Alembic Pharma

    Example of the Hanging Man Candlestick of Alembic Pharma

    The above chart shows the clear formation of the Hanging Man candlestick on the daily timeframe of Alembic Pharma after a continuous uptrend of almost four days. The candlestick has a small body with a long lower shadow and a little upper shadow, which is followed by a downtrend.

    Advantages of Hanging Man Candlestick Pattern

    The advantages of using the Hanging Star candlestick pattern are:

    • Early Warning of Trend Reversal – The Hanging Man pattern appears at the peak of an uptrend and acts as an early signal that bullish momentum could be losing strength. It helps traders predict the upcoming reversals before they occur, enabling them to proactively adjust their positions.
    • Simple to Identify – This pattern is easily recognizable on price charts due to its unique appearance, i.e., featuring a small real body accompanied by a long lower shadow and minimal to no upper shadow. Traders can easily recognize it without complex indicators or analysis.
    • Works well with confirmation – This pattern is more effective when confirmed by signs like a bearish candlestick or a gap down the next day. This enhances traders’ confidence in the validity of the pattern before making a trade, thereby minimizing the likelihood of false signals.

    Limitations of Hanging Man Candlestick Pattern

    The limitations of using the Hanging Star candlestick pattern are:

    • Needs Confirmation – The Hanging Man candlestick pattern, on its own, lacks sufficient strength as a trading signal. Traders seek validation from the subsequent candlestick, usually in the form of a bearish candle or a gap-down. Making decisions solely based on the Hanging Man pattern can lead to misleading signals.
    • Subject to Market Noise – Candlestick patterns like Hanging Man rely on short-term price fluctuations. In turbulent markets, asset prices can experience significant fluctuations, resulting in patterns that may not accurately represent the broader trend.
    • Does not Indicate the Strength of Reversal – The pattern does suggest a possible reversal, yet it cannot indicate the magnitude or intensity of that reversal.

    Read Also:  Tweezer Top Candlestick Pattern

    Conclusion

    The Hanging Man candlestick pattern helps traders identify possible bearish reversals. Its simplicity makes it easy for beginner investors to identify, and its reliability improves when used alongside confirmation and other technical indicators. However, the pattern may give inaccurate signals, especially during strong trends or in volatile markets, and should never be relied upon alone. Understanding the broader market context, patiently awaiting confirmation, and using supplementary technical tools can improve trading performance. Ultimately, consistent practice and patience are important for effectively incorporating it into your trading strategy.


    Frequently Asked Questions (FAQs)

    1. How does a Hanging Man differ from a Hammer candlestick pattern?

      While both patterns look similar, the Hanging Man candlestick forms in an uptrend, while the Hammer candlestick appears in a downtrend.

    2. What does the long lower shadow in a Hanging Man candlestick depict?

      The long lower shadow shows sellers pushed the price lower during the session, but buyers regained control by closing. However, it signals a possible weakness in the uptrend.

    3. Is the Hanging Man pattern reliable in the sideways market?

      No, the pattern is less reliable in the sideways market as it is most effective at the top of an established uptrend.

    4. Should I immediately sell after seeing a Hanging Man candlestick pattern?

      No, it is often recommended to wait for confirmation from subsequent candlesticks or other technical indicators before entering a short position.

    5. What is the importance of volume in the Hanging Man candlestick pattern?

      Increased volume can strengthen the bearish signal, as it shows heightened selling pressure in the market. 

  • Three Black Crows Chart Pattern

    Three Black Crows Chart Pattern

    “When the Crows Meet, the Bulls Flee” can be an apt description of the Three Black Crows chart pattern as it represents consistent selling pressure indicated by three consecutive bearish candles that drive the asset price downwards. 

    In this blog, we will explore the Three Black Crows pattern, signifying the end of a bullish rally and the beginning of the bearish trend. We will discuss the pattern’s characteristics, advantages, and limitations with an example.

    What Is a Three-Black Crows Chart Pattern?

    Three Black Crows is a bearish reversal pattern that forms after a bull run. It signals a potential shift in trend and generally appears at the top of an uptrend. It is a candlestick pattern consisting of three consecutive bearish candles, with the second and third candles closing below the low of the preceding candle, indicating consistent selling pressure. It is one of the key reversal patterns and can be observed in candlestick charts.

    Three Black Crows chart pattern

    Characteristics of the Three Black Crows 

    The Three Black Crows chart pattern is a candlestick pattern used to identify a potential reversal from an uptrend to a downtrend. It unfolds in these phases:

    • An Uptrend preceding the pattern: The pattern is valid only if it appears after an uptrend, signaling a possible reversal. 
    • Three Candle Pattern: It’s a chart pattern that consists of three consecutive bearish candles. 
    • Formation: It generally forms after a long uptrend and indicates a possible trend reversal. 
    • Opening Within the Previous Candle’s Body: Each candle opens within the body of the previous candle.
    • Lower Closes: Each candle closes slightly lower than the previous one and near the day’s low, which shows strong selling pressure and little to no attempts by buyers to push prices higher.
    • No Significant Lower Shadows: The candles generally have small to no lower shadows, indicating that bears are in control throughout the trading period.
    • Psychology: Three bearish candles show that the sellers are in control now, and the trend will change.
    • Other Considerations:  Always wait for confirmation in the form of further price decline after the formation of the Three Black Crows pattern. A high trading volume during the breakdown below the pattern’s third candle confirms the change in trend.

    This pattern helps traders recognize when a bullish trend may have come to an end, offering opportunities to exit long positions or to enter short positions. 

    Trading Setup  

    The Three Black Crows candlestick pattern can be effectively used by following the below trading setup:

    • Entry Point: The entry point should be when the price breaks and closes below the third bearish candle and when additional bearish confirmation appears. Traders can create a short position after confirmation, such as an increase in volume.
    • Stop-Loss: A stop-loss should be placed ideally just above the high of the first candle of the Three Black Crows Pattern. Stop-loss helps in reducing losses if the price gives a false breakdown.
    • Target: The target can be set at the next major support level, Fibonacci support levels, etc.

    Read Also: Three-Line Patterns

    Advantages of the Three Black Crows pattern

    The advantages of the Three Black Crows pattern are:

    • The pattern works well in any market, such as equity, currency, or commodity markets.
    • It works in any time frame, but a bigger time frame means a strong trend reversal is expected.
    • It’s one of the popular candlestick patterns.
    • It is very easy to identify. 
    • The pattern is a reliable reversal signal indicator, as three consecutive bearish candles signify sustained selling pressure.
    • The pattern provides a logical understanding of price action and a complete trading setup.
    • The pattern can be combined with other indicators to get confirmation.
    • The pattern offers an opportunity to create short positions or exit long positions in the market and offers a favorable risk-to-reward ratio.
    • This pattern gives quite accurate results if the breakdown occurs with strong volumes.

    Limitations of the Three Black Crows  pattern

    The limitations of the Three Black Crows pattern are:

    • The pattern can give false signals in the sideways market.
    • The pattern could give a false breakdown and fail like any other chart pattern, which can result in losses.
    • This pattern could be affected by various market factors like volatility, news, policy change, political instability, or other factors.
    • The pattern’s reversal signal requires confirmation from other indicators for better accuracy.
    • The pattern can be used to predict a temporary decline and not a long-term trend.

    Example: Three Black Crows chart pattern of Raymond

    Three Black Crows chart pattern of Raymond

    The above image shows Raymond’s monthly price chart. The stock was in an uptrend from 2009 to 2018, after which it made the Three Black Crows chart pattern twice, and both times, the stock price declined. The stock price again made a Three Black Crows pattern in 2019, and a very strong confirmation signal can be seen as the stock price gave a breakdown below a strong trendline of 10 years. Additionally, we can see a death cross on three moving averages, which further confirms the pattern. The stock made a high of INR 509 in November 2019 and declined and made a low of INR 128 in March 2020. The stock was near a crucial support level of INR 115-120 and a Fibonacci level of 61.8%, which was around INR 122; an individual could have used these levels as potential target levels. The target zone is marked at the Fibonacci Levels or nearest major support points. The stop-loss should be placed just above the high of the first candle of the Three Black Crows pattern, and as the stock price declines, stop-loss should be trailing.

    Read Also: Black Candle Pattern

    Conclusion

    The Three Black Crows candlestick pattern is a popular, simple, and powerful technical tool for investors and traders alike. It consists of three bearish candles, with each candle opening within the body of the previous candle closing near the low with no significant lower shadows, showing strong selling pressure. It signals a potential trend reversal in the security price from bullish to bearish. Look for the confirmation, such as volume spike, to get a reliable and strong breakdown signal. It is popular because of its simplicity but has limitations, such as false signals in sideways markets, short-term time frames, etc. Hence, it is very important to understand the pattern’s characteristics, trade setup, risk management, and strategies before using this pattern. It is advised to consult a financial advisor before trading.

    Frequently Asked Questions (FAQs)

    1. Can external factors affect the reliability of the Three Black Crows pattern?

      Yes, external factors like news, economic data releases, results, or any other major social, economic, or political events can impact the effectiveness of the pattern. 

    2. Can the Three Black Crows pattern be used with other Indicators?

      Yes, it is recommended to use the Three Black Crows pattern in conjunction with other technical indicators like the Relative Strength Index (RSI), MACD, or Fibonacci retracement for enhanced accuracy.

    3. Does the Three Black Crows pattern occur in all time frames?

      Yes, the Three Black Crows pattern can occur in any time frame, like daily, weekly, monthly, or even intraday charts. However, patterns that appear on longer time frames (like daily or weekly charts) tend to be more reliable than the shorter time frame signals.

    4. How do I trade the Three Black Crows pattern?

      One should wait for additional confirmation, such as a break of a key support level or the appearance of further bearish technical signals, before creating a short position. Support levels or risk-to-reward ratios can be used to determine target levels. The stop-loss is usually placed above the high of the first candle in the pattern.

  •  Tweezer Top Candlestick Pattern

     Tweezer Top Candlestick Pattern

    “Double the highs and half of the hopes” can be an apt way to describe the Tweezer Top candlestick pattern, as it indicates that the asset price is taking resistance and signaling a bearish reversal. Tweezer Top candlestick pattern is a bearish reversal pattern where two identical highs signal a fading uptrend, which suggests that the price of a security will reverse from bullish to bearish once the pattern is confirmed.  

    In this blog, we will discuss the Tweezer Top candlestick pattern, its characteristics, trading setup, advantages, and limitations with an example.

    What is a Tweezer Top Chart Pattern?

    Tweezer Top is a bearish reversal pattern that forms after a bull run in the asset price. It indicates a change of trend from bullish to bearish because it appears after an uptrend. The candlestick pattern consists of two or more candles with similar highs. The identical highs suggest that buyers have lost control and are unable to push the price higher.  It is one of the key reversal patterns and can be observed in candlestick charts.

    Tweezer Top Chart Pattern

    Characteristics of the Tweezer Top 

    The Tweezer Top pattern is a candlestick pattern used to identify a potential reversal from an uptrend to a downtrend. It unfolds in the following phases:

    • At Least Two Candles: The Tweezer Top candlestick pattern consists of at least two candles with similar tops or a few candles with almost identical tops. The first candle is typically bullish, and the second candle is bearish.
    • Formation: It generally forms after a long uptrend and indicates a possible trend reversal. 
    • Bearish reversal indication: The strength of the second candle decides the possibility of a trend reversal. The bearish candle can be in the form of Doji, Shooting Star, Hammer, etc.
    • Psychology: The large bearish candle shows that the sellers are in control now, and the trend will reverse from bullish to bearish.
    • Other Considerations:  Always wait for confirmation in the form of further price decline after the formation of a bearish Tweezer Top candle. Once the next candle moves below the low of the bearish candle, check the volume for further confirmation. High trading volume confirms the change in trend, and an individual can create short positions or exit long positions.

    This pattern helps traders recognize when a bullish trend may have come to an end, offering opportunities to exit long positions or to enter short positions. 

    Trading Setup  

    The Tweezer Top candlestick pattern can be effectively used by following the below trading setup:

    • Entry Point: The entry point should be when the price breaks below the low point of the second candle. Traders can open a short position after taking confirmation, such as an increase in volume.
    • Stop Loss: A stop loss should be placed ideally just above the high of the Tweezer Top pattern. The stop-loss will protect against losses if the price reverses or gives a false breakdown.
    • Target: The target can be set at the next major support level, Fibonacci support levels, or can use risk and reward ratios such as 1:2 and 1:3, etc.

    Advantages of Tweezer Top candlestick pattern

    The advantages of the Tweezer Top candlestick pattern are:

    • The pattern works well in any market, such as equity, currency, or commodity markets.
    • It works in any time frame, but a bigger time frame means a strong trend reversal is expected.
    • It’s one of the most popular candlestick patterns.
    • It is easy to identify. 
    • The pattern is a reliable reversal signal indicator.
    • The pattern provides a logical understanding of price action and a complete trading setup.
    • The pattern can be combined with other indicators to get confirmation.
    • The pattern offers an opportunity to create short positions or exit long positions in the market.
    • This pattern gives quite accurate results if the breakdown occurs with strong volumes.

    Limitations of Tweezer Top candlestick pattern

    The limitations of the Tweezer Top candlestick pattern are:

    • The pattern can give false signals in the sideways market.
    • The pattern could give a false breakdown and fail like any other chart pattern, which can result in losses.
    • This pattern could be affected by various market factors such as volatility, news, policy change, political instability, or other factors.
    • The pattern’s reversal signal requires confirmation from other indicators for better accuracy.

    Read Also: Introduction to Bullish Candlestick Patterns: Implications and Price Movement Prediction

    Example: Tweezer Top Pattern of Hindalco Industries.

    Tweezer Top Pattern of Hindalco Industries

    The above image shows the price chart of Hindalco Industries on a weekly time frame. The stock was in an uptrend between 2020 and 2022 and made a Tweezer Top pattern in March 2022, and the stock made two consecutive highs of INR 630 and INR 636. The second bearish candle completely engulfed the previous week’s high and low and also made a similar top, and then the stock price declined from a high of INR 636 to INR 309 in June 2022. It was a sharp downtrend as the stock declined approximately 50% from the top. The chart shows a sharp reversal from a continued two-year uptrend to a sharp downtrend and achieved the target. The stock made the same pattern in January 2023, December 2023, and recently, in June 2024, and the stock price has declined 15-25% after the pattern formation each time. The target zone can be marked using the Fibonacci Levels or the nearest major support levels. A stop-loss can be placed just above the engulfing candle’s top, and as the stock price declines, a trader can use a trailing stop-loss.

    Read Also:  Tweezer Bottom Pattern

    Conclusion

    The Tweezer Top candlestick pattern is a simple and powerful candlestick pattern for investors and traders alike. It generally involves two candlesticks, but in some cases, more than two candles can appear in the pattern with similar highs. The pattern signals a potential bearish reversal in the security price from bullish to bearish. Look for confirmation from other technical indicators and volume spikes to get a strong breakdown signal. It is popular because it is easy to identify, but it also has limitations, such as false signals in the sideways market, short-term time frames, etc. Hence, it is very important to understand the pattern’s characteristics, trade setup, risk management, and strategies before using this pattern. It is advised to consult a financial advisor before trading.

    Frequently Asked Questions (FAQs)

    1. Can other factors affect the reliability of the Tweezer Top pattern?

      Yes, other external factors such as news, economic data releases, results, or any other major social, economic, or political events can disrupt the pattern and invalidate the expected reversal. One should always consider the broader market conditions when trading chart patterns.

    2. Can the Tweezer Top be used with other Indicators?

      Yes, it is recommended to use the Tweezer Top pattern in conjunction with other technical indicators like the Relative Strength Index (RSI), MACD, or Fibonacci retracement for enhanced accuracy.

    3. Does the length of the candlesticks matter in a Tweezer Top pattern?

      Yes, the length of the candlesticks does matter. A bullish candle followed by a long bearish candle often indicates a stronger reversal. However, the key requirement is that both candles should have almost the same high.

    4. Does the Tweezer Top pattern occur in all time frames?

      Yes, the Tweezer Top pattern can occur and is effective in any time frame, such as daily, weekly, monthly, or even intraday charts. However, patterns that appear on longer time frames (like daily or weekly charts) tend to be more reliable.

    5. Can the Tweezer Top pattern form with more than two candles?

      The classic Tweezer Top pattern consists of two candles, but it can sometimes consist of three or more candles. The main requirement is that all the candles must have nearly the same highs, indicating a strong resistance.

  • Dark Cloud Cover Candlestick Pattern

    Dark Cloud Cover Candlestick Pattern

    Are you eager to enhance your technical analysis skills in anticipating a bearish reversal? This candlestick pattern can assist you in recognising possible trend reversals. This blog will examine the Dark Cloud Cover pattern, its components, trading implications, advantages, and limitations, along with a real-world example. Understanding this pattern can help seasoned traders and beginners identify bearish reversals in the financial markets.

    What is a Dark Cloud Cover Candlestick Pattern?

    The Dark Cloud Cover candlestick pattern signifies a bearish reversal, suggesting a possible shift from an uptrend to a downtrend. The pattern consists of two candlesticks mentioned below:

    • Bullish Candle: A strong bullish candle that opens and closes well above the previous day’s closing price.
    • Bearish Candle: A bearish candle emerges when it opens above the previous day’s high and closes beneath the midpoint of the preceding bullish candle.
    Dark Cloud Cover Candlestick Pattern

    Although the pattern indicates a possible reversal, a trader can create a short position when a bearish candle closes beneath the midpoint of a preceding bullish candle. Conservative traders may prefer to seek additional confirmation before making any trading decisions.

    Interpretation of Dark Cloud Cover Pattern

    In an uptrend, a large green candle is followed by a red candle that opens higher but closes lower than the midpoint of the preceding bullish candle, marking a possible shift from buying strength to selling pressure. This could suggest that the market is struggling to move upwards, and a downtrend might start.

    Key indicators of a possible reversal are a gap-up and a bearish candle opening above the high of a bullish candle, indicating an unexpected spike in selling pressure. The candle closing beneath the midpoint of a bullish candle indicates a change in momentum.

    How to determine Target and Stop-Loss?

    Traders strive for a risk-reward ratio of at least 1:2, indicating that the profit should be at least double the amount they risk. Support levels can also act as targets after the formation of the Dark Cloud Cover.

    In the case of stop-loss, a common method is to set the stop-loss above the high of the bullish candle in the Dark Cloud Cover pattern. Additionally, the decision regarding the stop-loss depends on your risk tolerance. Risk-averse traders prefer a tighter stop-loss, while aggressive traders may choose a wider stop-loss.

    Read Also: Black Candle Pattern

    Example of Dark Cloud Cover Pattern

    Dark Cloud Cover pattern of Avenue Supermarts ltd.

    The image above shows the ‘Dark Cloud Cover’ candlestick pattern on the daily timeframe of DMart (Avenue Supermarts Limited). A clear Dark Cloud Cover pattern can be seen when a bearish candle is formed after a bullish candle. The bearish candlestick closed below the midpoint of the previous bullish candlestick, and the asset price declined afterward, signifying a downtrend.

    Advantages of Dark Cloud Cover Pattern

    The advantages of Dark Cloud Cover are:

    • Early Warning Signal – It helps traders detect possible trend reversals, enabling them to adjust their positions before a major price drop.
    • Reliability – Research shows that the dark cloud cover pattern is a reliable candlestick pattern for predicting bearish trend reversals, particularly when it is supported by additional technical indicators such as RSI, MACD, etc.
    • Improves Risk Management – Traders can enhance their risk management strategies by recognising a bearish reversal early. This helps them exit long positions before the market price declines.
    • Applicable across Markets – This pattern is effective across multiple markets, such as stocks, forex, and commodities.

    Limitations of Dark Cloud Cover Pattern

    The limitations of Dark Cloud Cover are:

    • Need Confirmation – Confirmation is essential as the pattern does not guarantee a reversal. It is important to seek further confirmation, such as the emergence of a third bearish candle or signals from additional technical indicators.
    • Subjective Interpretation – Assessing whether the second candle closes beneath the midpoint of the first candle can be a matter of personal interpretation. Minor variations in how traders determine the midpoint can result in contrasting views on the validity of the pattern.
    • Timeframe Sensitivity – The efficacy of the pattern can change depending on the time frame selected. It tends to be more reliable on longer timeframes, such as daily and weekly charts, while it offers less reliability on shorter time frames, like hourly and minute charts.
    • False Signals – Despite being a powerful indicator, it can occasionally generate misleading signals, especially in volatile or sideways markets.

    Read Also: Introduction to Bearish Candlesticks Patterns: Implications and Price Movement Prediction

    Conclusion

    To sum up, the Dark Cloud Cover candlestick pattern is an essential tool for traders aiming to spot bearish reversals. Its easy-to-understand structure provides an early alert for possible changes in market sentiment, making it invaluable for risk management and short-term trading tactics. However, the need for validation, vulnerability to misleading signals in volatile markets, and other factors show that it should not be trusted independently and must be combined with other indicators. It is advised to consult a financial advisor before trading.

    Frequently Asked Questions (FAQs)

    1. When should traders use the Dark Cloud Cover pattern?

      Dark Cloud Cover pattern must be used in combination with other technical tools during an uptrend, where a reversal is more likely.

    2. Does volume play a role when trading using the Dark Cloud Cover pattern?

      A higher trading volume during the second bearish candle increases the possibility of a downtrend, showing strong selling pressure.

    3. What is the difference between a Dark Cloud Cover and a Bearish Engulfing candlestick pattern?

      In the Bearish Engulfing candlestick pattern, the second candle completely engulfs the first, while in Dark Cloud Cover, the second candle closes below the midpoint but does not engulf the preceding bullish candle.

    4. Should I rely solely on the Dark Cloud Cover pattern for trading decisions?

      No, it is best to use the Dark Cloud Cover pattern in combination with other technical tools and analysis of broader market conditions.

    5. What does the gap up in the Dark Cloud Cover pattern denote?

      The gap up in the Dark Cloud Cover candlestick pattern signifies a sudden surge in the buying pressure, which quickly reverses and the asset price declines.

  • Bullish Engulfing Pattern

    Bullish Engulfing Pattern

    Ever wondered how professional traders predict trend reversals with high accuracy? Most of them know numerous patterns. One such candlestick pattern is the Bullish Engulfing pattern. The Bullish Engulfing pattern is all about when the trend reverses from bearish to bullish, and buyers take control.

    In this blog, we will discuss the Bullish Engulfing candlestick pattern, its characteristics, trading setup, advantages, and disadvantages with an example.

    What is the Bullish Engulfing Pattern?

    A Bullish Engulfing pattern is a bullish reversal pattern where buyers take charge and indicate a change of trend from bearish to bullish because it appears after a downtrend. The pattern consists of two candles, and the bearish candle is smaller than the following bullish candle. It is a key reversal pattern and can be observed in candlestick charts. Traders use this pattern to create long positions or exit short positions.

    Bullish Engulfing Pattern

    Characteristics of the Bullish Engulfing Pattern 

    The Bullish Engulfing pattern is a candlestick pattern used to identify a potential reversal from a downtrend to an uptrend. It unfolds as per the following phases:

    • Two Candle Pattern: This is a two-candle chart pattern in which the first candle is bearish, and the second candle is a big bullish candle. The bearish candle is smaller than the bullish candle.
    • Engulfing: The second bullish candle completely engulfs the body of the first bearish candle.
    • Formation: It generally forms after a long downtrend and indicates a possible trend reversal. 
    • Psychology: The large bullish candle shows that the buyers are in control now, and the trend will change.
    • Other Considerations: Always wait for a further price increase after the bullish engulfing candle for better accuracy. Once the next candle gives a breakout above the high of the engulfing candle with increased volume, it can be seen as a confirmation signal for trend reversal, and traders can create long positions.

    This pattern helps traders recognize when a bearish trend may be coming to an end, offering opportunities to exit short positions or to enter long positions. 

    Trading Setup

    The Bullish Engulfing pattern can be effectively used by following the below trading setup:

    • Entry Point: The entry point should be when the price gives a breakout above the high of the bullish engulfing candle. Look for the increase in volume to get a confirmation and then create a long position.
    • Stop Loss: A stop-loss should be placed just below the low of the engulfing candle to manage risks and reduce losses if the pattern gives a false breakout.
    • Target: The trader can determine target levels by using resistance levels, Fibonacci levels, or customized risk and reward ratios.

    Advantages of Bullish Engulfing Pattern

    The advantages of the Bullish Engulfing pattern are:

    • It works in any market, such as equity, currency, or commodity markets.
    • The pattern can be used on any time frame, but a bigger time frame suggests a strong trend reversal is expected.
    • It is easy to identify. 
    • The pattern is a reliable reversal signal indicator.
    • Traders can capture large moves using this pattern.
    • The pattern provides a logical understanding of price action and a complete trading setup.
    • The pattern can be combined with other indicators to get confirmation.
    • This pattern gives quite accurate results if a breakout above the high of the bullish engulfing candle occurs with strong volumes.

    Read Also: Bearish Engulfing Pattern

    Limitations of Bullish Engulfing Pattern

    The limitations of the Bullish Engulfing pattern are:

    • The pattern can give false signals in a sideways market.
    • The pattern interpretation can sometimes be subjective as there can be minor changes in candle size.
    • The pattern is not effective in a very strong bearish trend.
    • The pattern could give a false breakout and fail like any other pattern, resulting in losses.
    • This pattern could be affected by various market factors, such as volatility, news, policy change, political instability, etc.
    • The pattern’s reversal signal requires confirmation from other indicators for better accuracy.

    Example: Bullish Engulfing Pattern for DLF

    Example Bullish Engulfing Pattern for DLF

    The above image shows the price chart of DLF on a weekly time frame. In the second week of March 2022, the stock price made a Bullish Engulfing pattern as the bullish candle completely engulfed the previous week’s high and low. The stock price increased from INR 353 to INR 401 in the following weeks. The target zone can be marked at the Fibonacci Levels or the nearest major resistance level. A stop-loss can be placed just below the low of the bullish engulfing candlestick and trail stop-loss as the stock price increases.

    Read Also: Introduction to Bullish Candlestick Patterns: Implications and Price Movement Prediction

    Conclusion

    The Bullish Engulfing candlestick pattern is popular among both investors and traders due to its accuracy. It signals a potential trend reversal in the security’s price from bearish to bullish. Confirmations such as volume spikes can be used to identify strong breakout signals. The pattern also has some limitations, such as false signals in sideways markets and ineffectiveness in short-term time frames. Hence, it is important to understand the pattern’s characteristics, trade setup, and risk management strategies before trading. It is advised to consult a financial advisor before investing.

    Frequently Asked Questions (FAQs)

    1. Can a Bullish Engulfing pattern occur in an uptrend?

      A Bullish Engulfing pattern generally appears at the bottom of a downtrend but can also appear as a continuation pattern during an uptrend. However, the pattern has a greater significance when it occurs after a bearish trend.

    2. Can the Bullish Engulfing pattern be used with other indicators?

      Yes, it can be used with other indicators, and it is recommended to use the Bullish Engulfing pattern in conjunction with other technical indicators like the Relative Strength Index (RSI), MACD, or Fibonacci retracement for enhanced accuracy.

    3. What are the key limitations of the Bullish Engulfing pattern?

      The primary limitations of the Bullish Engulfing pattern are the risk of a false breakout in the sideways market and ineffectiveness in a short time frame. It is a lagging indicator and often requires confirmation for reliability. 

    4. Is the Bullish Engulfing pattern effective in all market conditions?

      The Bullish Engulfing pattern is most effective in trending markets and can generate false signals in sideways or range-bound markets. It’s also ineffective during strong bearish trends, where the market’s momentum is so strong that it might overpower the reversal signal of the chart pattern.

    5. How many candles occur in the Bullish Engulfing pattern?

      Two candles occur in the formation of the Bullish Engulfing pattern. The first candle is bearish, and the second candle is a big bullish candle.

  • Black Marubozu Candlestick Pattern

    Black Marubozu Candlestick Pattern

    Have you ever wondered how to spot a fall in the market or a particular stock before it happens? The Black Marubozu candlestick pattern might just hold the key. With its long body and no shadows, this candlestick pattern has been feared and respected by traders for a long time.

    In this blog, we will explore the Black Marubozu candlestick pattern and how traders can incorporate this pattern into their trading strategies.

    What is the Black Marubozu Pattern?

    The Black Marubozu pattern is a candlestick pattern that indicates a strong bearish sentiment in the market. It is characterized by a long red candle with little to no shadows, suggesting that sellers dominated the trading session from open to close. The absence of shadows or wicks means the asset’s price has dropped consistently, with no attempts by the buyers to reverse the trend during the session. The price opens at the high and closes at the low in a trading session, reflecting persistent downward pressure throughout the trading session. Traders often interpret this pattern as a signal to create short positions, anticipating further downward movement.

    A Black Marubozu candlestick in a downtrend usually indicates that the bearish trend may continue. If it appears in an uptrend, it could be a sign of a bearish reversal. Furthermore, the overall market sentiment and broader economic conditions should be considered.

    What is Black Marubozu Pattern

    How to Determine Target and Stop-Loss?

    Target and stop-loss are the two key elements in any trading strategy. Determination of target and stop-loss determines the profitability of the strategy. Targets can be determined for a Black Marubozu pattern using various methods:

    • Risk-to-Reward Ratio: Traders can define their Risk-to-reward ratio and set a target accordingly. For instance, if you aim for a 1:2 risk-to-reward ratio, your target should be positioned at twice the distance from your entry point as your stop loss.
    • Major Support Levels: Traders can set a target near the next significant support level.

    No pattern has 100% accuracy, and the Black Marubozu pattern is no different. Asset price can make a Black Marubozu candle and continue to trend upwards. Therefore, it is important to use stop-loss to protect against false breakdowns. The stop-loss for this pattern can be set in several ways:

    • High of Black Marubozu candle: A stop-loss can be placed slightly above the high of the Black Marubozu candlestick to protect against false breakdowns.
    • Customized Stop-Loss: You can also ascertain your maximum acceptable loss and adjust your trade quantity. A trader can reduce the trade quantity to implement a wider stop-loss.

    Additionally, as the price moves in your favor, you can adjust your stop loss to lock in profits while minimizing possible losses. This strategy allows a trader to ride the trend longer while protecting your capital from sudden reversals.

    Read Also: Marubozu Candlestick Pattern: Means, History & Benefits

    Example of Black Marubozu Pattern

    The charts below show the formation of the Black Marubozu candlestick pattern on the price chart of NIFTY 50 on a daily time frame. The Black Marubozu candlestick pattern can work both as a reversal and a continuation pattern, as depicted below:

    • Black Marubozu in an Uptrend: The image below indicates that the Black Marubozu candlestick works as a bearish reversal candlestick pattern in an uptrend.
    Black Marubozu in an Uptrend
    • Black Marubozu in a downtrend: The image below indicates that the Black Marubozu candlestick works as a bearish continuation candlestick pattern in a downtrend.
    Black Marubozu in a downtrend

    Read Also: Closing Black Marubozu Candle

    Advantages of Black Marubozu Pattern

    The advantages of the Black Marubozu pattern are:

    • Strong Bearish Indication – The pattern can be used to predict a substantial decline in prices, making it an effective tool for recognizing possible selling opportunities.
    • Compatible with other Technical tools – The Black Marubozu candle can be used with additional indicators to predict the onset of a significant downtrend.
    • Identify Entry and Exit Points – Traders can use a Black Marubozu candle to find good entry and exit points. For example, in a downtrend, traders may create a short position after the price moves below the low of the Black Marubozu candle and place a stop-loss just above the high of the Black Marubozu candle.

    Limitations of Black Marubozu Pattern

    The limitations of the Black Marubozu pattern are:

    • Ineffectiveness to predict Short-term Trends – Although the pattern is effective for analyzing long-term bearish momentum, it does not provide a reliable signal regarding the short-term trend, as the market noise, volatility, political events, etc., can result in false breakdowns.
    • Vulnerable to Misinterpretation – Traders might misinterpret the Black Marubozu pattern as a strong sign of downward movement or reversal in an uptrend. However, relying solely on a single pattern can lead to poor decision-making without additional signals like volume.
    • False Signals – Despite being a powerful indicator, it can occasionally generate misleading signals, especially in volatile or sideways markets.

    Read Also: Closing Black Marubozu Candle

    Conclusion

    The Black Marubozu pattern is a reliable candlestick pattern that can predict strong bearish trends in the financial markets. It’s clear and can be easily identified, which makes it invaluable for novice and seasoned traders. However, traders must look for confirmation from other technical indicators, such as volume, RSI, or additional candlestick patterns, to increase the reliability of the pattern’s signals. It is advised to consult a financial advisor before investing.

    Frequently Asked Questions (FAQs)

    1. Are there any variations of the Black Marubozu pattern?

      While the classic Black Marubozu candle has no shadows, there can be variations with small shadows, but the overall bearish sentiment remains strong.

    2. What time frame is the Black Marubozu candlestick pattern most effective?

      The Black Marubozu candlestick pattern is more effective in a longer time frame than a shorter one, as factors such as market noise, volatility, political events, etc., can result in false breakdowns.

    3. Is the Black Marubozu pattern effective in all market conditions?

      The Black Marubozu pattern works best in trending markets, especially during downtrends. It may be less effective in sideways or volatile markets.

    4. What should be the stop-loss for trading a Black Marubozu candlestick pattern?

      The stop-loss can be placed just above the Black Marubozu candle to protect against false breakdowns.

    5. Can I depend on a Black Marubozu pattern alone for trading decisions?

      No, it is suggested that the Black Marubozu candlestick pattern be used alongside other indicators and market analysis to avoid false signals. 

  • Open Free Demat Account

    Join Pocketful Now

    You have successfully subscribed to the newsletter

    There was an error while trying to send your request. Please try again.

    Pocketful blog will use the information you provide on this form to be in touch with you and to provide updates and marketing.