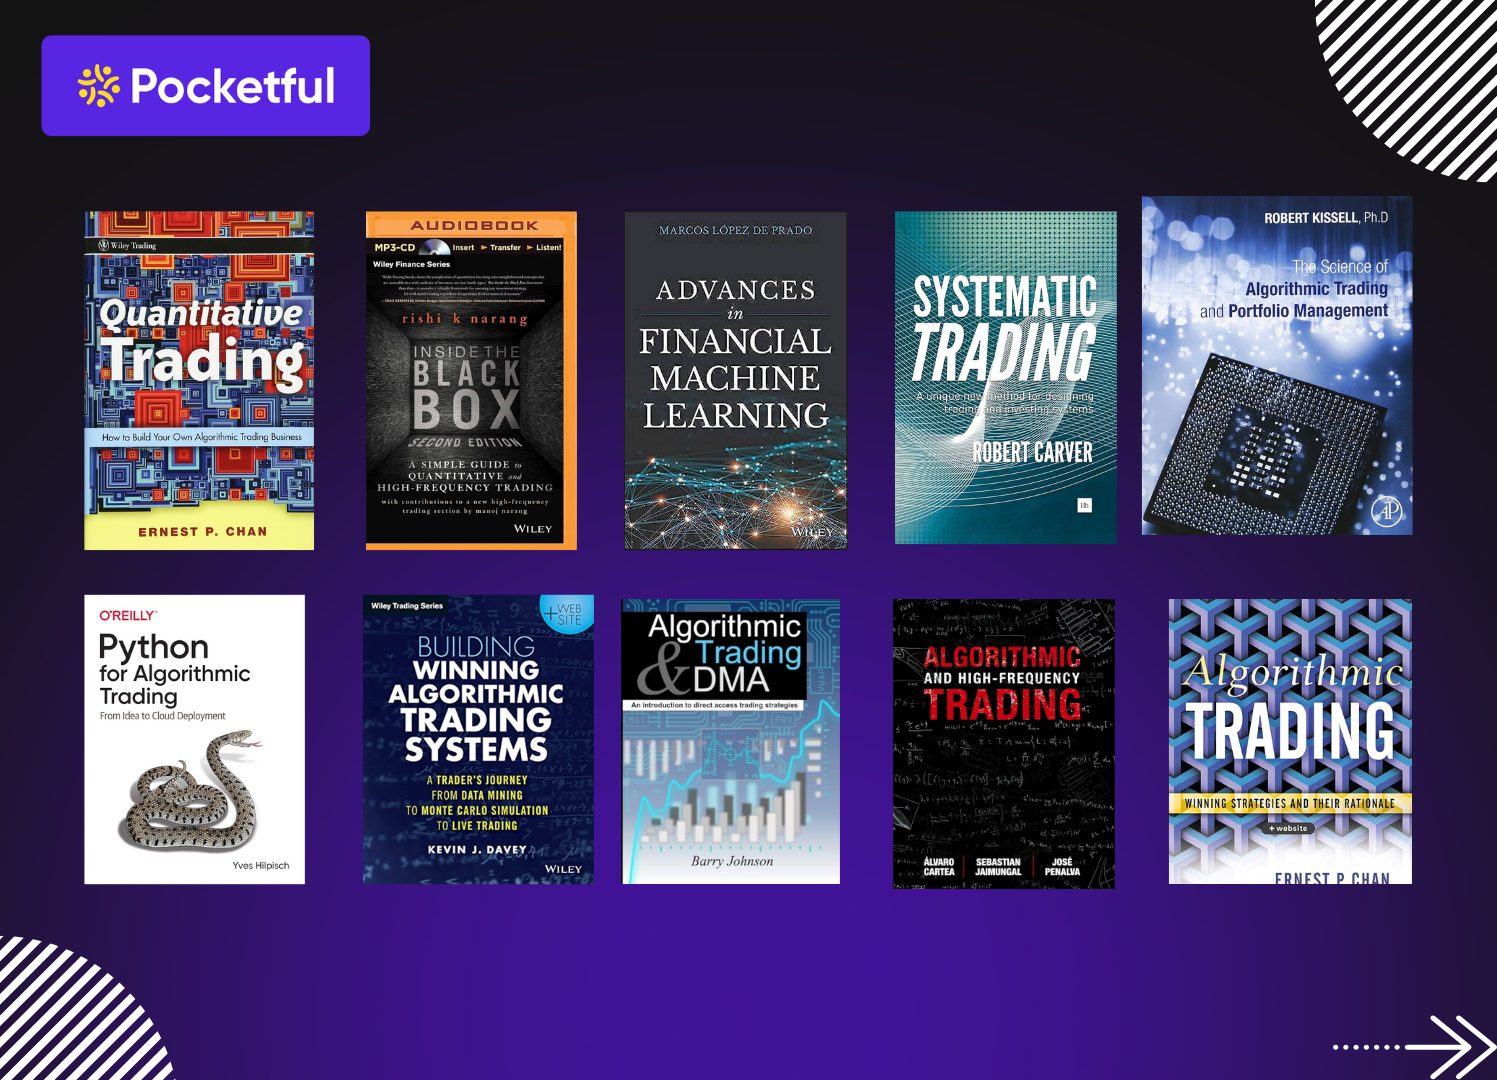
![Top 10 Option Trading Books in India [2026]](https://cms-resources.pocketful.in/blog/wp-content/uploads/2025/07/Top-10-Option-Trading-Books-in-India.jpg)
Options trading can be highly rewarding, but it requires a solid understanding of the concepts to trade options profitably. Videos or tips alone help to some extent, but option trading books are the best when it comes to in-depth learning. These books explain everything from option trading basics, strategy and risk management.
If you are looking for the best books on options trading in India, then this article is for you. Here, you’ll find a curated list of the top and most up-to-date books for 2026 to help you master the art of options trading.
Top 10 Best Option Trading Books
| Name | Author | Main Focus | Best For |
|---|---|---|---|
| Options as a Strategic Investment | Lawrence G. McMillan | 60+ options strategies, hedging techniques, in-depth analysis | Intermediate to advanced traders |
| Option Volatility and Pricing | Sheldon Natenberg | Volatility, Greeks, pricing models, premium behavior | Advanced-level traders |
| The Bible of Options Strategies | Guy Cohen | Strategy guide in easy language with charts and visuals | Beginners and intermediate-level traders |
| Trading Options Greeks | Dan Passarelli | Deep understanding of Delta, Gamma, Theta, Vega (Greeks) | Traders learning adjustments and risk |
| Options Trading: The Hidden Reality | Charles Cottle | Risk management and complex position setups | Serious and professional option traders |
| The Options Playbook | Brian Overby | Categorized strategies with real examples and simplified terms | New traders and part-time investors |
| Options Made Easy | Guy Cohen | Basics, risk control, and simple option strategies | Complete beginners in options trading |
| Mastering the Trade | John F. Carter | Real-world setups combining options and futures | Technical and multi-instrument traders |
| Trading in the Zone | Mark Douglas | Trading psychology, discipline, and mindset | For traders focusing on developing trading psychology |
| NISM X Taxmann’s Equity Derivatives | NISM | SEBI regulations, framework of options market in India | Indian traders and NISM exam aspirants |
Read Also: Best Options Trading Chart Patterns
Brief Overview of the 10 Best Options Trading Books
A summary of the 10 best options trading books has been given below:
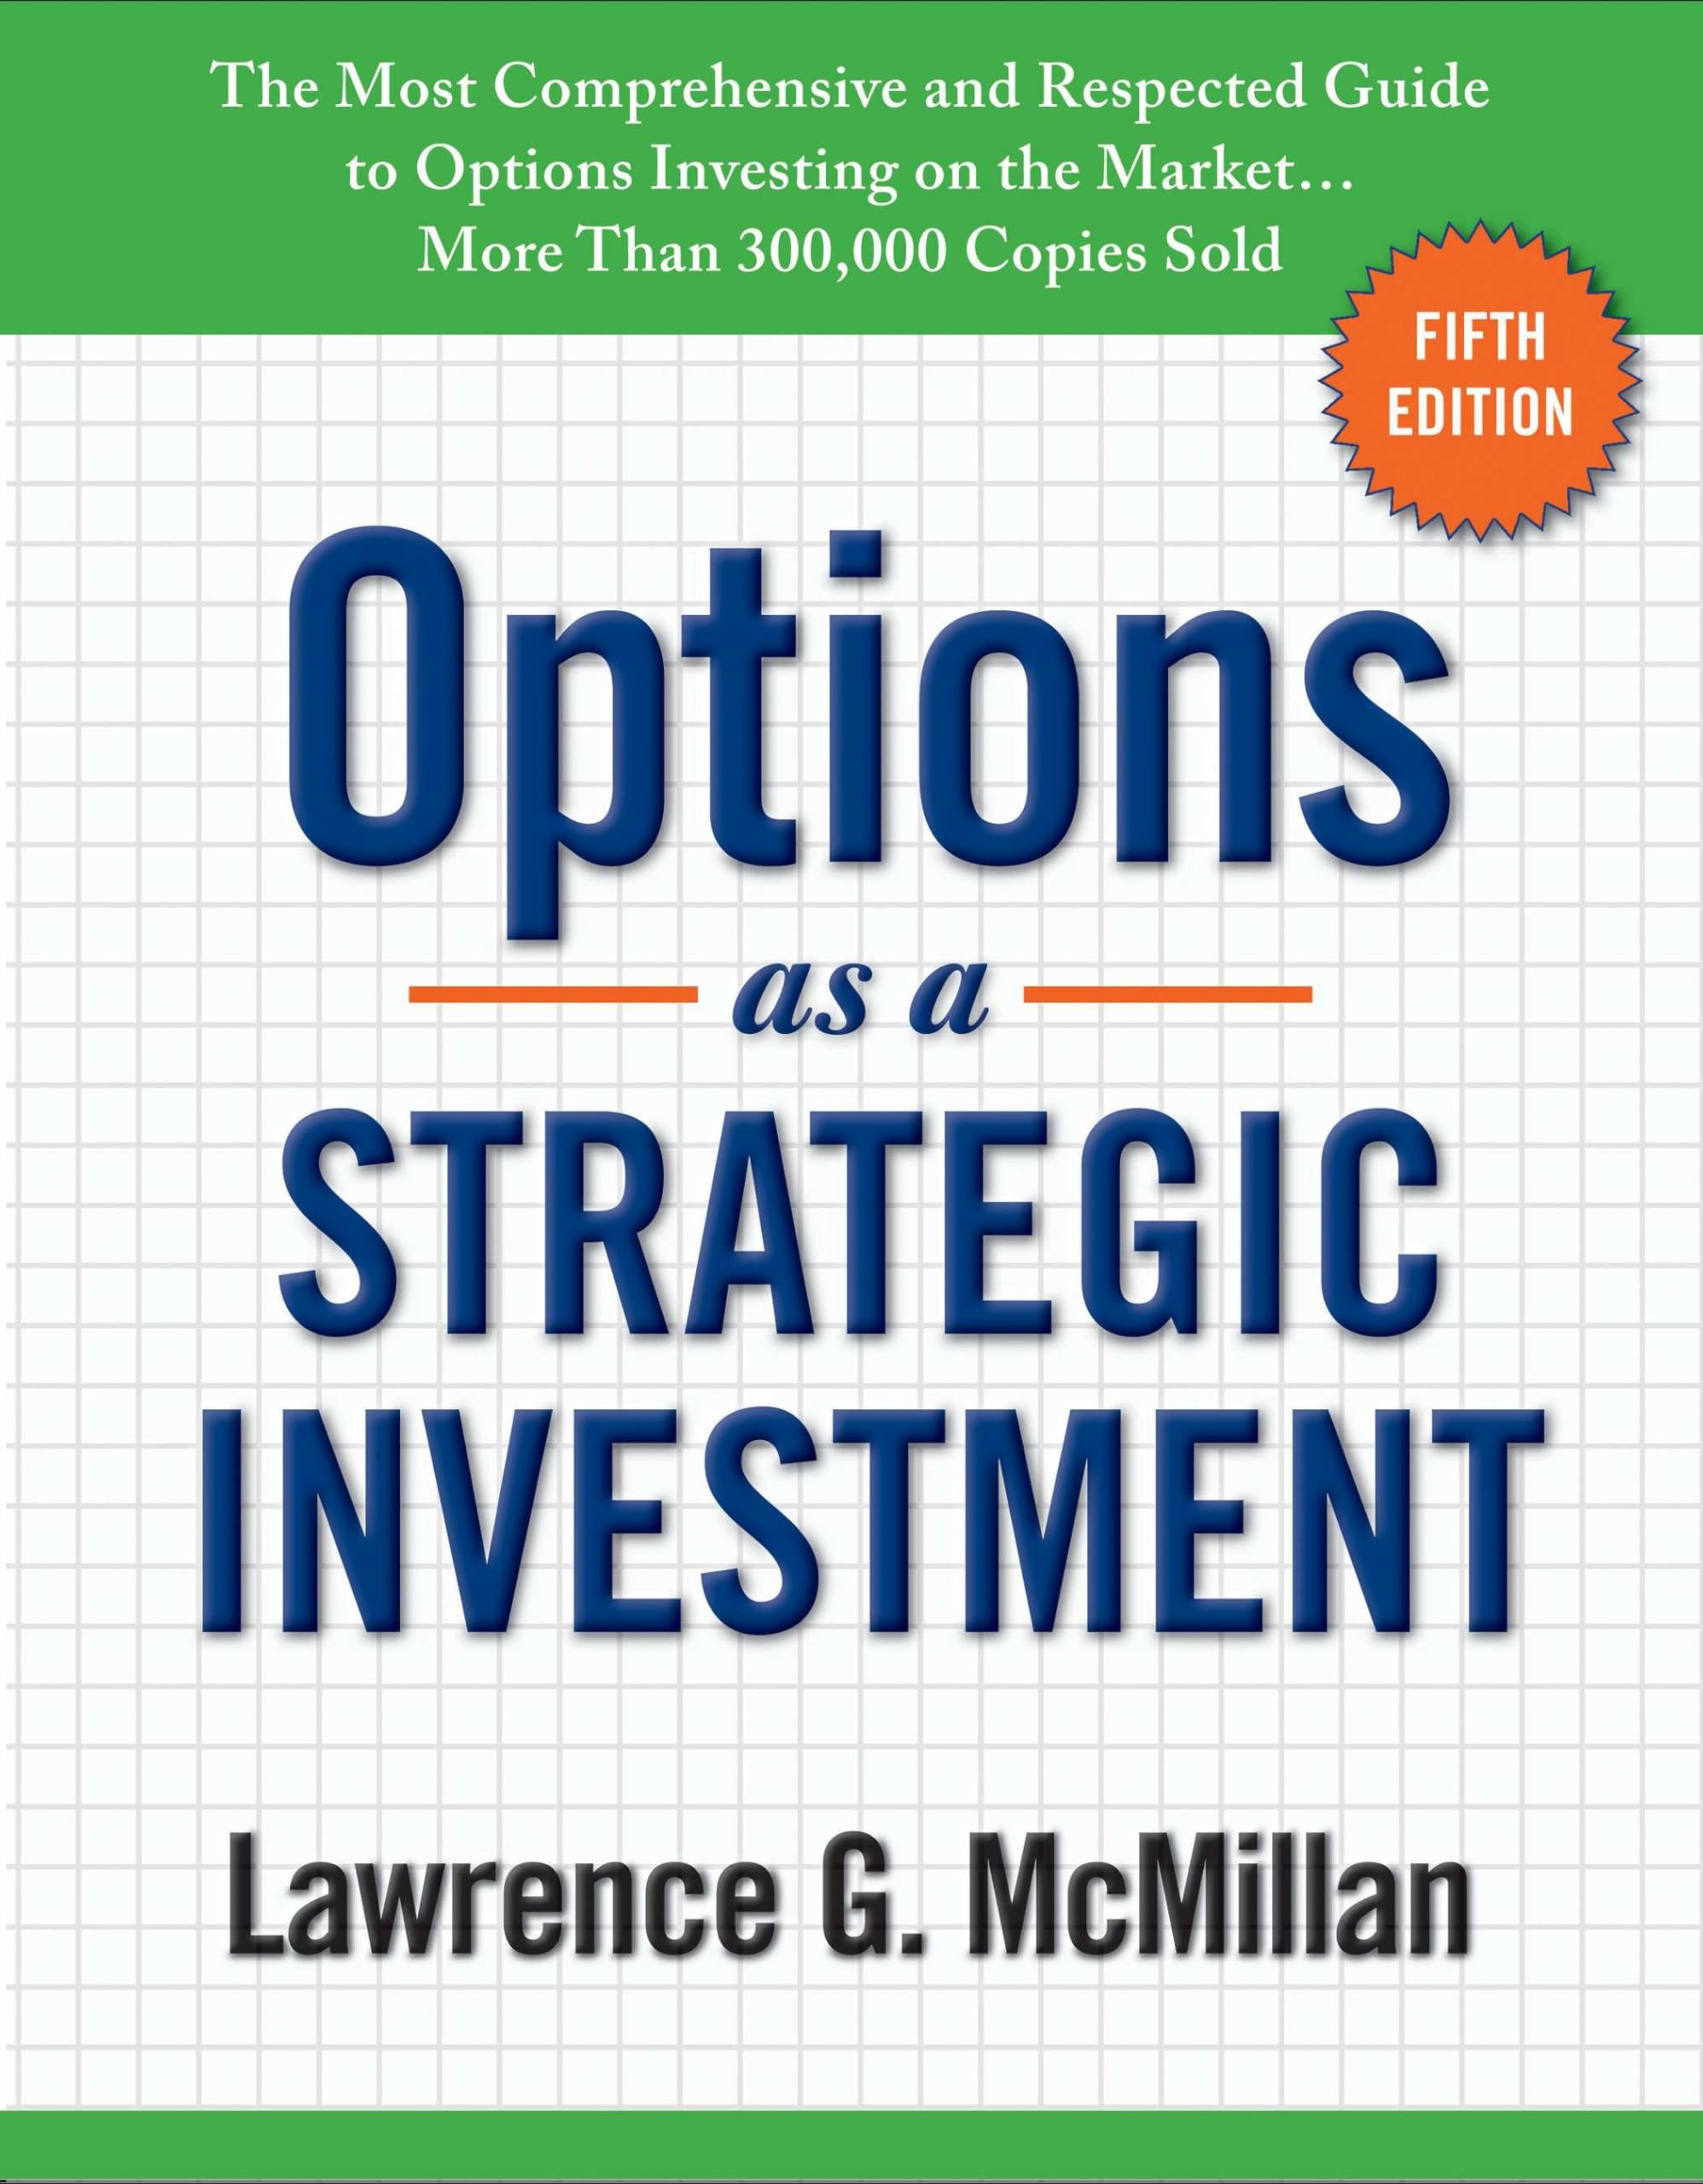
1. Options as a Strategic Investment
This book is considered a classic in the world of options trading. It explains more than 60 options strategies in detail, such as covered calls, spreads, straddles and combinations. McMillan has presented the trading logics, risk-reward ratio and practical application of each strategy in a very simple language. If you are at an intermediate or advanced level in the options market, then this book can help you master things like multi-leg strategies, volatility shifts and hedge planning. Its concepts are fully applicable for traders trading options in India as well, just a little adjustment is required to the context. This is a must-read for a serious options trader.
2. Option Volatility and Pricing
This book is considered to be a definitive guide to understanding volatility and pricing in the options market. Natenberg has explained implied volatility, historical volatility and option Greeks (Delta, Gamma, Vega, Theta) in simple language in this book. This is especially important for traders who trade near expiry or scalp weekly options. In this, theoretical models have been explained by linking them to real market situations, which makes the concepts even more practical. This book is very helpful to understand the rapidly changing premiums and declining values over time in the Indian options market. This book provides a strong foundation for advanced learning.
3. The Bible of Options Strategies
If you want to understand option strategies in a visual and step-by-step way, then this book is perfect for you. It explains more than 60 option strategies with charts, graphs and tables, so that even beginners can learn quickly. Guy Cohen has given different strategies for bullish, bearish, neutral and volatile market conditions. Indian traders get practical clarity in this as to when and how to apply which strategy. This book is very useful for those who want to understand the theory as well as real-time application.
4. Trading Options Greeks
This book focuses completely on option Greeks (Delta, Gamma, Theta, Vega). Dan Passarelli has explained how these Greeks affect the risk and reward of an option position. Especially for Indian traders, who struggle with Theta decay near expiry, this book can become a practical toolkit for them. It also includes real-world trade adjustments and risk management strategies. For traders who want to move beyond directional betting and learn data-driven trading. It is an excellent guide to understanding option adjustments and portfolio hedging.
5. Options Trading: The Hidden Reality
This book opens up the layers of options trading that a beginner usually misses. Charles Cottle has explained in depth complex concepts like option structure, synthetic positions and dynamic hedging. This book is not theoretical but based on a real-time mindset and execution. Although its language and depth is a bit advanced, it is a must-read for serious traders who are looking for consistent profits. It helps in looking at the mechanics of options trading from a scientific perspective, especially when adjusting or hedging positions.
6. The Options Playbook
This book presents options trading as a “playbook”, where each strategy is explained based on the mood of the market you are in bullish, bearish or neutral. Along with real-life examples, entry, exit and break-even points are also explained very precisely. Brian Overby has written it especially for beginners and part-time traders who want to take smart decisions by understanding the strategy. Indian traders will get the clarity in it which is often lacking in YouTube content.
7. Options Made Easy
As the name suggests, this book is written to make options trading easy. Guy Cohen explains the basic terminologies, strategies, and risk control of options in a very simple language. This book is ideal for those who are just entering the options market and want to get clear information without complex calculations. The visual charts and case examples included in it are very helpful for beginner Indian traders to understand. This book is highly recommended for a solid foundation.
8. Mastering the Trade
This book focuses on options as well as futures and technical analysis. John Carter also discusses his real trades, setups, and psychological preparation. Timing and entry-exit planning are very important in options trading, and Carter teaches this very well. If you want to learn options as a complete system, not just a strategy – then this book can prove to be very beneficial for you. Indian index traders will find it helpful to understand the multi-timeframe approach.
9. Trading in the Zone
This book is considered to be the best to understand the psychological strength of options or any trading form. Mark Douglas has explained in it that successful trading depends not only on strategy but also on mindset. Fear, doubt, overconfidence and how all these affect our decisions, has been explained in a very accurate and relatable manner. Indian option traders who repeatedly face small losses or missed entries, this book can teach self-analysis and emotional control. It is a master guide of mental discipline.
10. NISM X Taxmann’s Equity Derivatives
This book is important to understand the structure, rules, and regulations of the Indian derivatives market. In this book published by NISM, both futures and options have been explained under the framework of SEBI. If you want to consider option trading as a profession and not just a hobby, then this book becomes a must. Through this, you can get a complete understanding of things like contracts, lot sizes, expiry rules, and risk disclosures in the Indian market. It is also a recommended book for those preparing for NISM certification.
Read Also: Option Chain Analysis: A Detail Guide for Beginners
How to Choose the Right Option Trading Book?
Every trader has different needs and learning stages so choosing the right option trading book is just as important as developing a strong trading strategy. Here are 5 important things to consider before you read any book:
- If you are new to trading, choose a book that explains basic concepts like call, put, strike price and expiry in simple language. Experienced traders will find books focused on advanced strategies, volatility analysis and risk management more useful.
- Some books are based on options strategies, some on psychology or decision-making, and some are purely on theory. You should choose content according to your needs — whether it is income generation or mindset building.
- Most books are written keeping in mind the US market, which has American-style options. India uses European-style options that settle on expiry. So choose books whose concepts are globally relevant.
- A great option trading book not only teaches concepts but also teaches practical application through real-world examples, charts and trade setups.
- Some books are written in technical terms and complex language. So choose a book that you can easily understand.
Conclusion
Choosing the right book to learn option trading can create a strong foundation. Whether you are a beginner or an experienced trader, a good book not only teaches strategies but also explains important aspects like discipline, mindset and risk control. All the best option trading books mentioned above provide practical knowledge as well as real market understanding. Every trader should choose a book according to his learning level, so that knowledge can be converted into action. Right information, decision taken at the right time this is the hallmark of a successful options trader.
Frequently Asked Questions (FAQs)
Which is the best book for option trading beginners?
Options Made Easy is a great book for beginners as it explains basic concepts in simple language.
Are there any Indian authors who have written good options trading books?
“How to Make Money Trading Derivatives” by Ashwani Gujral and “Mastering Options Trading in the Indian Stock Market” by Nagaraj Balasubramaniam offers comprehensive, India-focused strategies on charting, risk management, psychology, hedging and advanced options techniques.
Do these books cover Indian stock market examples?
Some books do, but most of the concepts are globally applicable to the Indian market as well.
Can I learn option strategies just by reading books?
Books provide a foundation, but practice and market experience are also important.
Are these option trading books useful for intraday traders?
Yes, many books provide short-term strategies and risk management tips that are useful in intraday trading.