In the world of investing, investors are always looking for ways to maximize their returns. One such powerful option is Margin Trading Facility (MTF). With MTF, you can buy more shares than your cash would normally allow by borrowing funds from your broker. This leverage can amplify your profits, but it also increases risk if the market moves against your position.
In this blog, we will explain to you what Margin Trading Facility (MTF) is and how it works.
What is a Margin Trading Facility?
Margin Trading Facility is aservice provided by a stockbroker in which a trader can purchase shares by paying only a portion of the total transaction value. It is like paying an upfront amount for entering the trade, and the remaining amount is paid by the broker. The amount which is paid by the trader is known as “Initial Margin”, and the remaining amount paid by the broker is called the funded amount. Margin trading generally carries high risk.
Features of Margin Trading Facility
The key features of the margin trading facility are as follows:
High Purchasing Power: Through margin trading, the buyer can purchase more securities than they could afford; helping investors increase their purchasing power.
Upfront Margin: The investor is required to pay only the upfront margin, not the entire amount of the transaction value.
Interest: The investor will have to pay interest on the amount borrowed from the broker.
Regulated Stocks: Only the stocks which are approved by SEBI and your stockbroker are eligible for margin trading.
The margin trading facility works in the following manner:
Margin Money: The investor will have to deposit a margin amount, which is a certain percentage of the total trade value. Margin percentage is pre–defined and generally ranges from 20 to 50%.
Funding: The remaining amount of the trade value is funded by the broker.
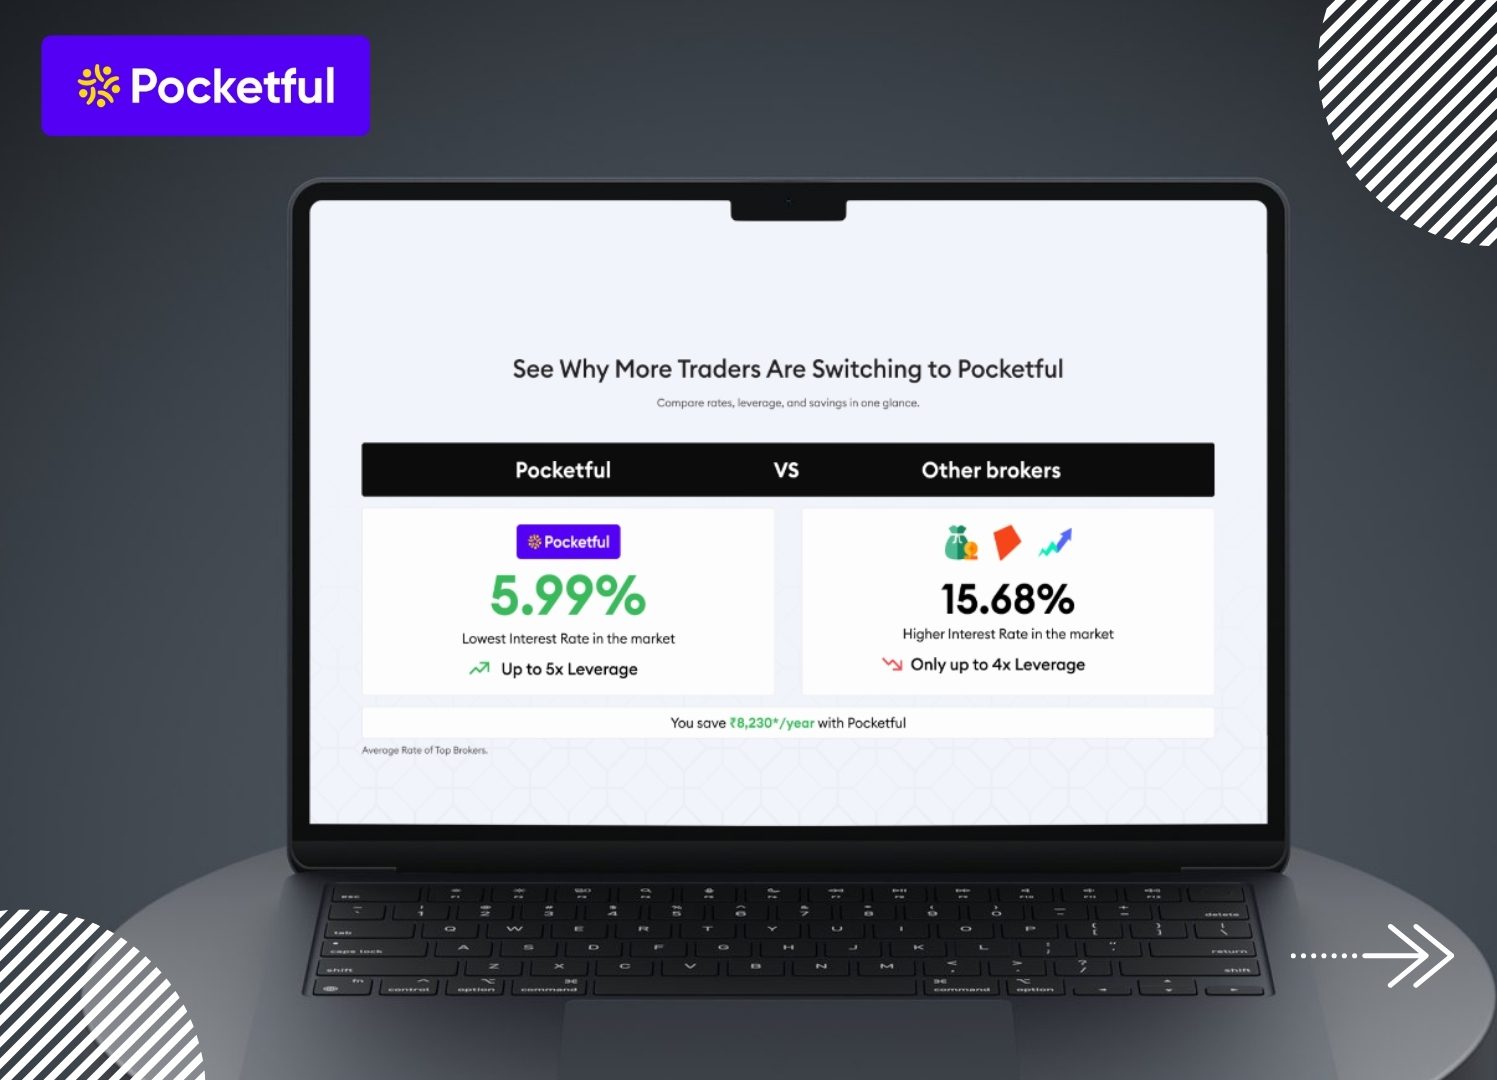
Interest Charges: The broker charges interest on the funded amount, and the rate of interest varies from broker to broker.
Collateral: The shares purchased by the investor are pledged or kept as collateral by the broker.
Square Off Position: Once you square off the position after a certain period, you have to pay the dues to the broker.
Let’s understand the concept of Margin Trading Facility with an example.
Suppose you wish to purchase 100 shares of a company with a share price of ₹1000. Then the total traded value is ₹1,00,000. Suppose, you are required to pay 25% of the trade value as the upfront margin. Then, the total amount payable as upfront margin by you will be 25% of ₹1,00,000, which is equal to ₹25,000. And the remaining 75% or ₹75,000 will be paid by the broker. Suppose the broker charges 14% per annum on the funded amount paid by the broker for the duration for which you hold the trade.
If you hold the stock for one month or 30 days, then you will have to pay the interest on the borrowed amount for 30 days. Which will be calculated as follows:
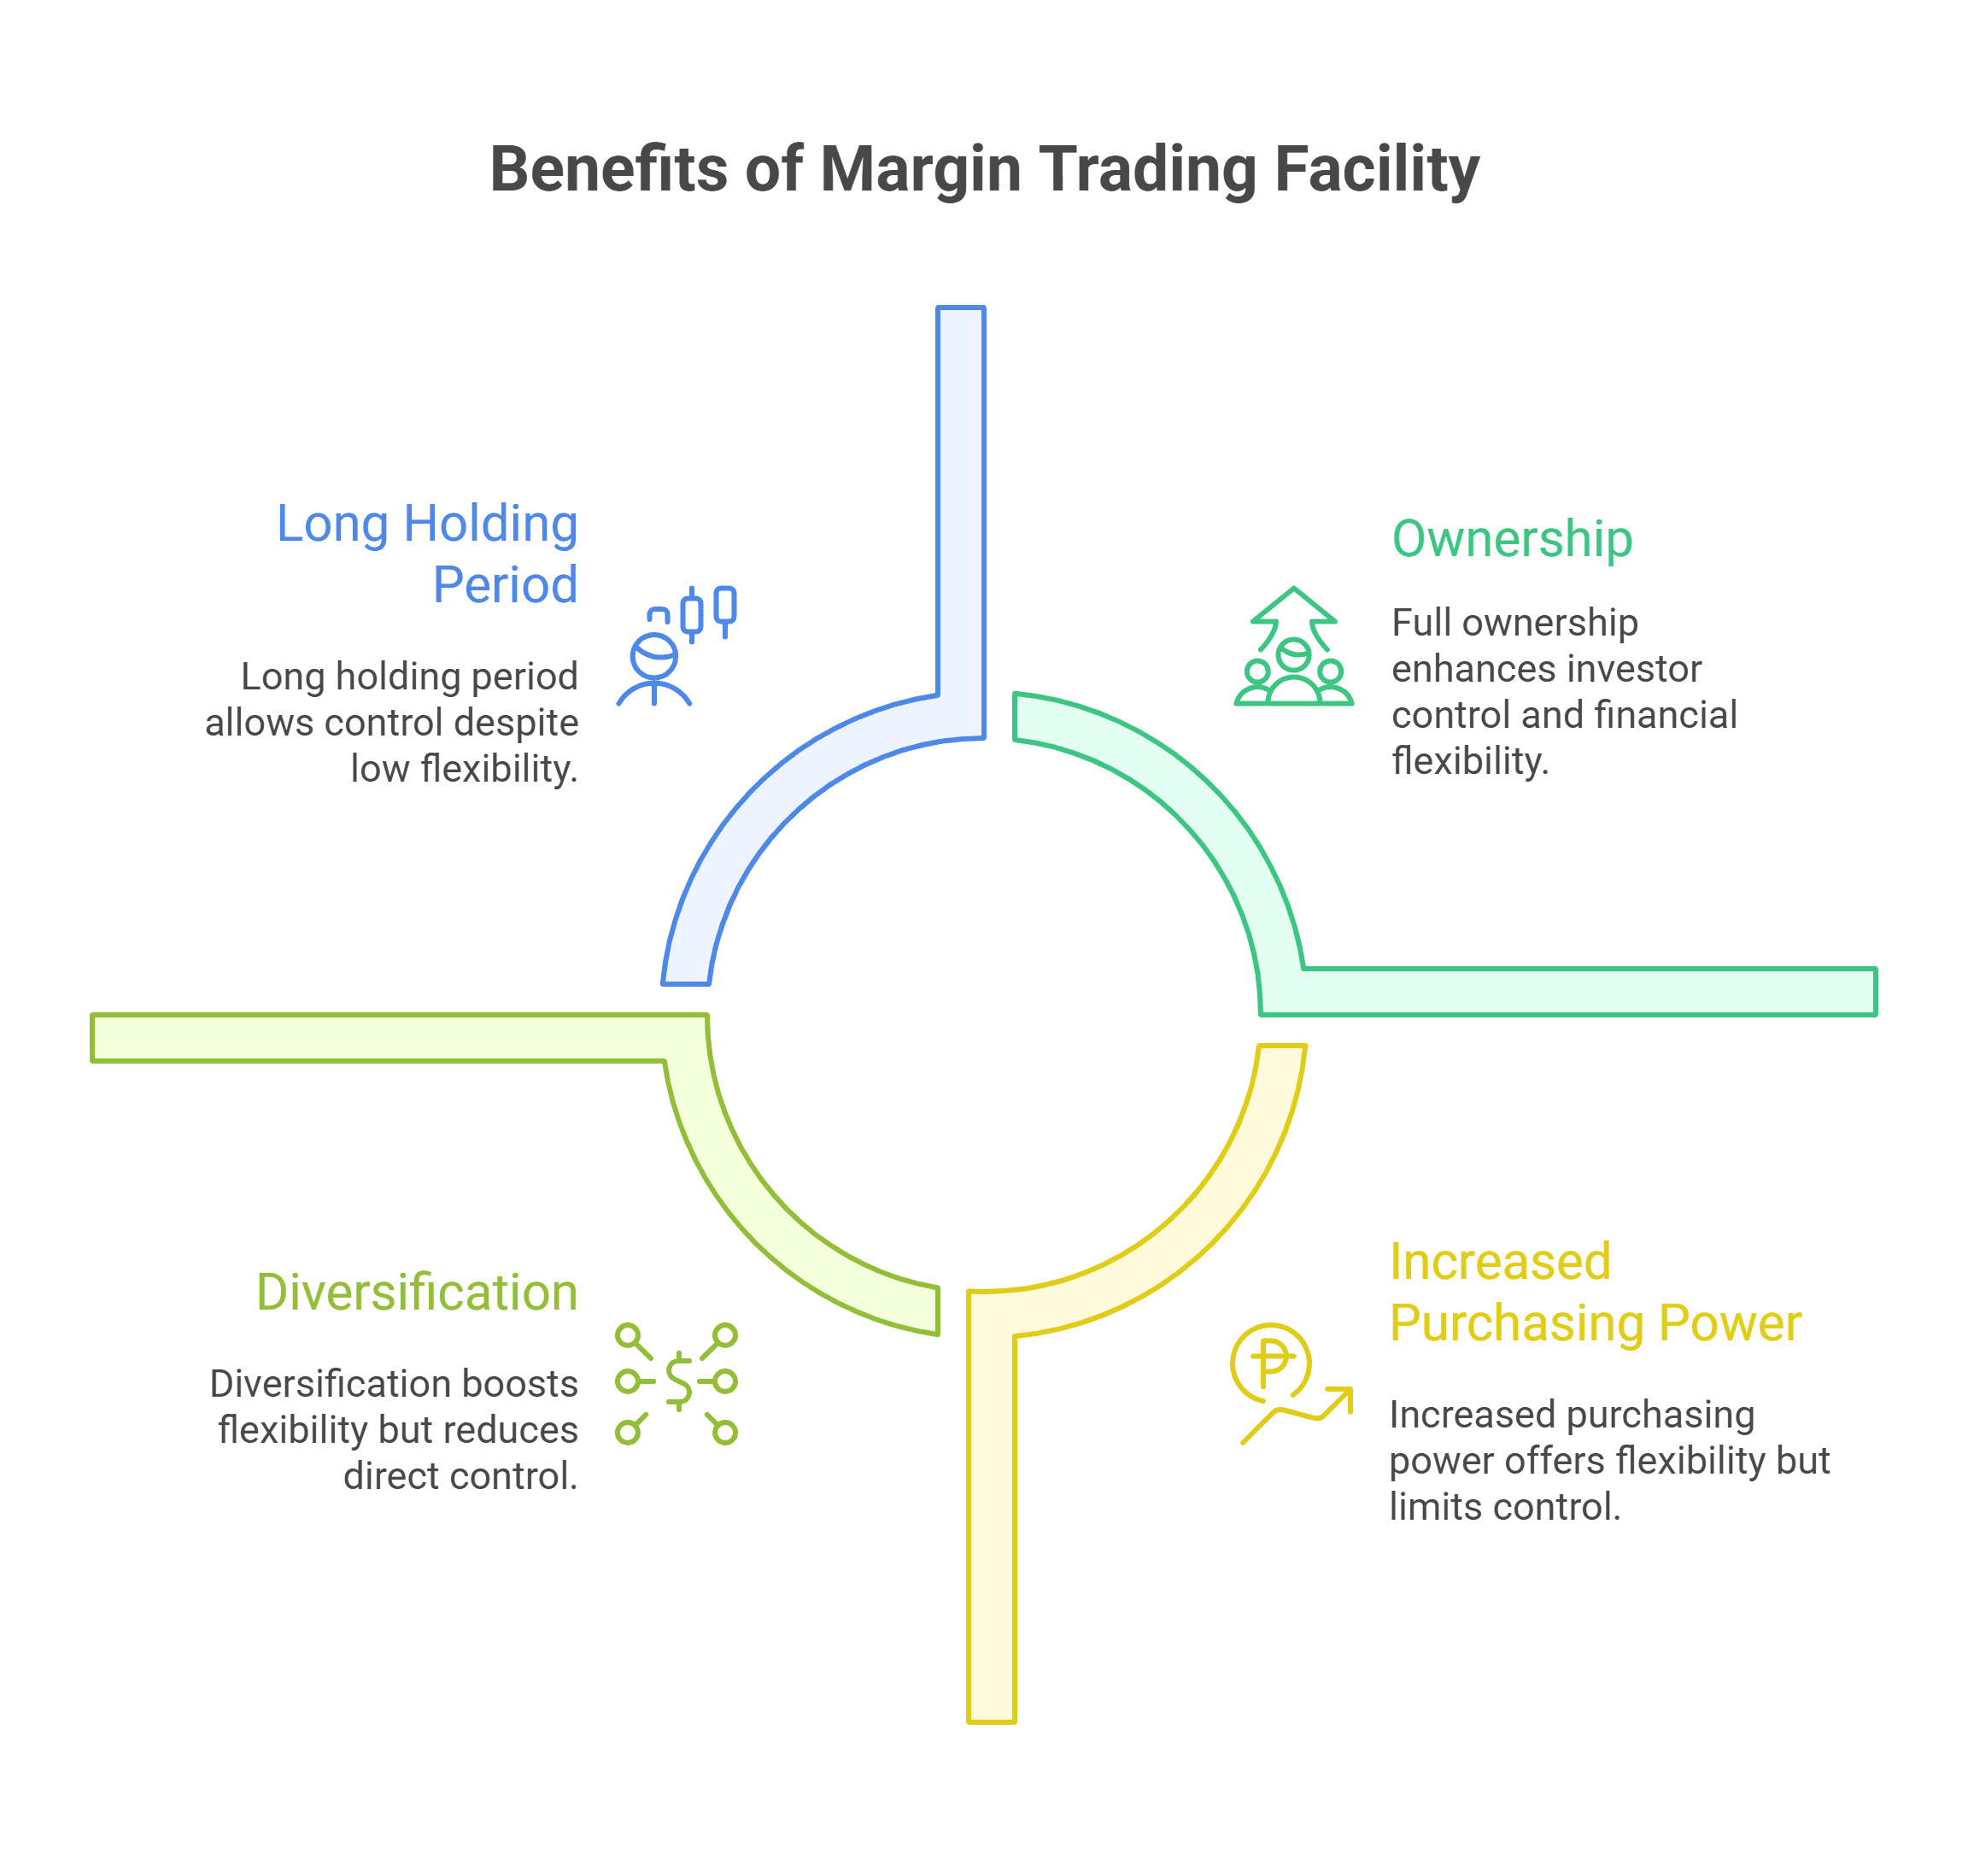
The significant advantages of using Margin Trading Facility are as follows:
Increased Purchasing Power: Using MTF increases the purchasing power of the investor, which potentially increases profits if the stock moves in a favorable direction.
Long Holding Period: One can easily hold their position for a longer period of time, say one week or one month, allowing them to generate good returns on their investments.
Diversification: MTF helps investors use their capital more efficiently by leveraging it to buy stocks. This frees up funds to invest in other opportunities, enabling a more diversified portfolio.
Ownership: Shares purchased through MTF are held in the investor’s name, meaning they enjoy full ownership. As a result, investors are entitled to participate in all corporate actions, such as dividends, bonuses, rights issues, and voting.
The next step is to transfer the funds to your trading account.
Once the account is opened successfully, you need to identify the stock which you wish to buy.
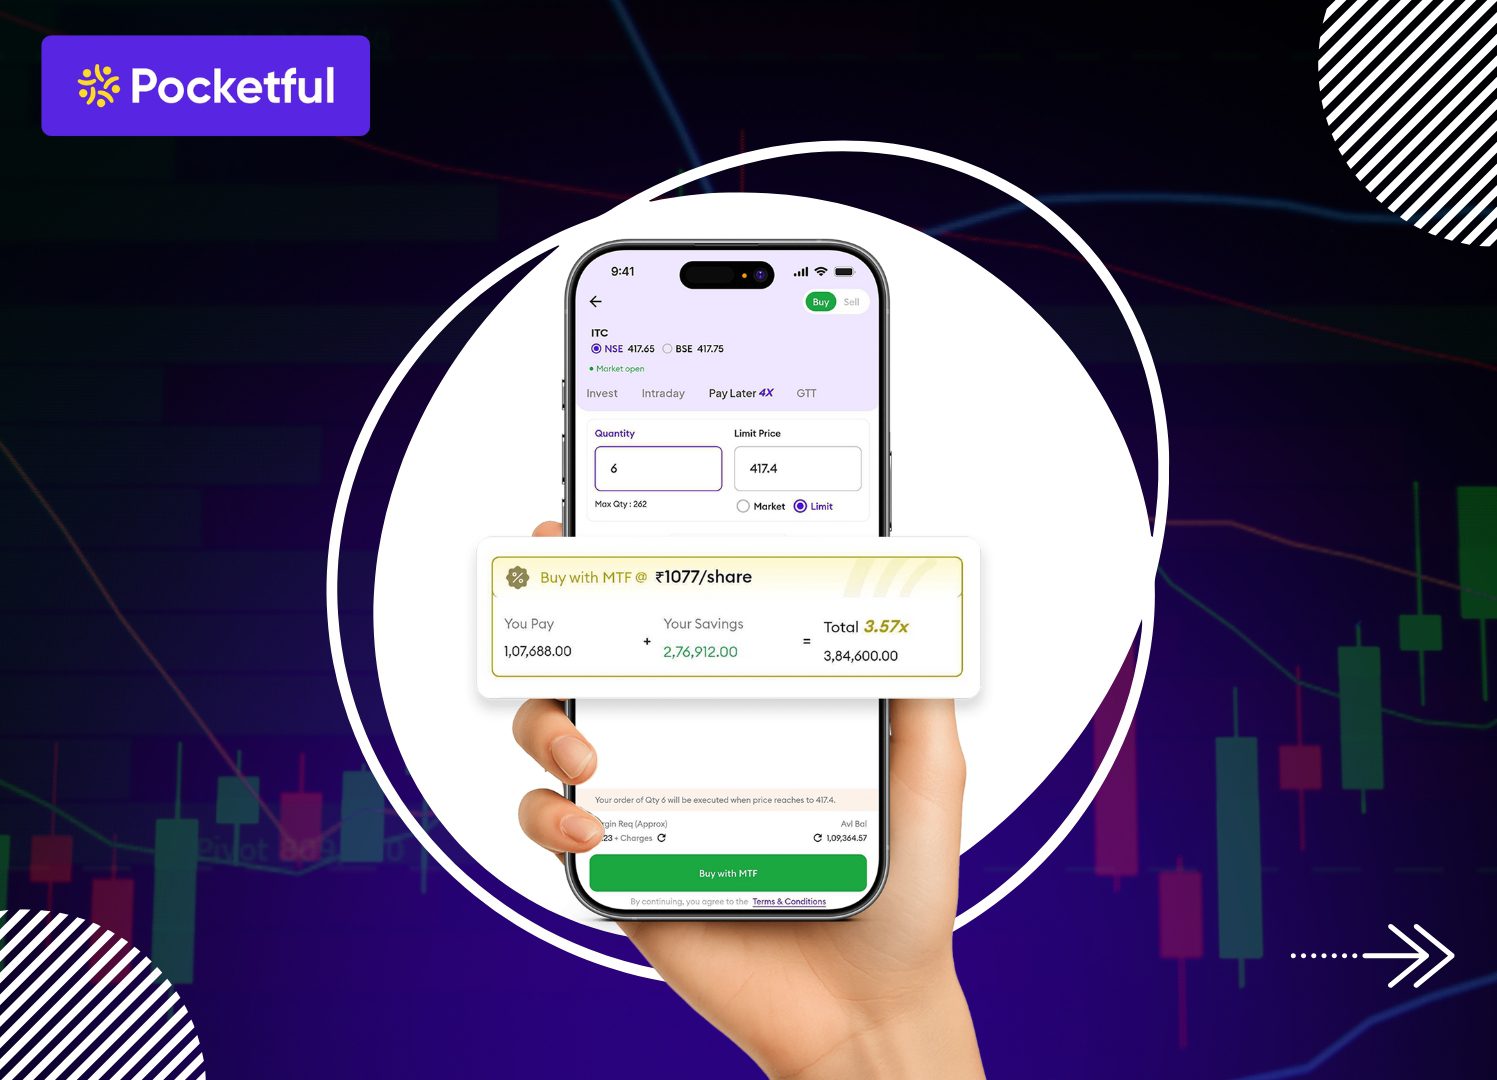
Go to the order window, switch to the “Pay Later” option and enter the quantity and price.
Click on Buy with MTF and your order is executed.
Once the stock is purchased, these are automatically pledged, and your transaction is completed.
Note: Make sure that your DDPI is enabled to buy stocks using MTF.
Conclusion
On a concluding note, the margin trading facility allows an investor to earn significant profits with a limited amount of capital. The investor is required to pay interest on the amount which is borrowed from the broker. However, using MTF comes with various risks, such as interest rate cost, potential for higher losses. Therefore, it is advisable to use the MTF facility only after consulting your investment advisor.
S.NO.
Check Out These Interesting Posts You Might Enjoy!
MTF refers to Margin Trading Facility offered by brokers to their clients, in which one can use the funds provided by their broker to take a much larger buy position in the equity market.
Can I trade in every stock using MTF?
No, only selected stocks can be bought using MTF. You can find the list of eligible stocks on your stockbroker’s website.
Is interest charged by the broker for using the Margin Trading Facility?
Yes, the stockbroker charges interest on the borrowed amount.
What is Upfront Margin?
Upfront Margin is also known as initial margin, which is paid by the investor before buying using MTF.
Can I hold shares using MTF for the long term?
Yes, you can hold shares using MTF for the long term; however, the policies related to the holding period vary from broker to broker.
If you’re not familiar with the word “Options” in the financial world, then this blog is for you. Options are derivative contracts that give the holder the right (but not the obligation) to buy or sell an underlying asset at a specified price on or before a specified date of expiry.
There are multiple ways to trade in options generally termed as trading strategies. In this blog, we will delve into the detailed study of widely used bullish, bearish, and neutral options trading strategies.
Before we delve deeper, let us understand the broader terminologies used in the options world:
Spread
A spread involves buying and selling options of the same type (either call or put) on the same underlying asset but with different strike prices or expiry dates. The main objective of spread strategies is to profit from differences in premiums. Spreads are multi-leg strategies that involve two or more trades.
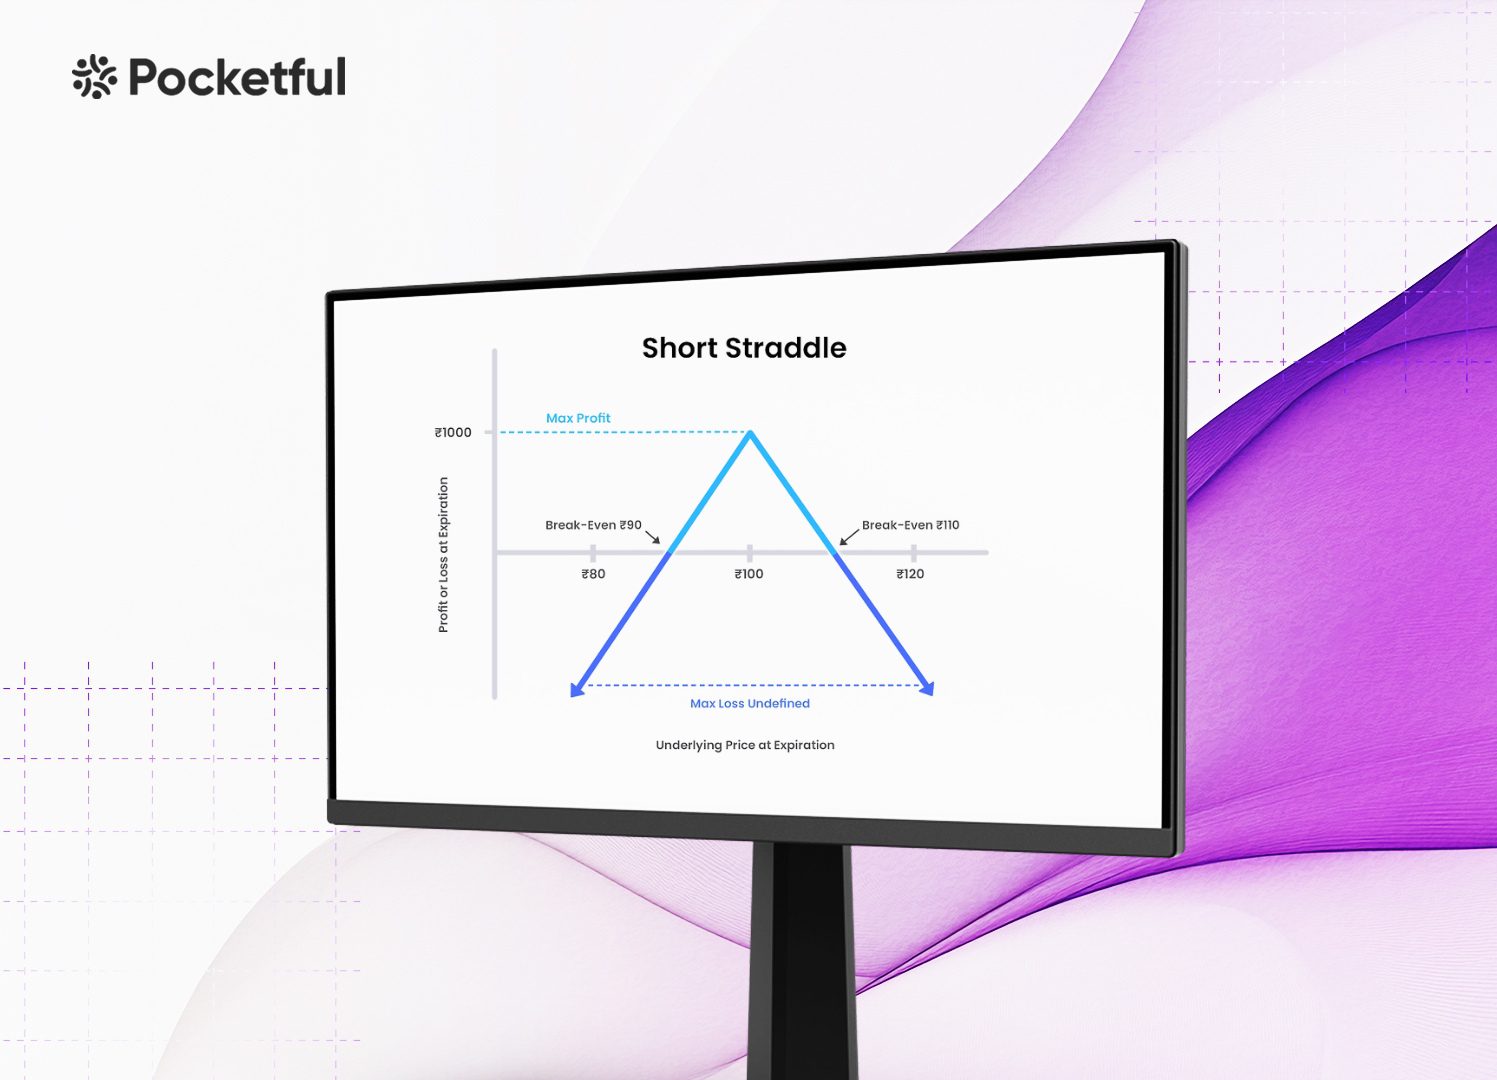
Straddle
In a straddle, the investor buys both the call option as well as a put option with the same strike price and same date of expiry. Straddle is used when investors expect volatility in the market and are not sure in which direction the market will move.
Strangle
Strangle is more or less similar to straddle but involves buying a call option and a put option with different strike prices that are slightly out of the money. Strangle is used when investors are uncertain about the direction and are expecting high volatility.
This is a vanilla or a simple strategy where the investor buys a call option and earns profits from an increase in the price of the underlying asset. Profit potential in long calls is unlimited.
Bull Call Spread
In a Bull call spread, investors buy a call option with a lower strike price (in the money or at the money) and sell a call option with a higher strike price (out of the money). Both the trades are of the same expiry.
Investors pay a net premium to enter into the trade. The premium paid for the call bought is partially offset by the premium received from selling the call with a higher strike price.
The maximum profit is limited and happens when the price of the underlying asset is at or above the higher strike price on the expiry date.
Bull Put Spread
In a bull put spread investors are moderately bullish on underlying assets. The investor sells a put option (at-the-money) with a higher strike price and simultaneously buys a put option (out-of-the-money) with a lower strike price on the underlying asset.
Traders receive a net premium when establishing the spread and the maximum profit is limited to the net premium received when establishing the spread and happens when the price of the underlying asset is at or above the higher strike price at the date of expiry.
Call Ratio Back Spread
Call ratio back spread is a strategy used by investors when they expect a rise in the price of the underlying asset. The investor sells a specific number of call options that are at-the-money or in-the-money. Simultaneously, the investor buys a larger quantity of call options with a higher strike price and these call options are out-of-the-money.
Maximum profit in the call ratio back spread strategy is unlimited if the price of the underlying asset rises substantially.
Protective Put Strategy
This strategy is designed to protect the investor’s existing position of the stock from downside risk. In this strategy, the investor already owns the underlying stock and he buys a put option with a strike price equal to or close to the current market price. The investor pays a premium to buy the put options and these put options act as insurance.
Maximum profit potential in the protective put strategy is unlimited as stock can move upside infinitely.
If an investor buys the stock and put at the same time, it is known as “Married Put”.
Bearish Trading Strategies
Bear Call Spread
Bear Call spread is a bearish trading strategy that involves selling a call option with a lower strike price and simultaneously buying another call option with the same expiry date but at a higher strike price. Risk and reward in a bear call spread are limited.
Bear Put Spread
An investor chooses this strategy if he expects the price of an underlying asset will go down in the future, however, not significantly.
In a bear put spread, an investor buys a put option with a higher strike price that gives him the right to sell the underlying asset before or at the date of expiry and simultaneously the investor sells a put option with a lower strike price that gives him an obligation to buy the underlying asset. Maximum profit is limited to the difference between strike prices minus net premium paid. Maximum loss is limited to the net premium paid.
Neutral Trading Strategies
Covered Call Writing
In this strategy, the investor already owns a stock. The investor sells the call option against the owned stock and receives a premium upfront for selling the call option and this premium is the maximum profit.
Now, if the stock price rises above the strike price of the call option by the expiry date, the buyer will exercise the option and the investor will have to sell the shares at the strike price and will keep the initial price of the stock and the premium. The profit potential is limited to the strike price.
If the stock price stays below the strike price by the expiry date, the option will expire worthless and the investor will pocket the gains, i.e., the premium received.
Iron Condor options strategy
The iron condor options strategy combines two spreads: bull put spread and bear call spread so that profits can be generated even from the low volatility of the price movement of the underlying asset. In this strategy, the investor sells a put option with a higher strike price and buys a put option with a lower strike price thus creating a credit spread.
Simultaneously, he sells a call option with a higher strike price and buys a call option with a lower strike price. This creates another credit spread.
Both the call and put options have the same date of expiry. The profit potential is limited to the net premium received.
Butterfly Spread Options Strategies
A butterfly spread option strategy uses multiple option contracts to create a position with limited risk and limited profit potential.
There are two main types of butterfly spreads
Long Call Butterfly Spread – In a long butterfly spread, the investor buys one lower strike call option, sells two middle strike call options and buys one higher price call option. Profit and loss potential in this strategy is limited.
Short Call Butterfly Spread – In a short call butterfly spread the investor sells one lower strike price call option, buys two middle strike price call options, and sells one higher strike price call option. Profit and loss potential in this strategy is limited.
We have explored various option trading strategies, each having a unique style and payoff. Choose an option strategy after analysing the market trend and that aligns with your risk profile. Understand the chosen strategy before implementation and do not forget to adjust your market strategies according to the prevailing market conditions. Regularly monitor your positions to mitigate losses because options trading carries inherent risk. It is advised to consult a financial advisor before trading.
S.NO.
Check Out These Interesting Posts You Might Enjoy!
Options Trading involves buying and selling options, which are derivative contracts that give the holder the right (but not the obligation) to buy or sell an underlying asset at a specified price (strike price) on or before a specified date of expiry.
Is bull call spread a bullish strategy?
Yes.
What is the difference between Straddle and Strangle?
Both the strategies are more or less similar, the only difference is in straddle, we use call and put of the same strike price. However, in strangle, we use a call and put option of different strike prices.
What are the three categories of option trading strategies?
Bullish strategies, bearish strategies, and neutral strategies.
Are protective put and married put the same strategy?
Both are similar strategies, the only difference is in the protective put, the investor already owns the shares, and in married put, the investor buys the shares and put option at the same time.
The Trading Account and Profit & Loss Account are essential financial statements that reflect a business’s overall performance during an accounting period. The trading account shows the results of buying and selling goods, helping determine gross profit or loss by comparing sales revenue with the cost of goods sold. The profit & loss account further includes all operating and non-operating expenses and incomes to determine the net profit or loss of the business. Together, these statements provide a clear and systematic picture of profitability, enabling owners, investors, and banks to assess the financial health and operational efficiency of the business.
This blog explains the Trading Account and Profit & Loss Account, their components, structure, purpose, and key differences, helping you understand your business’s true profitability and financial performance clearly.
What is a Trading Account?
It is a financial report that is made by trading and manufacturing companies to analyse the gross profit and gross loss made by these entities from buying and selling of goods during a financial year, by matching direct revenue (sales) with direct cost(value of goods sold). The trading account helps you check the basic financial health of your business.
It tells us if you are making profit from the main activity of buying raw material or goods for resale and selling your goods. This initial profit is called gross profit. It doesn’t consider other costs like your shop’s rent or electricity bill. It just focuses on the profit and losses generated from core business activities.
Debit and Credit
The Trading Account is usually prepared in a ‘T-shape’ format.Imagine a line drawn down the middle, with each side representing the following:
Debit (Dr.) : Debit is shown on the left side in the format, this is where we list all the costs directly related to buying goods for resale or buying raw material and manufacturing goods for sale. Think of this as the money paid for your products.
Credit (Cr.) : Credit is listed on the right side, this is where we list all the income you earned from selling those goods. Think of this as the money earned from selling products.
Components of Trading Account
The components of Trading Account are listed below:
Opening Stock (on the Debit side) : It refers to the value of all the unsold goods and commodities (including raw material, products under production, finished goods) that an entity possesses at the beginning of the current accounting period. It is essentially the closing stock of the immediately preceding accounting period, brought forward to reflect the goods available for sale or production at the start of the current period.
Purchases (on the Debit side) : Purchases is referred to the total value of goods (raw material, semi-finished goods, or finished products for resale) acquired by a business, whether in cash or credit, during the current accounting period, with the primary intention of resale or for use in the production of goods meant for selling. This figure is typically presented net of any purchase returns, discounts, or allowances.
Direct Expenses (on the Debit side) : Direct expenses are those expenditures that are directly and specifically done to make the purchase of goods for resale or the production of goods during an accounting period. These costs are incurred to transform the raw materials into finished production or reselling expenses.
Sales (on the Credit side) : This is the total money earned by selling goods to customers throughout the year during a specific accounting period. It includes both cash sales and credit sales, this is specifically presented as net sales.
Closing Stock (on the Credit side) : This is the value of all the unsold goods (including raw materials, work-in-progress, and finished goods etc) that remains with the business at the end of the current accounting period. It signifies the portion of the goods available for sale or production that has not yet been consumed or sold, and thus, its cost is deferred to the next accounting period as it will generate revenue in that period. We list it on the income side because its cost should not be matched against this year’s sales, as it is still unsold. It will become the Opening Stock for the next year.
Lets learn it using some numbers, below is the example given of a Trading Account
Particulars
Amount Debit (Dr.)
Particulars
Amount Credit (Cr.)
Opening Stock
60,000
Sales (less returns)
3,80,000
Purchases(less returns)
2,35,000
Direct Expense
5,000
Gross Profit (balancing figure)
1,65,000
Closing Stock
85,000
Total
4,65,000
Total
4,65,000
Profit & Loss Account
It is a primary financial statement that summarizes an entity’s financial performance over a specific accounting period. It systematically presents all indirect incomes and expenses incurred during the period, including gross profit transferred from the Trading Account. including the gross profit/loss transferred from the Trading Account. It helps you determine the net profit or net loss generated by the business.
If the trading account was the basic check-up, the P&L Account is the full diagnostic report. It takes the gross profit we just calculated and then subtracts all the other expenses of running the business. The final result is the Net Profit or Net Loss, which tells you if your business is truly profitable overall.
Indirect Expenses and Incomes
The P&L Account also has two sides, just like the Trading Account. It starts with the Gross Profit (or Gross Loss) from the Trading Account.
Indirect Expenses (on the Debit side) : These are the costs necessary to run the business, which are not directly part manufacturing the product itself but are mandatory for the overall administration, selling, distribution and financing of business during the accounting year. These costs directly do not add value to the finished products but are necessary to run a business. For example, electricity bill, salary, telephone bill, etc.
Indirect Incomes (on the Credit side) : This is any extra income the business earns from activities other than its core operating activities. These incomes arise from secondary, or financial activities and contribute to the overall profitability of the business, appearing on the credit side of the Profit & Loss Account.
Let’s see how a P & L Account looks. We start by bringing the Gross Profit of ₹1,65,000 to the credit (income) side we calculated earlier.
Particulars
Amount Debit (Dr.)
Particulars
Amount Credit (Cr.)
Salaries
60,000
Gross Profit
1,65,000
Rent
36,000
Commission Received
5,000
Electricity Bill
12,000
Sale of Scrap
2,000
Telephone Charges
6,000
Repair and Maintenance
3,000
Net Profit
55,000
Total
1,72,000
Total
1,72,000
After considering all other expenses and incomes, the business owner finally sees his Net Profit as ₹55,000. This is the true profit the business has made in the year.
Gross Profit vs. Net Profit
Now you can see why both accounts are needed. They tell different parts of the same story. The Trading Account tells you if your core business idea is working, like buying goods at a good price and selling them for a profit. The P&L Account tells you if your overall business operation is efficient or whether the profits from sales are enough to cover all costs or not.
Imagine a situation where a trading account shows a high gross profit, but P&L Account shows a net loss then it would tell the business owner that while he is good at pricing his products, his indirect expenses, perhaps the shop rent or electricity costs, are too high and are eating away all profits. This single report gives him the power to identify the exact problem and fix it.
Here’s a simple table to show the key differences :
Differences
Trading Account
Profit and Loss (P&L) Account
Meaning
Financial report that is made by trading and manufacturing companies to analyse the gross profit or gross loss
It is a primary financial statement that considers indirect income earned and all indirect expenses incurred to calculate net profit or net loss
Purpose
To identify gross profit or gross loss
To identify net profit or net loss
What it shows
Profitability of buying and selling goods
Overall profitability of the entire business
Included Expense
Only direct expenses
All Indirect expenses as direct expenses are already considered in calculating gross profit calculation
Timeline
First stage in preparing final accounts
Second stage: prepared after trading account
End Result
Gross profit/loss moved to P&L account
Net profit/loss moved to balance sheet
Benefits of Trading and Profit & Loss Account
1. Profits generated
Trading Account : The Trading Account just focuses on direct costs and sales to show you if your core business activity is profitable or not.
P&L Account : It goes a step further and tells us the net profit. It takes that gross profit and then subtracts all your other business costs, things like office rent, salaries for admin staff, advertising, and even the interest you pay on loans. This is the real profit your business made after everything is accounted for.
2. Performance evaluation
By looking at the Trading Account, you can see if you’re buying things efficiently or if your selling prices are high enough. If your gross profit is shrinking, maybe you’re paying too much for your goods, or selling them too cheap.
The P&L Account then helps you see if your other costs (like office expenses or marketing) are getting out of control. It helps you figure out if you’re spending too much on things that aren’t directly making you money.
3. Informed decision making
If your P&L Account shows you’re losing money on a certain product, you might decide to stop selling it.
If your Trading Account shows you’re getting a great gross profit on another item, you might decide to buy and sell more of that.
They help you decide where to put your money, what to sell more and where to cut costs.
4. Legality and compliances
In India, rules set by regulatory bodies makes it mandatory to prepare these statements.
They’re needed for filing your taxes, audits, and submitting to government regulators. Without them, you can’t really run a business.
5. Financial planning
By looking at how much you’ve sold and spent in the past year (from the Trading and P&L Accounts), you can make good guesses about what you’ll sell and spend on in the next accounting year.
This helps you set budgets, decide how much stock to buy, how many people to hire, and what your financial goals should be. It gives you a roadmap for growth.
The Trading and P&L accounts tell you exactly what happened financially in the past year (or quarter, or month). They show how much you sold, what you spent, and what profit you made then.
They don’t predict the future. Just because you made a great profit last year doesn’t guarantee you’ll do it this year. Market conditions change, competition gets tougher, and customer preferences shift. So, relying only on past numbers for future decisions can be risky.
2. Cash in Hand not shown
You can have a huge profit showing in your P&L account, but still be short on cash. Because the P&L account works on an “accrual basis.” This means it records sales when you make them (even if the customer hasn’t paid you yet) and expenses when you owe them (even if you haven’t paid them yet). So, you might have lots of sales on credit, which means profit on paper, but no actual cash in your bank account to pay your bills. This is why you need a separate “Cash Flow Statement.”
3. Misses Out on Non-Financials
The P&L account won’t tell you about how happy your customers are, if your employees are motivated, how strong your brand is, or if you’re developing new products. These “non-financial” things are super important for long-term success, but these statements just don’t show them.
4. Influenced by Accounting Choices
Sometimes, there’s more than one way to account for something, and these choices can affect the profit figure. How you value your “closing stock” (unsold goods) or how you calculate “depreciation” (the way assets lose value over time) can change your profit. These choices are perfectly legal and follow accounting rules, but they mean the profit figure isn’t always a purely objective number; it can be influenced by the methods chosen.
5. Just Summary
The P&L account gives you a summary of your performance. It shows broad categories like Sales or Administrative Expenses, but it doesn’t tell you details like administrative expenses which might be a huge number, but the P&L does not specify whether it’s due to increased rent, higher electricity bills, or more staff salaries. To understand that, you need to dig into separate detailed reports, not just the P&L summary.
By looking at the Trading and P&L Account one can see his exact Gross Profit and his final Net Profit. This is the power of the Trading and P&L Account as it is a financial snapshot of your business. It shows you where your business is strong and where it is losing money. It turns you from being just a business owner into a smart, informed business owner who is in control.
S.NO.
Check Out These Interesting Posts You Might Enjoy!
What is the difference between Gross Profit and Net Profit?
Gross Profit is the profit you make just from selling a product, after subtracting the direct cost related to that product. Net Profit is the final profit amount you have left after you pay for all other business expenses like shop rent, employee salaries, and electricity bills.
Is it compulsory for small businesses to make a Trading and P&L Account?
While it may not be legally mandatory for every type of very small business, it is highly recommended as it is essential for understanding your business’s financial health, managing your money, filing income tax returns correctly, and especially for applying for business loans from banks.
Can a business have a Gross Profit but a Net Loss?
Yes, absolutely. It means you are selling your products at a good price and managing the core business activities well, but your other indirect costs are turning your profits into an overall loss for the period.
Where do expenses like advertising or delivery expenses go?
Costs like “advertising” or “delivery expenses” are not directly tied to making or buying your products. They are necessary to run and support your business operations. Therefore, they are treated as indirect expenses and shown on the debit side of the Profit and Loss Account.
What is the “accounting period” for these statements?
In India, the accounting period is usually one financial year, which runs from 1st April of one year to 31st March of the next year. These statements are prepared to show the profit or loss of your business during this specific one-year period.
In the stock market, many times people do not buy stocks directly, but bet on their prices using derivative financial contracts. Today, the use of derivatives in the stock market is not just limited to institutional traders; retail traders are also actively using them. They were created to protect the portfolio from risk, but now they have also become a means of earning speculative profits.
In this blog, we will learn about types of derivatives, how to use them correctly, what are the advantages and disadvantages of derivatives market, and the things to be kept in mind while trading them.
What is Derivative Trading?
Derivative trading is a process in which you speculate or try to profit from the predicted future price movements of an asset by using related derivative contracts, rather than buying or selling it directly. In simple terms, a derivative is a class of financial instruments whose price is based on another asset (which we call “underlying asset”). This asset can be anything – shares, index, currency, commodity or interest rate.
To understand derivatives trading better, let’s look at an example. Suppose a trader expects a poor monsoon this year and expects a shortage of crops and a rise in prices. To benefit from this expected price increase from future crop shortage, he buys a futures contract with the crop as an underlying asset on the exchange. If the price of the crop does rise as he predicted, he can sell the futures contract at a higher price and earn a profit.
Similarly, investors in the stock market trade derivatives contracts, which either gives their portfolio security from adverse price movement or an opportunity to earn profit from future price movements. In physical trading, you directly buy assets such as shares of a company, but in derivative trading you only bet on the direction of the price of the underlying asset and try to earn profits.
There are three main types of participants in the derivatives market :
Hedgers, who trade to protect their investments from unnecessary risks
Speculators, who trade to earn profits
Arbitrageurs, who take advantage of price differences in different markets
Today, derivatives have become very popular not only among institutional investors but also among ordinary retail traders.
Futures are a standardized agreement in which the buyer and seller make a deal to buy and sell an asset respectively at a fixed price on a fixed future date. These contracts are traded on exchanges.
Example: If someone thinks that the price of gold will rise, he can buy Gold Futures and later sell it at the increased price and make a profit. Futures are used by institutional as well as retail investors and traders for both hedging and speculation.
2. Options Contracts
In options derivatives, the buyer has the right to buy or sell an asset, but there is no obligation. There are two types of these – Call Option (right to buy) and Put Option (right to sell).
Example: Suppose an investor fears that his stock may fall in price, then he can protect himself by buying a Put option. Options are popular especially among retail traders because when buying options, the risk is limited to the premium paid, while the potential return can be very high.
3. Forward Contracts
Forwards are also like futures, but a big difference is that they are not traded on the exchange but are available OTC (Over the Counter) i.e. privately between two parties. They are more flexible because they can be customized according to the needs of the parties.
Example: Companies often use forwards to protect against adverse price fluctuations in foreign currency or raw material prices.
4. Swaps Contracts
Swaps are customized agreements between two parties to exchange future cash flows based on specified financial instruments, such as interest rates or currencies. In a swap, each party agrees to pay the other cash flows that are calculated in different ways. Swaps are generally traded over-the-counter (OTC), making them less accessible to retail investors.
Example: A multinational company based in the U.S. earns most of its revenue in euros but has to pay its expenses in U.S. dollars. To reduce the risk of euro-to-dollar exchange rate fluctuations, it enters into a currency swap with a bank. In this agreement, the company agrees to exchange euros for dollars at a fixed rate at specific future dates. This helps the company lock in exchange rates and better manage its cash flows.
Comparative Description of Types of Derivatives Trading
Type of Derivative
Where it is Traded
Obligation
Primary Use
Futures
Exchange
Yes
Hedging, Speculation
Options
Exchange
Buyer: No; Seller: Yes
Hedging, Directional Trading
Forwards
OTC
Yes
Currency & Commodity Hedging
Swaps
OTC
Yes
Interest Rate, Currency Exchange
How the Derivatives Market Works in India?
India’s derivatives market operates under an organized and strictly regulated system, which is controlled by SEBI (Securities and Exchange Board of India). Derivatives are traded mainly on exchanges like NSE (National Stock Exchange) and BSE (Bombay Stock Exchange), in which Futures and Options are the most prominent segments.
Futures and Options Segment : This segment deals with transactions of Futures and Options contracts based on indices (such as Nifty 50) and stocks. Every contract has a fixed lot size and an expiry date.
Margin and Risk Control : To trade in certain derivative contracts such as futures, one has to deposit a certain margin, not the full contract amount. Mark-to-Market (MTM) settlement takes place after every trading day, in which the profit or loss of that day is adjusted on the next working day (T+1).
Role of Clearing Corporations : Clearing houses and other institutions play an important role in ensuring settlement of derivative instruments. They guarantee every trade and act as a counterparty between the two parties.
Advantages of Derivative Trading
The advantages of derivative trading are listed below:
Risk Hedging : The biggest advantage of trading derivatives is that you can use them to protect your portfolio from market declines. For example, if you fear a decline in price of a particular stock you hold, you can limit your losses by buying a Put option.
Leverage Advantage : Certain derivative instruments can be traded by paying only a small margin instead of the entire contract value. This gives you an opportunity to create a large position even with limited capital, which can significantly increase profits with the right trading strategy.
Earning even in a falling market (Short Selling Opportunity) : Derivatives give you a chance to earn even in a downtrend. With the help of futures or put options, you can make profits even when the market falls.
Better liquidity and exit facility : Derivatives on indices such as Nifty and Bank Nifty have heavy volumes daily, which allows easy entry or exit at any time.
Disadvantages & Risks of Derivative Trading
The disadvantages and risks of derivative trading are:
High risks : Due to leverage in derivatives, the losses can be huge. If the market moves in the wrong direction even a little, you can lose your entire capital.
Loss due to lack of knowledge : The complexity of options and futures contracts can confuse new investors. Wrong decisions can lead to significant losses if there is no proper understanding of concepts like strike price, expiry, premium, etc.
Decreasing value with time (Time Decay) : Time can be the biggest enemy for option buyers. If the expected price move does not happen quickly, then the option can decline in value even with the passage of time.
Emotional pressure and stress : The fast movement of the market and uncertainty sometimes leads to wrong trades out of fear or greed. This psychological stress can make trading in derivatives more dangerous.
Who should do Derivative Trading?
Derivative trading is suitable for the following:
Experienced traders : Trading in derivatives is fast-paced and risky. In such a situation, it is most suitable for those who already have trading experience and understand charts, patterns or market cycles.
Portfolio managers and hedgers : For those who want to protect their long term investments from market decline, derivatives can be an excellent means of hedging.
Informed retail investors : If you are a retail investor but have an understanding of the market, know how to control risk, and trade with discipline, then you can also gradually step into derivatives.
Derivatives in Stock Market vs Other Asset Classes
Derivatives are fast-paced, risky but strategic financial tools that can help protect a portfolio or earn huge profits if used with the right knowledge and discipline. It is not only useful for hedging but also opens the way for creating much larger positions with less capital. However, the complexity and the risks associated with these contracts cannot be ignored. If you want to trade in derivatives, it’s essential to first prepare yourself thoroughly: learn the concepts, understand the risks, and practice carefully before you start. Entering the derivatives market without proper knowledge and strategy can be risky and may lead to significant losses instead of gains. So, start wisely and always trade with caution.
S.NO.
Check Out These Interesting Posts You Might Enjoy!
In the dynamic world of trading, there are various tools available that can help you increase your return in the stock market. One such tool or facility is margin trading, which is becoming very popular among traders as it allows them to take a larger position without paying the full value upfront. However, before trading, understanding how to use margin trading wisely becomes essential.
In this blog, we will explain the top tips for successful margin trading.
What is Margin Trading?
Margin trading involves borrowing money from a broker to purchase or sell securities. Although margin trading involves a higher risk, it enables traders to take on larger positions than their actual capital and thus magnifies profits. Typically, the trader pays a margin upfront, which is set by the broker based on the entire trade value, and the broker pays the remaining sum on your behalf. You have to pay interest on the borrowed amount.
The important top tips for successful margin trading are as follows:
Understanding: Before initiating any trade using margin, one should become familiar with the concepts of leverage, initial margin required, etc.
Conservative Approach: Don’t use the maximum leverage that is permitted. To minimise risk, start by using less leverage until you are confident in your approach.
Stop Loss: To protect your capital, a stop-loss order allows you to automatically exit a trade at a set loss level. In margin trading, it is essential to use a stop-loss.
Monitoring: Especially in times of market volatility, it is essential to give particular attention to your open positions.
Diversification: Avoid allocating all your margin capital to a single stock or position. By spreading your investments across multiple stocks or sectors, you reduce risk and protect your portfolio from the impact of a single unfavorable trade.
Manage Your Emotions: Trading on margin can test your emotional discipline. Stay calm, stick to your plan, and avoid taking decisions based on greed or fear.
Stay Updated: One is required to keep oneself updated about the latest market updates and geopolitical events so that, in case of any negative news, one can exit their position promptly.
Liquid Stocks: It is always suggested that liquid stocks be used for margin trading, as liquid stocks can be easily bought and sold.
Interest Rates: Brokers charge interest on the margins; therefore, comparing the interest rates charged by different brokers is recommended to get a better deal.
Avoid Margin Calls: When the stock price you have purchased falls, your broker will notify you to pay an extra margin. Therefore, one should constantly monitor their trading positions.
The important features of margin trading are as follows:
Leverage: This margin trading feature lets you trade with more money than you have.
Initial Margin: The initial margin, which is a set percentage of the entire trade value, must be deposited before you can start margin trading.
Interest Rate: Until the position is closed, you will be liable for paying interest on the money you borrow from the broker.
Short Term: In order to profit from market volatility, margin trading is commonly used for short-term trades, particularly intraday or swing trading.
Restricted Shares: Not all stocks are permitted for margin trading. Brokers usually only allow this facility for liquid stocks.
Benefits of Using Margin Trading
The significant benefits of margin trading are as follows:
Higher Returns: Large positions can be taken on by traders with limited funds. However, it also comes with a higher risk as margin trading increases the buying power of the trader.
Short Selling: Using margin trading, one can initiate short positions in the futures by paying a limited margin, which allows traders to profit from bearish markets.
Frequent Trades: In Intraday Trading margin trading is particularly helpful because it enables traders to take multiple positions in a single day and profit from short-term price changes without using up all of their capital.
Diversification: Margin Trading allows you to spread risk by investing in a number of stocks or industries instead of putting all of your money into one.
On a concluding note, margin trading is a very effective tool enabling an investor to enhance their return with limited capital. One can increase their purchasing power multifold. However, margin trading comes with various risks; therefore, it requires a disciplined approach, effective risk management, etc. Therefore, it is advisable to first learn about margin trading and consult your investment advisor before initiating any trade in order to avoid losses.
S.NO.
Check Out These Interesting Posts You Might Enjoy!
Can I use margin trading in the derivative segment?
Most brokers do not offer margin trading facilities for trading in futures and options.
What will happen if I am unable to fulfil a margin call?
If you are unable to fulfil your margin call, then your broker will automatically square off your position.
What is the full form of MTF in the stock market?
MTF refers to “Margin Trading Facility”. It allows a trader to execute a trade without paying the full value of the trade; only a fixed percentage of the trade value is to be paid by the trader upfront.
Does every broker offer margin trading?
No, not every broker offers margin trading. Therefore, you need to check with your broker whether they offer this facility or not. Pocketful offers its users a margin trading facility.
How long can I hold a trading position made via margin trading?
The holding period depends on your broker policy, so compare the margin trading facility rules of various brokers before selecting a broker.
Trading is no longer limited to watching charts endlessly and relying on instincts. AI trading, or artificial intelligence trading, has changed the whole picture. In 2025, according to some reports, 57% of the cash market and more than 70% of F&O trades in India are now being done through algorithms. But still most of these algorithms are designed and coded by humans. What if we can use artificial intelligence to design trading strategies, code them and execute them too?
In this blog, we will learn what AI trading is, how it works and why it has become important for every trader to know about it.
What is AI Trading?
AI Trading, a specific type of algorithmic trading or automated trading, is the process of using artificial intelligence (AI) and machine learning techniques to identify trends, interpret data, and execute trades automatically.
We all know about algorithmic trading, in which the computer software executes trades based on a predefined trading strategy. However, financial researchers spend countless hours searching for reliable trading patterns before they are coded and traded upon. AI trading solves this problem, as AI is used to interpret past market data and discover patterns for trading. AI is also useful in writing codes for trading strategies, which can be later changed a little by traders, saving significant amounts of time.
How AI Trading Works?
AI trading works in the following ways:
Data Collection : It all begins with the collection of large amounts of historical data such as prices, news, social media, order book, etc. AI systems can read tick-by-tick high-frequency data, allowing for accurate pattern recognition. Hence, the more data we have, the more accurate the strategy.
Pattern Recognition & Model Training : Machine Learning and Deep Learning models identify patterns using thousands of data points from the training dataset. Models are tested on past data through backtesting to determine the strategy’s potential. The results are then tested on a testing dataset to determine the accuracy of the ML algorithms. Predictive analytics make predictions such as when the price will rise or fall.
Coding of Strategy : After patterns are identified and tested, the next step is to translate them into a fully automated trading algorithm. This involves specifying clear entry and exit rules, position sizing, and risk management logic using languages like Python or R. The coded strategy is then connected to broker APIs for automatic order placement and real-time monitoring. By automating the rules, traders can achieve fast, consistent, and emotion-free execution.
Trade Execution : Now, whenever a pattern is observed in the live markets that matches our trading algorithm, the system automatically places an order in microseconds, allowing high-frequency trading (HFT). Smart order routing distributes orders across different exchanges based on liquidity.
Real‑Time Adaptation : The AI system monitors trading performance and changing market conditions and improves itself through reinforcement learning or logical adjustments. The system can be trained to monitor changes such as liquidity and market shifts and can adjust trading rules up to a specified extent in terms of risk reward ratio, position sizing, etc.
AI Trading vs. Traditional Trading
Feature
AI Trading
Traditional Trading
Speed
Decision-making and execution in microseconds, high-frequency trading possible
The time it takes to make trading decisions and place orders (seconds to minutes)
Accuracy
Data-driven models reduce the chance of errors
Based on human judgment, the possibility of wrong decision is high
Emotion
Completely emotion-free; factors like greed or fear do not come into play
Emotions like greed, fear and hope influence decisions
Scalability
Can execute thousands of trades simultaneously, able to handle big datasets
Only limited trades can be handled, dependent on human capability
Adaptability
Models can update themselves through reinforcement learning, according to changes in the market conditions
In every new situation, one has to think and take decisions manually
Use of Data
Makes decisions quickly by processing historical and real-time data
Limited data analysis; dependent on human understanding and experience
Consistency
Consistent performance based on rules
The quality of the decision is not the same every time
AI trading uses many modern technologies that are rapidly being adopted by professional traders in India. Below are the major AI technologies that are actively being used in India in 2025
1. Machine Learning (ML)
In Machine Learning, patterns are identified using historical data and then future stock price movements or trends are predicted with their help.
Companies like QuantInsti teach ML-based strategies and algorithmic systems which are used by many Indian proprietary trading firms to backtest and execute.
In a recent academic study, ML models such as Random Forest, LSTM, etc. trading on Reliance, TCS, HDFC Bank, etc. gave around 15% better returns than traditional trading strategies.
2. Deep Learning
Deep learning techniques, such as Deep Q-Networks and Proximal Policy Optimization (PPO) are particularly used to capture long-term dependencies of time-series data.
A 2024 research by IIT Delhi and BITS Pilani achieved 80% accuracy in stock price forecasting using LSTM models on historical intraday data of 180+ NSE stocks.
Some proprietary trading firms are using deep learning techniques to train their in-house models for real-time trading signal generation.
3. Natural Language Processing (NLP)
NLP is used to extract sentiment from financial news, earnings reports, and social media data, giving traders an indication of market mood.
NLP techniques can be used to generate sentiment indicators from financial news.
Bloomberg integrates advanced sentiment analysis into its terminal services, providing real-time sentiment scores for various assets. This enables traders to make informed, data-driven decisions rather than relying solely on intuition.
4. Predictive Analytics
It provides predictions for short-term or medium-term price movement based on historical data, technical indicators, and external signals.
AI models and their role in trading
AI Technology
Role in trading
Machine Learning
Price prediction, strategy optimization
Deep Learning
Complex data analysis, pattern detection
NLP
News/event-driven trading
Predictive Analytics
Trend forecasting, signal generation
Benefits of AI Trading
AI trading has completely changed the trading landscape. Now the majority of trading on exchanges are not based on emotions or guesses, but on real-time data, machine learning models and automated algorithms. This not only makes trading decisions more accurate but also saves time and effort.
Speed and automation : AI trading bots can generate and execute signals in milliseconds, not seconds. This kind of speed is far ahead of human capabilities, giving traders a huge advantage in strategies like arbitrage, scalping and high-frequency trading.
Data-driven decisions : AI algorithms simultaneously analyze millions of historical and live data points such as price movements, volume, news, social media sentiment and technical indicators. This makes trading decisions more informed and bias-free.
Emotion-free decision making : Human traders often make wrong decisions due to greed, fear or overconfidence. On the other hand, AI systems run on a predetermined trading logic and strategy, which maintains consistency and discipline.
24×7 operations : AI does not get tired and does not take breaks, making this technology especially useful in markets that remain open 24 hours a day, such as crypto. These bots respond immediately to signals and prevent missed opportunities.
Scalability and efficiency : The biggest advantage of AI is that it can manage a large number of trades in a short time. Even if it has to manage a hundred trades at once, there is no decrease in performance and accuracy – which is not possible for any human.
The use of AI and machine learning is increasing rapidly in the stock market, but this does not mean that these systems guarantee profits. The market conditions change every day, and no matter how powerful the technology is, some limitations always remain. Below are some important risks that every trader should be aware of:
Market behavior is not always predictable : The AI system tries to understand the pattern based on historical data, but in the real market, many times there are price movements that cannot be predicted due to a sudden political decision, economic crisis or any big news – the impact of all these can be so fast that the AI models can fail to adjust quickly.
Wrong or incomplete data can cause loss : The strength of AI trading rests on the accuracy of the historical data on which it has been trained. If the data itself is outdated, incomplete or biased, then the trades made on this basis can go in the wrong direction, resulting in losses.
Some models are good only “in theory” : It has often been observed that some AI models show good results in the training phase, but when applied in the real market, they do not perform as expected. This is called ‘overfitting’, which is a big risk for trading strategies.
Technical problems can become a hindrance at any time : AI trading is completely dependent on automation and API systems. A slight server error, network slowdown or software bug – all these can cause huge losses in a second. Especially when trading is at a high frequency.
Understanding of rules and regulations is important : The rules related to trading in India are very clear and are set by regulatory bodies like SEBI. If an AI-based system accidentally adopts a trading strategy that is against these rules, then legal problems may arise.
In the coming years, India’s stock market is going to see tremendous integration of technology. Around 60% of trading orders on NSE are being done through algorithmic systems, many of which are now based on AI and machine learning models.
SEBI’s regulatory guidelines : SEBI has made it clear that any trading strategy that generates automatic orders above a certain threshold cannot be used without exchange approval. Also, it is also necessary to maintain proper trading records for audit purposes.
Use of AI trading by retail traders : Earlier this facility was limited to only large institutional investors. But now retail investors are also able to create their own AI-based trading strategies with the help of API tools, making AI trading now available to common users as well.
Role of Trading API : Facilities such as Pocketful API provide low-latency trading APIs to both retail and professional traders. This allows developers to create their own custom AI models using real-time data to analyze data, code strategies and then use trading APIs to place orders.
Today’s trading is no longer limited to just placing manual orders. Now automation, data analytics and API integration play a big role in it. The market is rapidly moving towards AI trading, where smart trading systems and custom algorithms are making decisions faster and more accurately compared to humans. Therefore, now is the time to adopt this new form of trading, where efficiency and data together give better results. It is advised to consult a financial advisor before trading.
S.NO.
Check Out These Interesting Posts You Might Enjoy!
Everyone wants to make profits in the stock market, but only those who know how to make the right decisions at the right time consistently become the best traders in the world. Success in trading does not depend only on statistics or luck, but on experience, discipline and understanding.
In this blog, we are going to tell you about the world’s best traders, how they created history and why they are still considered top traders in the world. If you also wonder who is the best trader in the world, then this blog is for you.
⭐ Quick Answer: Who Is the Best Trader in the World?
There is no single “No. 1 trader” globally, but Jesse Livermore, George Soros, Jim Simons, and Paul Tudor Jones are widely considered among the greatest because of their historic trades, exceptional returns, and long-term influence on global markets.
Top 10 Best Traders in The World
Every trader dreams of being successful in the stock market, but in history there have been only a few people who have influenced the market with their thinking, strategy and decisions. Below we will talk about those legends, who are still considered the best traders in the world and from their trading journey, we can learn something or the other.
Trader Name
Country
Era/Active Years
Type of Trading
Famous Trade / Achievement
Jesse Livermore
USA
1900–1940
Stock Trading
Shorted the 1929 market crash and made millions
George Soros
Hungary/UK
1960–2000s
Currency, Macro Trading
“Broke the Bank of England” by shorting the pound in 1992
Paul Tudor Jones
USA
1976-present (potentially active)
Futures, Macro
Predicted and profited from the 1987 stock market crash
Jim Simons
USA
1938-2024
Quantitative Trading
Founded Renaissance Technologies, one of the most successful quant funds
Richard Dennis
USA
1970 – 1988
Commodity, Macro
Turned $1,600 into $200 million; created the famous “Turtle Traders”
Nicolas Darvas
USA
1957–1959
Stock Trading
Developed the “Darvas Box Theory”; made $2 million using it
John Paulson
USA
Around 1994 – 2019
Hedge Funds
Made ~$4 billion betting against subprime mortgages in 2008
Stanley Druckenmiller
USA
1980s–2010s
Macro / Long-Short Equity
Worked with Soros on the 1992 pound trade; consistent double-digit returns
Ed Seykota
USA
1970s – Present
Algorithmic / Trend Following
Pioneer in computerized trading systems
Michael Burry
USA
2000 – Present (Possibly Active)
Deep Value Trading
Predicted and profited from the 2008 housing market crash
An overview of the trading journey of these traders has been given below:
1. Jesse Livermore
Detail
Information
Name
Jesse Lauriston Livermore
Born
July 26, 1877 – Shrewsbury, Massachusetts, USA
Known For
Earned massive profit ( $100 million) during the 1929 crash
Peak Net Worth
Approximately $100 million (in 1929)
Jesse Livermore is often called “The Great Bear of Wall Street.” He began his trading career as a bookkeeper at age 14, and soon began trading in bucket shops (informal stock betting shops). He became so skilled that he had to enter the real New York stock market because most bucket shops banned him.
He made and lost money at times, but his strategies during the Great Depression of 1907 and especially 1929 made him a major name in trading history. In the 1929 market crash, he shorted the market and profited over $100 million, equivalent to billions of dollars today.
His trading success was based on trading psychology, trend analysis, and risk control. Although his personal life was tumultuous and he committed suicide in 1940, lessons learned from his trading career are still taught today.
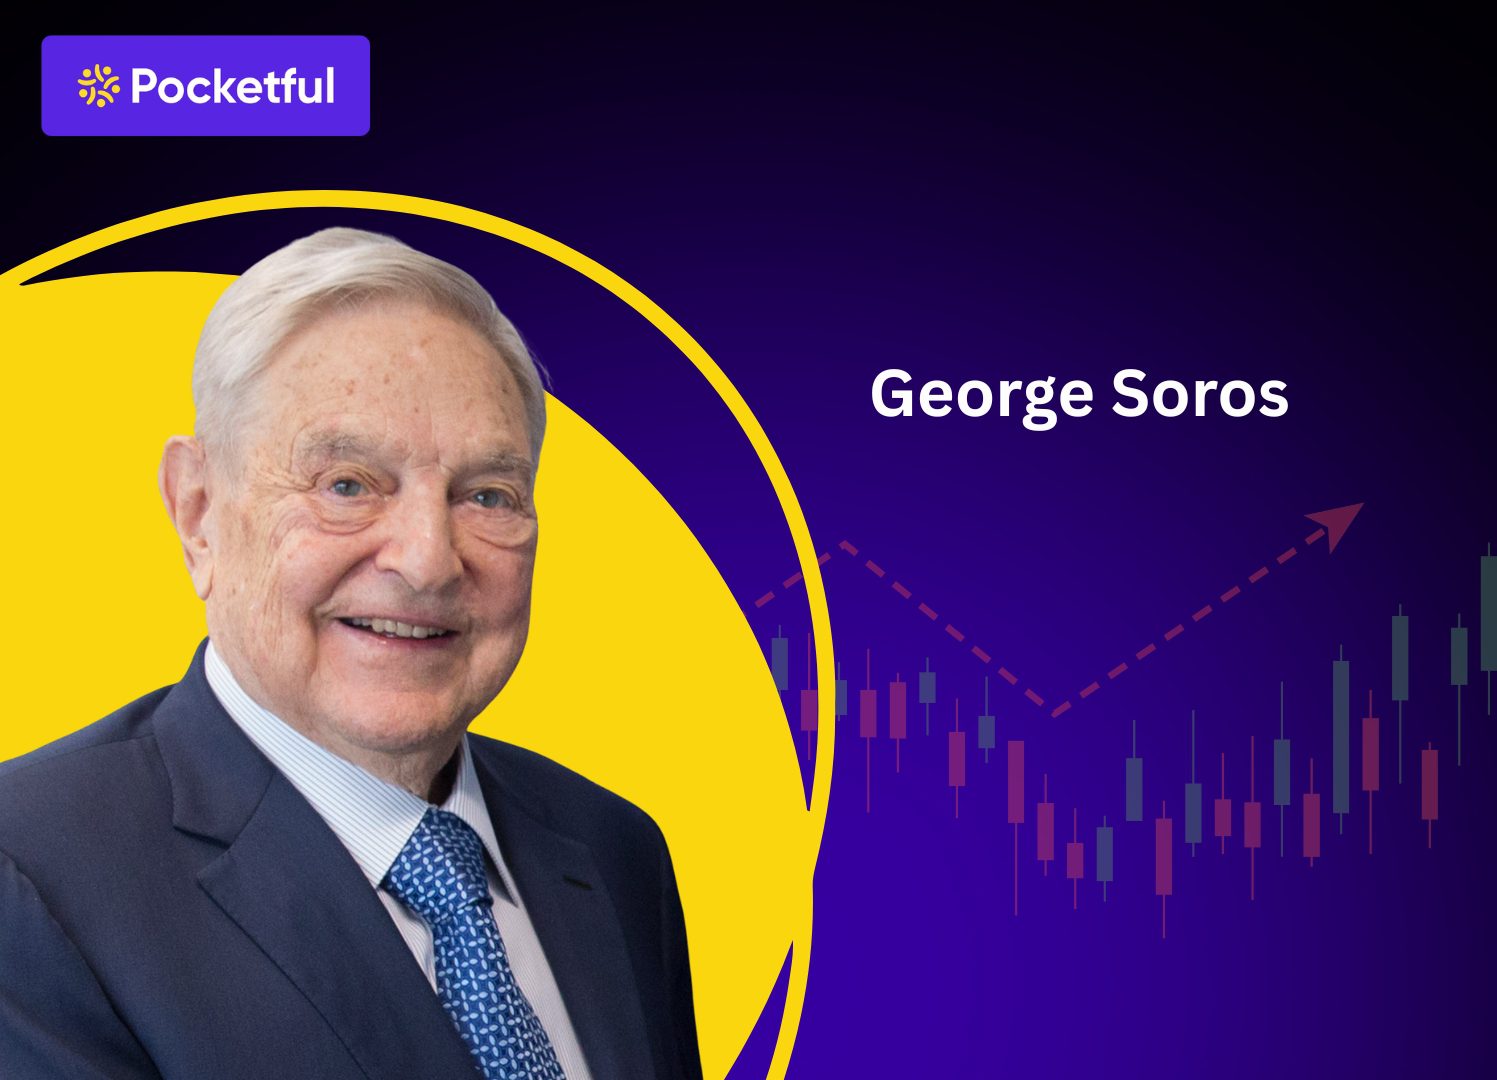
2. George Soros
Detail
Information
Name
George Soros
Born
August 12, 1930 – Budapest, Hungary
Known For
Known as “The Man Who Broke the Bank of England” in 1992
Peak Net Worth
Estimated over $8.6 billion (as of 2024)
George Soros is considered one of the world’s most influential traders. He began his trading career in the 1950s and gradually rose as a fund manager and then a legendary investor. In 1992, he took a large short position against the British pound and made a profit of almost $1 billion; this is why he is called “The Man Who Broke the Bank of England”.
Soros’ trading was characterized by macro-level strategy, that is, he traded by analyzing global economic and political trends. He founded the Quantum Fund, which gave unprecedented returns for many years. His book The Alchemy of Finance is still read by traders and investors today.
Although Soros is not involved in active trading these days, his thinking, his strategies and his influence are still seen in the market. He has not only been a successful trader, but also funds many social and human rights projects around the world, which makes him more than just an investor.
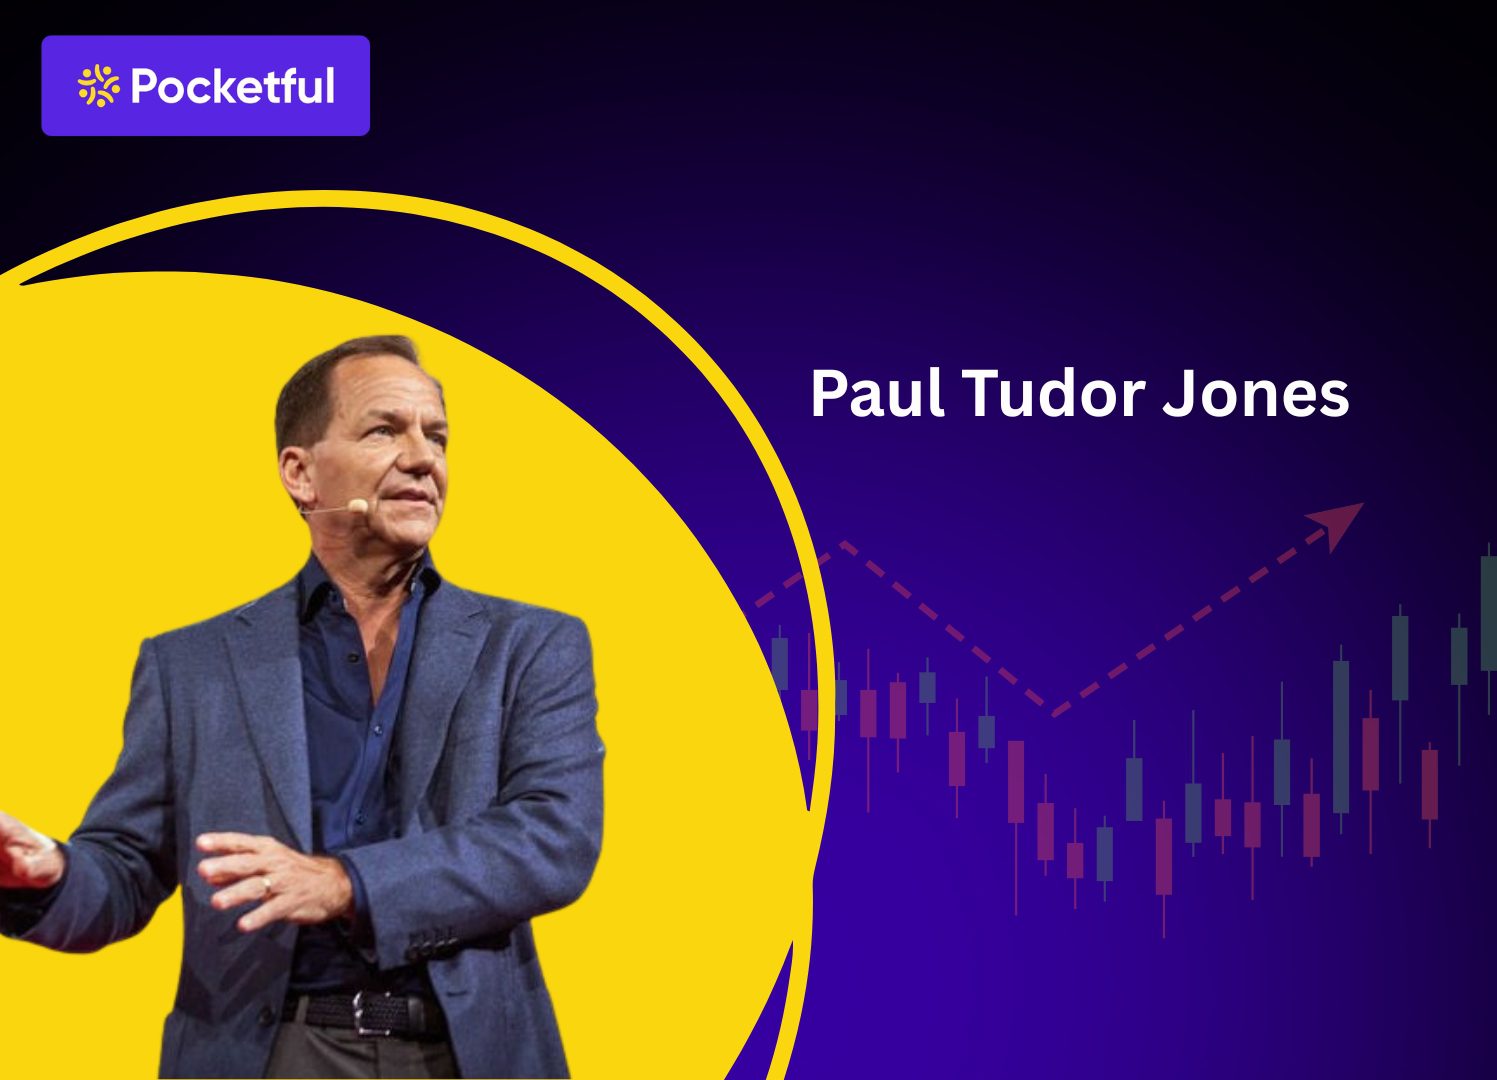
3. Paul Tudor Jones
Detail
Information
Name
Paul Tudor Jones
Born
September 28, 1954 Memphis, Tennessee, USA
Known For
Predicted and profited from the 1987 stock market crash
Peak Net Worth
Over $7.5 billion (as per recent estimates)
Paul Tudor Jones is one of the few traders in the world who not only predicted the historic stock market crash of 1987 but also made profits worth millions of dollars from it. He is a highly disciplined and technical-analysis based trader who believes in patterns and risk control more than emotions.
His greatest strength is a deep understanding of market psychology and taking bold decisions at the right time. He started Tudor Investment Corporation in 1980, which is still a strong name in the hedge fund industry.
Paul’s trading mantra has been – “Protect capital first, profit comes second.” His risk management strategies and short-term trading style have earned him a place in the list of top traders in the world.
Even though he trades less today, his influence remains in hedge funds, trading education and philanthropy. He is known for teaching market discipline and long-term consistency to new traders.
4. Jim Simons
Detail
Information
Name
Jim Simons
Born
April 25, 1938 Newton, Massachusetts, USA
Known For
Founder of Renaissance Technologies; pioneer of quantitative trading
Peak Net Worth
Approx. $30 billion (Forbes, latest estimates)
Jim Simons is often called the “quant king” because he demonstrated the power of mathematics and algorithms in trading. He was a professor and cryptographer who later entered the stock market and founded Renaissance Technologies in 1982.
His hedge funds, especially Medallion Fund, remains an inspiration in the trading world because it delivered more than 60% on an average for years without much public exposure. Jim completely transformed the traditional trading approach. He relied on data, code and patterns instead of emotions, news or intuition. That’s why he is considered one of the world’s best traders even though he never called himself a trader, but a scientist.
5. Richard Dennis
Detail
Information
Name
Richard Dennis
Born
January 1949 Chicago, USA
Known For
“Prince of the Pit”; Pioneer of trend-following strategies
Peak Net Worth
Estimated over $200 million at peak (early 1980s)
Richard Dennis is known as the “Prince of the Pit” in the trading world. He started trading with just $1,600 and within a few years, he grew his trading to $200 million that too in the futures market alone. Dennis believed that trading can be learned, and with this thought in mind, he started the Turtle Trading Experiment in the 1980s.
In this experiment, he selected some ordinary people and taught them the trend-following system and the results proved that with the right system and discipline, anyone can become a big trader. This is the reason why he is still considered one of the best traders in the world.
Richard Dennis’ trading philosophy was very simple: catch the trend and follow the rules. He adopted a strictly mechanical approach by minimizing human emotion.
Even today, Dennis’ strategies and Turtle Trading rules are considered a blueprint for new traders. He not only made money himself, but also gave birth to many more successful traders. This is what makes him a legendary trader.
6. Nicolas Darvas
Detail
Information
Name
Nicolas Darvas
Born
1920 Hungary
Known For
Inventor of the “Darvas Box Theory” in stock trading
Peak Net Worth
Turned $10,000 into over $2 million in ~18 months (1957–1959)
Nicolas Darvas was a professional dancer who traveled the world performing on stage, but he earned millions of dollars in the stock market through his strategy and discipline. He adopted a self-taught investing approach and earned fame through his iconic strategy “Darvas Box Theory”.
Darvas only invested in stocks that were hitting new highs and had strong volume support. He based his strategy on price and volume action, not news or analyst reports. He explained his entire journey in his famous book “How I Made $2,000,000 in the Stock Market”, which is still considered a classic for traders today.
What made him special was that he made smart investing decisions even when he was physically away from the market – he used to make decisions through telegrams and price charts. A disciplined approach and clear entry-exit rules were the soul of his trading style.
Nicolas Darvas is considered a trend-following legend and an early contributor to modern technical analysis.
7. John Paulson
Detail
Information
Name
John Alfred Paulson
Born
December 14, 1955 Queens, New York, USA
Known For
Historic profit from 2008 subprime mortgage crisis
Peak Net Worth
Estimated over $4 billion (as of peak post-2008)
John Paulson is listed as the world’s best trader because he made one of the biggest and most talked about trades in history during the 2008 global financial crisis. He anticipated the housing market crash and made a profit of nearly $4 billion by betting against subprime mortgage bonds.
Paulson made this trade through his investment firm Paulson & Co., and the move is still known as “The Greatest Trade Ever.” This one trade made him an iconic figure in the world of trading and hedge funds. His strategy involved deep research, contrarian thinking and calculated risk taking. When everyone was bullish in the market, he identified a downturn that was his edge.
Although many of his trades in later years were not as successful, his 2008 trade remains a masterclass for investors today on how to understand macroeconomic trends and take advantage of them. John Paulson’s name still ranks among the top traders in the world, especially among those who want to understand big-picture thinking and bold decision-making.
8. Stanley Druckenmiller
Detail
Information
Name
Stanley Druckenmiller
Born
1953 – Pittsburgh, Pennsylvania, USA
Known For
Ex-Chief Strategist for George Soros’s Quantum Fund
Peak Net Worth
$6.4 Billion+ (as of 2025)
Stanley Druckenmiller is one of the world’s most successful macro traders, who makes big trades by understanding the global economic trends. He started his career in 1977, but he got real recognition when he, along with George Soros, traded against the Bank of England in 1992 and earned a profit of more than $1 Billion. This trade cemented his legacy in global finance.
Stanley ran his own hedge fund company named Duquesne Capital, which he managed from 1981 to 2010 – and surprisingly, not a single year in his 29-year career went into loss. He is known for his deep research, discipline and instinctive decision-making. His trading philosophy is based on “Preserve capital and wait for the right moment”. That is, keep the capital safe and trade only when the conviction is highest.
9. Ed Seykota
Detail
Information
Name
Ed Seykota
Born
1946 – Netherlands (raised in the U.S.)
Known For
Pioneer of computerized trading systems
Peak Net Worth
Not publicly disclosed (multi-millionaire)
Ed Seykota is known in the stock market world as a legendary trend-following trader who started using computerized trading systems in the 1970s when the concept was still new. He was one of the first people to try to track price trends using technical indicators and algorithms.
Ed began building his own trading systems on early IBM computers while working at a commodity brokerage firm. The result? He grew his client accounts from $5,000 to $15 million in a few years all with rules-based trading. His philosophy is based on a simple but powerful mantra:
“The trend is your friend until the end when it bends.” Ed Seykota is not just a trader, but also a philosopher of trading. He also laid great emphasis on trading psychology and explained that a trader’s success has less to do with his system and more with his mental discipline.
10. Michael Burry
Detail
Information
Name
Dr. Michael Burry
Born
June 19, 1971 San Jose, California, USA
Known For
Predicted and profited from 2008 U.S. housing market crash
Peak Net Worth
$300 Million (as per latest available public sources)
Michael Burry was among the first to identify the 2008 housing market crash and made huge profits by taking a short position against it. He is the founder of hedge fund Scion Capital and is known worldwide as an unconventional thinker. His story was shown in the popular 2015 film “The Big Short”, in which Christian Bale played his character.
Burry did not come from a traditional finance background but entered finance after graduating as a doctor, but his analytical and deep research skills gave him a different identity in the market. He identified the weaknesses of subprime mortgages in the US housing bubble and earned billions of dollars by betting against mortgage-backed securities.
His investing approach is quite contrarian and deep-value oriented. He often invests in stocks that are undervalued and which the market is ignoring. Even today Burry remains in the news on social media for his bold opinions and sharp market insights.
Michael Burry is rightly called one of the most visionary traders in the world.
Below are some of the characteristics or qualities that makes a top trader:
Risk Management is Non-Negotiable : The biggest characteristic of every successful trader is his risk management skill. No matter how good the setup, no trade can be profitable without a proper stop-loss and position sizing. Prominent traders always give priority to capital preservation.
Mastering Trading Psychology : Success in the market is not achieved only by mastering charts and numbers, but controlling your emotions is essential. Fear, greed, and overconfidence – managing all these is the real identity of a pro trader.
Combination of Strategy and Discipline : Every top trader has his own tested and refined trading strategy: be it trend following, arbitrage or price action. But the strategy works only when it is accompanied by discipline.
Adaptability to Market Conditions : The market conditions are never static, and it is important to adapt to it. Great traders constantly adapt their approach whether it’s the 2008 crash or the 2020 pandemic rally; adaptiveness is what sets them apart from the crowd.
It’s Beyond Just Stocks : Top traders not only specialize in equities, but also have diversified exposure to forex, commodities, and now even crypto. This versatility makes their trading approach truly global and well-rounded.
Patience and Timing : Successful traders know when not to trade. They wait for high-probability setups rather than chasing every move. Patience often separates consistent winners from emotional traders.
Continuous Learning and Research : Markets evolve every day. The best traders never stop learning – they constantly read, backtest, analyze, and refine their strategies. Continuous learning helps them stay ahead of new trends, tools, and technologies.
Data-Driven Decision Making : Top traders rely on facts, statistics, and probabilities rather than opinions or rumors. Whether it’s quantitative models or technical setups, every trade is backed by solid reasoning.
The story of every successful trader teaches us that trading is not just a game of charts and figures, but a process of patience, discipline and continuous learning. From these great traders, we can understand that with the right mindset and strategy, anyone can become a successful trader. If you also want to make a career in trading, then learning from their experiences and making your own rules to trade should be the first step.
S.NO.
Check Out These Interesting Posts You Might Enjoy!
People consider George Soros, Jim Simons and Paul Tudor Jones as some of the most successful traders.
Who is the No. 1 trader in the world?
There is no official ranking, but names like Jesse Livermore, Jim Simons, and George Soros are widely considered among the greatest.
Is Warren Buffett a trader or an investor?
Warren Buffet is a long-term value investor, not a trader.
Which is the most important skill to become a good trader?
Risk management and position sizing are the two most important skills to become a successful trader.
What can we learn from top traders in the world?
Patience, risk management, and trusting your own strategy.
Is trading better than investing?
Trading is good for short term profits while investing helps in building long term wealth. The choice depends on your skills, financial goals and risk profile.
Who is called the greatest trader in history?
Jesse Livermore is often called “The Great Bear of Wall Street” for his legendary 1929 short trade.
Can anyone become a top trader?
Yes, success depends on discipline, risk control, and consistent learning.
Who is the most successful stock trader of all time?
Jim Simons is often considered the most successful due to the long-term performance of the Medallion Fund.
Trading isn’t just about taking advantage of price fluctuations by buying or selling shares. Especially when you deal with commodities or indices, you’ll come across two key instruments, known as futures and options.
At first glance, these two might look the same. But in nature and in how their value changes, they are quite different. So, now the question is, what is the difference between futures and options?
In this blog, we will discuss the difference between futures and options and their features.
Understanding Options and Its Features
Options are derivative contracts and these give you the right, but not the obligation, to buy or sell an asset at a specific price. This asset can be stocks, commodities, or indices. You can buy or sell it at a fixed price called the strike price. You have to use this right within a certain time period. To obtain this right, you pay a fee called the premium.
There are two types of options, which are:
Call Option: It gives you the right, but not the obligation, to buy the asset at a fixed price. Say, you buy a call option with a ₹100 strike price. Now the stock rises to ₹120. Here, you can exercise your call option to buy at ₹100 and make a profit.
Put Option: It gives you the right, but not the obligation, to sell an asset at a fixed price. For example, if you buy a put option with a ₹100 strike price. Now, the stock falls to ₹80,you can exercise your put option to sell at ₹100 and make a profit.
Features of Options
Some of the features of options are listed below:
1. Right Without Obligation
Options give the buyer the right to buy or sell the underlying asset. Remember, it is not the obligation to buy or sell the underlying asset at a fixed price within a set timeframe.
2. Premium-Based Contract
The buyer pays a premium to the seller (writer) for this right. Premium is the maximum loss for the buyer. For the seller, it is the maximum profit if the option expires worthless, but risk can be much higher.
3. Defined Risk and Unlimited Reward (for Buyer)
Buyers can only lose the premium, but their potential gain is theoretically unlimited (in the case of calls) or substantial (in puts).
4. Obligation on Seller
The seller must honor the contract if the buyer chooses to exercise the option. This exposes the seller to significant risk, especially in uncovered positions.
5. Contract Size (Lot Size)
Options are traded in fixed lot sizes, which vary depending on the underlying asset (e.g., 25 shares for some stock options in India). This determines the total premium of the contract.
6. Strike Price
This is the pre-decided price at which the option buyer can exercise the option. It directly impacts profitability and intrinsic value.
7. Intrinsic and Time Value
An option’s price (premium) consists of:
Intrinsic Value: The real, in-the-money value.
Time Value: The extra value due to time left until expiry and expected volatility.
8. Expiry Date
Every option has a specific expiry date, post which it becomes invalid. This could be weekly, monthly, etc.
9. American vs. European Options
American Options: Can be exercised any time before expiry.
European Options: Can only be exercised on the expiry date (common in India for index options).
10. Used for Hedging and Speculation
Options serve multiple purposes such as:
Hedging: Options can be used to protect an existing portfolio.
Speculation: Options can be used to bet on directional movement.
A futures contract is a standardized derivative contract, which defines terms for buying or selling an asset at a predetermined price on a specific date in the future. The underlying asset can be a commodity, currency, stock, or index.
Unlike options, futures come with a clear obligation. Both the buyer and the seller must honour the contract, no matter what the market price is at the time of expiry. So, whether the price goes up or down, the contract has to be honored.
The best example of this is a farmer who agrees to sell wheat at ₹2,000 per quintal after 3 months. Even if market prices change, both buyer and seller must honor the deal. It ensures price certainty but involves risk as the price of the underlying asset may move against your position. These are traded on organized exchanges, ensuring transparency and easy access.
Features of Futures
1. Standardization
Futures contracts are standardized contracts with terms such as the quantity, quality, and delivery date of the underlying asset pre-determined.
2. Exchange-Traded
All futures contracts are traded on regulated exchanges. This ensures transparency. Also, since the futures contracts are accessible to all, there is more liquidity.
3. Obligation to Buy/Sell
Both the buyer and the seller must fulfill their obligation based on the futures contract specifications. The futures contract can either be settled through physical delivery of underlying assets or via cash settlement.
4. Margin Requirements
Traders must deposit an initial margin. It is important to maintain a minimum balance (maintenance margin) as collateral to hold on to your trading positions.
5. Leverage
Futures contracts allow traders to make a relatively large trading position with a small amount of money, known as margin. This helps increase potential profits, but also magnifies losses.
6. Mark-to-Market Settlement
Profits and losses are settled daily. The value of your trading position is adjusted at the end of every trading day to reflect the current market price.
7. Hedging and Speculation
Futures can be used by hedgers to protect their investment portfolios against adverse price fluctuations. Futures contracts can also be used by speculators to profit from price movements.
8. Expiration Date
Every futures contract has a set expiration date. This is the date on which the contract must be settled, either by delivery of underlying assets or by cash.
9. Settlement Options
Contracts can be settled by physical delivery of the asset or by cash settlement. It is based on the contract specifications.
10. Liquidity and Price Transparency
Futures markets are highly liquid and are traded on the exchanges. This ensures efficient price discovery and easy entry/exit for traders.
Key Differences Between Futures and Options You Should Know
Till now, you know what the difference is between futures and options at large. But do you need to focus on all while investing? Well, yes, but there are some that hold more importance. These are:
1. Liquidity
Futures are generally more liquid than options.
At a given time, there can be only three to four futures contracts with different expiries available for trading, due to which they have higher volumes. On the other hand, there can be dozens of options contracts of the same asset with different strike prices, This makes futures more suitable for intraday traders who need fast execution and minimal price slippage.
2. Price Movement
Prices of Futures contracts move more quickly compared to options contracts.
Futures contracts mirror real-time price changes in the underlying asset. On the other hand, options react more slowly because their price sensitivity (delta) is usually less than 1. This is because multiple factors, such as time value, delta, and volatility influence them. Out-of-the-money options, in particular, tend to show smaller price changes.
3. Capital Risk and Time Decay
Options, when compared to futures, lose value over time due to time decay.
With options, the premium you pay reduces as the expiry date nears. This is called time decay. That means even if the market moves in your favor, your option might lose value daily. Futures don’t suffer from time decay but carry higher risk due to compulsory execution.
Understanding the difference between futures and options is key to becoming a smart trader. While both are derivative contracts, they serve different needs. Futures come with an obligation to buy or sell and are preferred for their liquidity. Options, on the other hand, provide an opportunity to speculate with limited risk.
So, what is the difference between futures and options in simple terms? Futures require compulsory execution, while options give you the right but not the obligation. That’s the core of it. Remember, the choice between futures and options is all about risk management and your trading strategy.
To make your trading journey smoother, platforms like Pocketful offer the right technical tools to analyze market movements. So, open a trading and demat account today and start your trading journey.
S.NO.
Check Out These Interesting Posts You Might Enjoy!
What is the main difference between futures and options?
The main difference lies in obligation. Futures require both the buyer and the seller to honor the terms of the contract on the predetermined date, while options give the buyer the right but not the obligation to buy or sell an asset.
Which is safer for beginners: futures or options?
Options are generally safer for beginners because the maximum loss is limited to the premium paid for option buyers. Futures involve higher risk as losses can be unlimited if the market moves against your position.
Can I trade futures and options with small capital?
You can trade futures and options with a small capital as futures require a small margin while options require the full premium payment upfront to create a position.
Are futures and options available for all stocks?
No, only selected stocks that meet exchange criteria (like market cap, liquidity, and volume) have futures and options available for trading. You can check the approved F&O stock list on the NSE or the broker’s website.
What is the risk involved in futures and options trading?
Futures involve high risk as both parties must honor the contract, which can lead to unlimited losses if the market moves against your trading position. Options carry limited risk for buyers (only the premium paid), but sellers may face larger losses. Proper trading strategy and risk control are crucial in both cases.
Imagine being able to buy stocks worth more than the capital you currently hold! MTF is a facility that you can use to magnify your returns using little capital. Consider it as a short-term loan from your stockbroker, where you as an investor will have to pay a small proportion of the total investment amount and the broker helps cover the rest.
However, it is necessary to find brokers that offer MTF at reasonable interest rates as interest charged on the amount availed via MTF can reduce investment returns. In this blog, we will give you a list of brokers that provide MTF at lowest interest rates.
Understanding Margin Trading Facility (MTF)
MTF is a service offered by brokers through which they lend money to investors or traders and charge interest in return. This interest rate associated with the loan taken via MTF is known as MTF interest rate and brokers usually charge a daily fee on the amount funded.
It is crucial to select the broker that offers MTF at a low interest rate as it can impact your profit as well as the losses, if you keep the position open for weeks or months. Low MTF interest rates help reduce trading costs; thereby increasing profitability. Now lets look at the top 10 brokers with the lowest MTF rates in India.
Top 10 Brokers Offering the Lowest MTF Interest Rates in India (Comparison Table)
Broker
MTF Interest Rates
Per Day charges per Lakh
Pocketful
Starts from 0.0164% per day (5.99% p.a.) for amounts up to ₹1,00,000, varies based on funded amount.
₹16.4
Zerodha
0.04% per day (14.6% p.a.)
₹40
ICICI Direct
0.026% to 0.049% per day (9.69% to 17.99% p.a), varies based on brokerage plans
₹26 to ₹49
Groww
0.041% per day (14.95% p.a.)
₹41
Kotak Securities
0.026% per day (9.75% p.a.), varies based on brokerage plans
₹26
mStock
MTF interest rates are slab based Above ₹5 crores : 0.0192% per day Above ₹25 lakh to ₹5 crore : 0.0274% per day Up to ₹25 lakh : 0.0411% per day
₹41
Paytm Money
0.026% to 0.041% per day (9.75% to 14.99% p.a.) – varies based on slab
₹26
5paisa
0.045% per day (16.425% p.a.)
₹45
Dhan
0.034% to 0.045% per day (12.49% to 16.49% p.a.) varies based on Gross Holdings
₹34
Angel One
0.041% per day (14.99% p.a.)
₹41
Alice Blue
0.049% per day (18% p.a.) on the funded amount.
₹49
Arihant Capital
0.05% per day (18% p.a.) on outstanding debit for MTF positions.
₹50
Mirae Asset Sharekhan
Up to 18% p.a. interest on MTF facility balance (standard rate) per terms.
₹49
HDFC Securities
12% p.a. interest for their “Buy Stocks Pay Later / MTF” offering.
₹33
Lemonn
0.0273% per day (10.95% p.a.) interest rate.
₹30
Overview of Top 10 Brokers with the Lowest MTF Rates in India
1. Pocketful
Pocketful is an emerging stock broking firm and is a subsidiary of Pace Stock Broking Services. It is a growing and well trusted platform which provides a modern trading experience to the users. It has been developed by professionals with more than 27 years of experience and offers free equity delivery and zero account opening fees, making it the best option for both traders and investors.
MTF Interest Rate: Currently, they are offering the lowest MTF interest rate in the stock market, starting at just 5.99% p.a. which means per day rate of 0.0164% on borrowed funds up to ₹1,00,000. For funded amounts between ₹1,00,001 and ₹25,00,000, the MTF interest rate is 14.60% p.a. (0.040% per day) and for funded amounts above ₹25,00,000, the MTF interest rate is 16% p.a (0.0438% per day)
It is one of the largest discount brokers in India, which charges low brokerage and consists of an advanced trading platform called Kite. Many traders in India begin their stock market journey with Zerodha, which has revolutionized online investing through its easy-to-use platforms.
MTF Interest Rate: Unlike Pocketful, Zerodha charges a daily interest of 0.04% on borrowed funds, i.e. an annual interest rate of 14.6%.
3. ICICI Direct
It is one of the best suited platforms for investors looking for a 3-in-1 account as it provides demat, trading and banking services to the customers. Backed by ICICI Bank it provides secure and comprehensive financial services.
MTF Interest Rate: Borrowing costs or MTF interest rates vary depending upon the brokerage plan. The brokerage plan can cost as low as 9.69% per annum for some plans, while other plans can charge up to 17.99% per annum.
4. Groww
Groww has a user friendly trading app with exceptional user interface, making trading easier for beginners as well as the advanced traders. It has a vast customer base and offers real time market data, advanced charts for you to make informed trading decisions.
MTF Interest Rate: An annual charge of 14.95% per annum is charged that roughly translates to 0.41% per day charge on the funded amount.
5. Kotak Securities
A prominent market player which has been around for many years, backed by the Kotak Mahindra Group. Investors often pick them for their in-depth research reports and personalized advisory services. The platform feels easy-to-use whether you’re a beginner or a seasoned trader.
MTF Interest Rate: Under the Trade Free Pro plan, margin funds cost roughly 9.75% per year, which makes them appealing to anyone who wants to borrow money without giving up too much in interest.
6. mStock
m.Stock is a next-generation stockbroking platform backed by Mirae Asset Financial Group, bringing global financial expertise to Indian investors. Trusted by 22 lakh+ users, it offers a secure and powerful trading ecosystem with equities, IPOs, mutual funds, F&O and ETFs available through advanced web and mobile platforms. Known for competitive pricing and cutting-edge tools, m.Stock has quickly become a leading name in India’s discount brokerage space.
MTF Interest Rate: m.Stock follows a slab based system with 0.0411% per day up to ₹25 lakh, 0.0274% per day for ₹25 lakh to ₹5 crore, and 0.0192% per day above ₹5 crore.
7. Paytm Money
A digital platform to invest and trade, that is an integrated part of the wider Paytm ecosystem. New users like one-click mutual fund purchase and the chat-support built right into the app. Serious investors appreciate seamless trading and investing.
MTF Interest Rate: The broker recently switched to a slab based system, on book sizes up to 1 lakh, the rate is about 9.75% p.a. Borrowings between 1 lakh to 25 lakh range usually see a 14.99% per annum. However, if book size is above 25 lakh, then again the rate will come down to 9.75% p.a.
8. 5paisa
It is a budget-friendly stock broker that lets you trade cost-effectively but still offers a lot of features. It is perfect for active traders who want to keep costs down while putting in orders all day.
MTF Interest Rate: When it comes to Margin Trading Facility (MTF) money, the daily interest charge is 0.045% which roughly translates to 16.425%. It is slightly on the higher side and when you compare this with the Pocketful MTF rate, the difference is huge.
9. Dhan
It is a brokerage platform built using the latest technologies, integrated with advanced tools for traders. This trading ecosystem includes : Dhan mobile app, the web dashboard, and even integration with TradingView for an ultimate trading experience.
MTF Interest Rate: Interest on borrowed capital (MTF) is in 5 brackets. It starts at 12.49% a year, or nearly 0.034% per day, for an amount funded up to ₹5 lakh. From 5 Lakh to 10 Lakh, the interest rate is 13.49% p.a. The rate rises up as the funded amount increases. The highest rate is for the amount funded above 50 Lakh which is 16.49% p.a.
10. Angel One
Angel One has been around long enough to win the trust of traders, yet remains relevant due to continuous technical upgrades. The platform provides an easy to use mobile app and levies standard brokerage charges. On its platforms, one can easily hop between research reports, charts, and executed trades.
MTF Interest Rate: The daily interest charged is around 0.041% which constitutes to 14.99% in a year, which is pretty much on par with the market but definitely much higher than what is offered at Pocketful.
11. Alice Blue
Alice Blue is a popular brokerage known for its user-friendly platform ANT and competitive brokerage plans. It offers MTF to traders with a simple interface and real-time data.
MTF Interest Rate: Charges a daily interest of 0.049% on borrowed funds, i.e., an annual interest rate of 18%.
12. Arihant Capital
Arihant Capital is a full-service Indian broker with a wide range of services including its trading platform “ArihantPlus”. For its Margin Trading Facility (MTF) product, they allow clients to purchase approved stocks by paying a margin (typically around 22-40% depending on the stock) and borrowing the rest.
MTF Interest Rate: They charge interest at 0.05% per day on the outstanding borrowed amount (which translates to 18% p.a.) for MTF positions.
13. Mirae Asset Sharekhan
Mirae Asset Sharekhan is one of India’s leading brokers with a strong presence in retail and institutional trading, offering an intuitive platform for new and experienced traders.
MTF Interest Rate: Charges up to 0.0493% per day on borrowed funds, i.e., an annual interest rate of 18% (upper benchmark).
14. HDFC Securities
HDFC Securities provides a trusted trading platform with research-backed recommendations and multiple investment products, catering to both beginners and seasoned investors.
MTF Interest Rate: Charges a daily interest of 0.0329% on borrowed funds, i.e., an annual interest rate of 12%.
15. Lemon
Lemonn is a growing discount broker offering low brokerage and a simple, fast trading platform for retail traders entering the Indian markets.
MTF Interest Rate: Charges a daily interest of 0.0273% on borrowed funds, i.e., an annual interest rate of 10.95%.
Importance of Low MTF Interest Rates
Borrowing money in the stock market through Margin Trading Facility (MTF) can benefit traders with higher profits. And borrowing money with the lowest interest rate in the market is icing on the cake. Some of the key benefits of using MTF with low interest rate are:
Higher Profit Potential: Lower MTF interest rates can significantly boost your profits as lower interest rates help an investor reduce costs.
Useful in Rangebound Markets: Stock prices can remain rangebound for a long period before moving in your predicted direction. When the cost to borrow is cheap, you aren’t worried about borrowing costs and can patiently wait to realize profits.
Better Capital Efficiency: With reduced borrowing costs, traders can deploy capital more efficiently across multiple trades without worrying about high interest payments eating into returns.
Lower Break-even Threshold: A lower interest rate reduces the minimum price movement needed to cover costs, allowing traders to achieve profitability faster even with small price swings.
MTF: When to Tap the Borrowing Button, When to Hold Back?
Margin Trading Facility (MTF) lets you borrow funds so that you can increase your buying power. That extra firepower can pay off big, yet the same leverage can flip on you faster than you expect. Here are some of the drawbacks:
Risky for Beginners: MTF is not recommended for those new to the stock market. If you have just started trading , it is better to trade only with the money you have. Start with the basics and skip the borrowed cash aka MTF for now. Borrowing makes sense only after you have a good grasp of the risks that tag along.
Volatile Stocks: Using borrowed money to invest in highly volatile or high beta stocks is risky. These are stocks whose prices can swing dramatically both up and down. A sudden price drop could force you to sell at a significant loss, making it difficult for you to repay your MTF loan. Remember when using any kind of leverage, higher potential profits also mean higher potential losses.
Avoid MTF when you’re Uncertain: It is wise not to borrow if you are not fully confident in a company’s future performance, such as its future growth prospect or the success of a new product. In these situations, it’s often better to be patient and wait for more clarity. Also, one can buy using their own funds in such situations instead of using MTF.
Plan to hold for Long term: Margin trading facility, or MTF, probably isn’t your friend if you are a long term investor and want to hold stocks for years. The daily borrowing charges can pile up and reduce your gains.
As we all know leverage is like a double-edged sword, the funds borrowed using Margin Trading Facility (MTF) are no different. If used wisely, it has the potential to enhance your returns significantly, whereas if used carelessly can cause you huge losses. However, it is always recommended to select the broker that offers MTF at lowest rates.
Choosing a broker with the lowest MTF fee is crucial as a tiny difference in MTF interest rates can result in big savings down the road. Pocketful offers you MTF at lowest interest rate in the market, starting at just 5.99% p.a. You can open a demat account with Pocketful for free with zero AMC.
S.NO.
Check Out These Interesting Posts You Might Enjoy!
Which broker offers the lowest MTF interest rate in India?
Pocketful currently offers the lowest MTF interest rate starting at 5.99% p.a.
Which broker has the lowest MTF charges per day?
Pocketful has one of the lowest daily MTF costs at 0.0164% per day for up to ₹1 lakh funding.
What is a good MTF interest rate for traders?
A good rate is between 6%–10% p.a. Anything above 14–18% significantly increases cost.
How is MTF interest calculated and billed?
Most stock brokers calculate the MTF charges on a daily basis, which adds up until the position is closed. However, the MTF charges are deducted on a weekly basis usually.
What are the main costs associated with MTF besides the interest rate?
Apart from brokerage charges, it is important to check pledge and unpledge charges as the securities bought using MTF are automatically pledged and then unpledged when sold. Also, if your balance dips too low, some brokers automatically liquidate your position and may hit you with margin call penalties.
For how long can I hold shares bought using MTF?
Most brokers in India allow you to hold shares for an unlimited time period.
How Do I Pay Back the MTF Loan?
Repaying your MTF loan is an easy process. When you sell the shares that were bought using MTF, the broker deducts what you owe-plus any interest charges and then deposits the leftover cash into your trading account.
What should the traders do if there is a margin call?
Traders must deposit cash into their trading account quickly as most brokers give you less than a full day to fulfill the margin requirements. If delayed, the broker can start selling your stocks to cover the shortfall along with margin call penalty.
Navigating range-bound markets can be challenging, especially when it comes to identifying strategies that generate consistent profits. One such approach tailored for stagnant or sideways price movement is the short straddle. It is a popular strategy among experienced traders who believe a stock or index will not move much in the near future. But while it can generate attractive returns in range bound conditions, it also comes with unlimited risk if the market breaks out of its range.
In this blog, we will break down how a short straddle works, when to use it, what the profit/loss potential looks like, and help you understand it with an easy example.
What is a Short Straddle?
A short straddle is an options trading strategy that is used when you expect the market to stay flat, or not move much in either direction. It is a neutral strategy, meaning you are not betting on the price going up or down; instead, it will stay near the current level.
In a short straddle, you sell one call option and one put option with the same strike price and expiration date. You receive premiums from both short positions, which is your maximum possible profit if the market stays range bound. We will discuss the profit scenarios in a short while but let us first learn about the basic idea behind this strategy.
How does a Short Straddle Work?
The idea is simple – if the stock stays at the strike price until expiry, both options could expire worthless and you get to keep the premiums, which is your maximum gain.
However, if the price moves significantly up or down, the losses can significantly increase. There is no limit on how much you could lose, which makes this a high-risk strategy, best suited for experienced traders who can predict market conditions with some accuracy.
Before jumping into a short straddle, it is important to understand the key parts that make up the strategy. Here is what you need to know,
1. Strike Price
This is the price associated with the call and put options at which the options can be exercised or settled. In a short straddle, both options have the same strike price, ideally close to the current market price of the underlying asset or At the Money (ATM) options.
2. Premium Received
When you sell a call and a put, you collect premiums for both. These premiums are your maximum possible profit, but only if the price of the asset stays near the strike price until expiry.
3. Expiration Date
Both the call and put options in a short straddle must have the same expiry date. The closer you are to expiration, the faster the time value of the options erodes, which benefits the seller.
4. Implied Volatility (IV)
Short straddles work best when IV is high at the time of entry and is expected to fall. A drop in IV usually leads to a drop in option prices, which benefits the seller. But high IV also means higher risk, so timing matters.
Your maximum profit is limited to the total premium you collect from selling the call and the put. This happens only if the underlying asset stays exactly at the strike price on expiry. In that case, both options expire worthless, and you keep the full premium.
2. Maximum Loss
The loss potential is unlimited on the upside, i.e., if the asset price rises sharply and substantial on the downside as asset prices cannot go below 0. Since you have sold both a call and a put, any big move, up or down, can lead to big losses.
3. Breakeven Points
There are two break even points in a short straddle, one on each side of the strike price:
Upper Breakeven = Strike Price + Total Premium Received
Lower Breakeven = Strike Price – Total Premium Received
If the price of the underlying asset stays within this range, you make a profit. If it goes outside, the position starts losing money.
Example of Short Straddle
Suppose ABC stock is trading at ₹100, and you are predicting that it is going to stay around this level for the upcoming days. So, you decide to create a short straddle.
You will need to execute the following trades;
Sell 1 Call Option at ₹100 strike,
Suppose, Premium received = 6 points = ₹600, considering lot size to be 100
Sell 1 Put Option at ₹100 strike,
Premium received = 6 points = ₹600
Total Premium Collected = 6 + 6 = 12 = ₹1,200
Now let us consider three cases,
Case 1 : If the stock closes on ₹100 at expiry : The call and put both expire worthless and you keep the full ₹1,200 premium as profit, which is the maximum profit.
Case 2 : If the stock closes at ₹110 at expiry : Call is in the money and will be worth 10 points (110 – 100) or ₹1,000 at expiry, whereas put will expire worthless.
Call Position = Premium received – intrinsic value of call = ₹600 – ₹1,000 = -₹400
Put Position = Premium received – intrinsic value of put = ₹600 – ₹0 = ₹600
Net P/L = P&L from call + P&L from put = -₹400 + ₹600 = ₹200
Case 3 :If the stock closes at ₹85 at expiry : Put option is in the money and will be worth 15 points (100 – 85) or ₹1,500 at expiry, whereas the call expires worthless.
Call Position = Premium received – intrinsic value of call = ₹600 – ₹0 = ₹600
Put Position = Premium received – intrinsic value of put = ₹600 – ₹1,500 = -₹900
Net P/L = P&L from call + P&L from put = ₹600 – ₹900 = -₹300
A short straddle is useful in the following conditions:
1. When You Expect Low Volatility
If you believe the price of the stock or index will stay near its current level until expiry, a short straddle can generate good profits.
2. After a Volatility Spike
Selling a straddle when implied volatility (IV) is high and likely to fall can be smart because options premiums are inflated during periods of high IV, and you collect more upfront premium. If volatility drops, option prices fall, which is beneficial for the seller.
Advantages & Risks of Short Straddle
Advantages
1. High Premium Collection
You receive premiums from selling both call and put options. You can generate decent profits using this compared to many other strategies.
2. Profitable in a Range-Bound Market
If the stock stays within a range, especially near the strike price, the short straddle can be very effective. Time decay, which is also known as theta, works in your favour.
3. Simple Setup
It is a simple strategy. Same strike, same expiry, sell one call and one put. No need to manage multiple strikes or legs like that in iron condors or butterflies.
Risks
1. Unlimited Loss Potential
This is the biggest concern because if the stock makes a big move in either direction, losses can be steep. There is no upper limit on how much you could lose.
2. Requires Active Monitoring
You cannot simply create a short straddle and wait till expiry as it may be necessary to adjust the positions or exit the trading position if there is any global event.
3. High Margin Requirement
Because of the risk involved, brokers usually require you to keep a substantial margin amount in your trading account to execute this strategy.
A short straddle is a powerful options strategy when markets are expected to stay quiet, but risky when they are not. It is best used by experienced traders who are comfortable managing trades actively and have a good understanding of market behaviour. The unlimited risk on both sides means you need to be very confident in your market view, keep an eye on your position, and be ready to act if things start moving against you. Remember to always manage risk smartly, because when the market moves, it can move fast. It is advised to consult a financial advisor before trading.
S.NO.
Check Out These Interesting Posts You Might Enjoy!
It is most profitable when the underlying asset closes exactly at the strike price at expiry. In this scenario, both call and put expire worthless and you keep the full premium received at the beginning.
How do I know the breakeven points in a short straddle?
You calculate breakeven by adding (upper breakeven) and subtracting (lower breakeven) the total premium received from the strike price.
Can beginners use the short straddle?
It is generally not recommended for beginners because of the high risk and need for active management.
Can I close the short straddle before expiry?
Yes, you can close your position anytime before expiry to lock in profits or cut losses.
How much margin do I need for a short straddle?
Margins requirements can differ across brokers but tend to be high due to the unlimited risk involved.
Open Free Demat Account
Join Pocketful Now
You have successfully subscribed to the newsletter
There was an error while trying to send your request. Please try again.