Category: Trading

  • What is Trading? History, Trading Styles, and Trading vs Investing

    What is Trading? History, Trading Styles, and Trading vs Investing

    The main aim of trading and investment is to grow wealth. Although both participants’ strategies and tenure differ, they aim to increase their wealth. In this post, we will explain trading strategies and how they can be used to earn higher profits.

    What is Trading?

    Let’s understand it in this manner: when we buy something from a shop, we give them money for the product. This activity is exchanging goods and services. A similar thing happens in the financial market. We purchase and sell financial products, such as stocks, commodities, or currencies. We buy them when the price is low and sell them when the price rises, in turn earning a profit.

    This purchasing and selling of financial products, such as stocks, commodities, or currencies, is called trading.

    History of Trading

    Humanity has used the barter system, the earliest form of trading and investment, for thousands of years. In 600 BCE, the Lydians are said to have invented coins, introduced money, and facilitated trade.

    The oldest stock exchange was founded in the 16th and 17th centuries. In 1602, the Amsterdam Stock Exchange opened for business, which resulted in the purchase and sale of corporate shares by people. The New York Stock Exchange was founded in 1792 and has become a significant global trade center.

    Humanity has since witnessed significant technological advancements, including computers, telegraphs, and telephones. All these sped up the stock trading business and led to an electronic trading platform. This has provided access to a lot more individuals who were earlier unable to enter the stock market.

    In the 21st century, online trading has now become even more accessible because of mobile applications and discount brokers.

    Trading Styles

    Trading Styles

    There exist numerous trading styles, some of which are mentioned below.

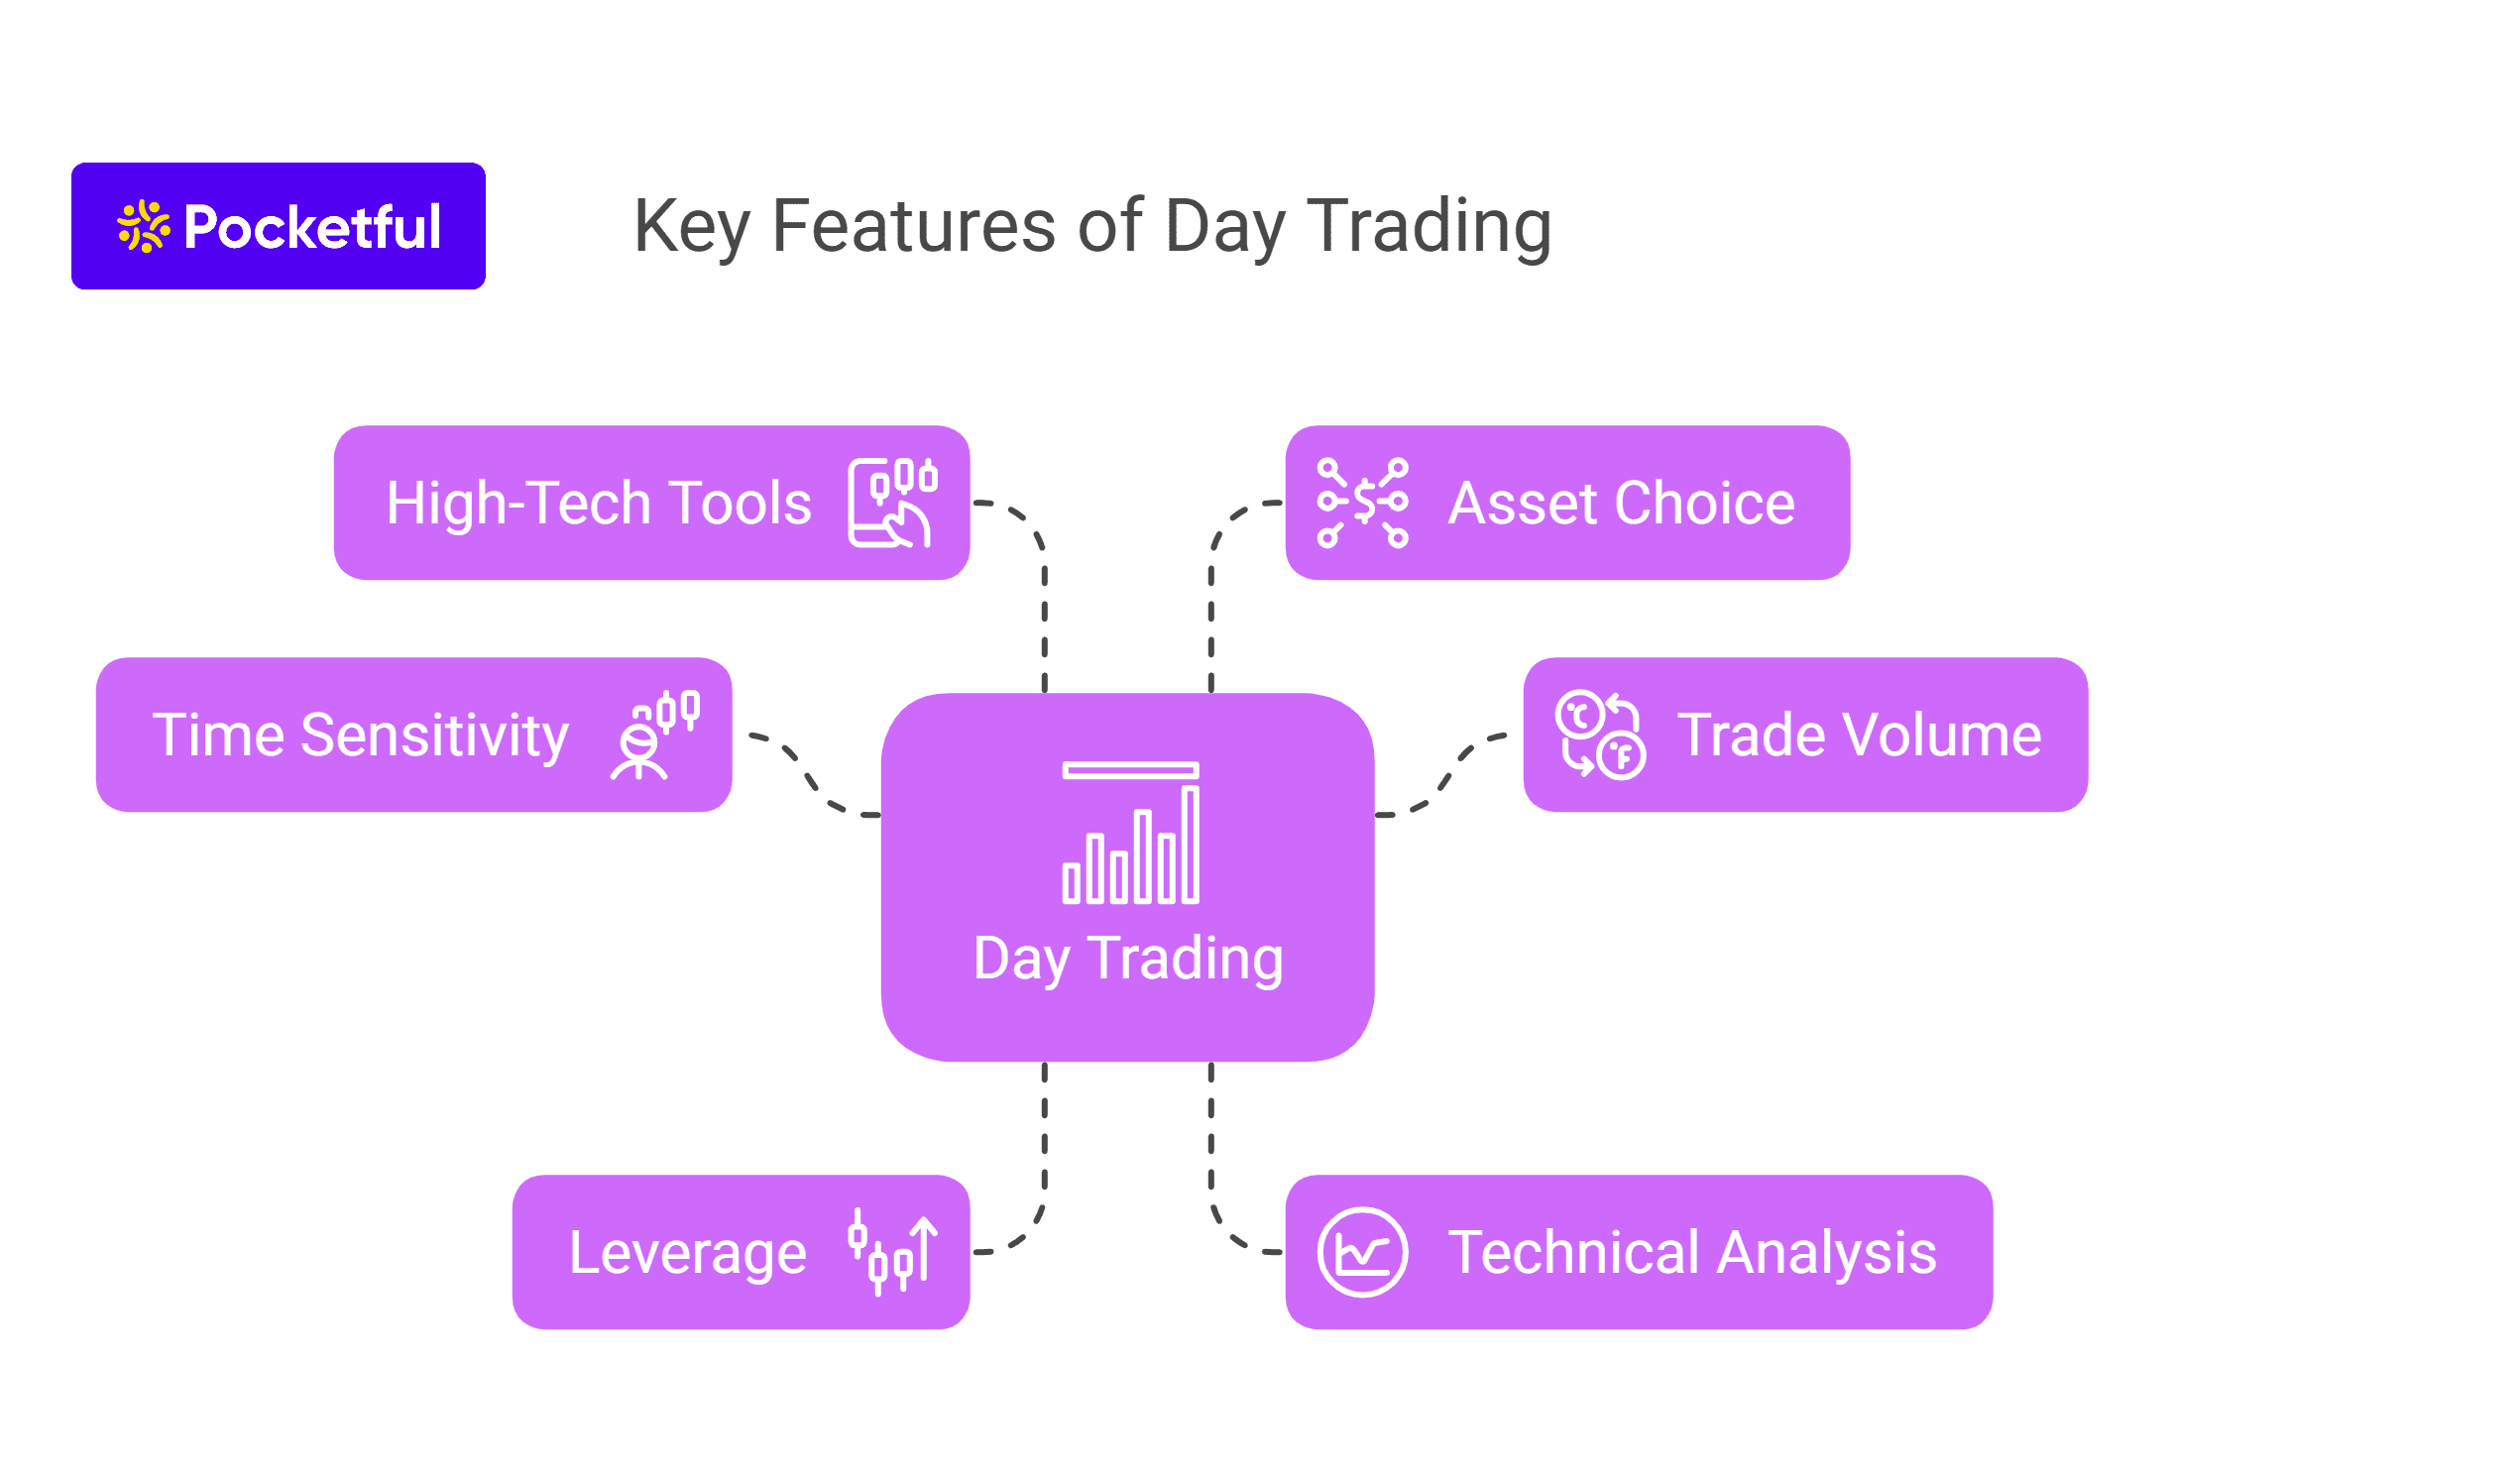
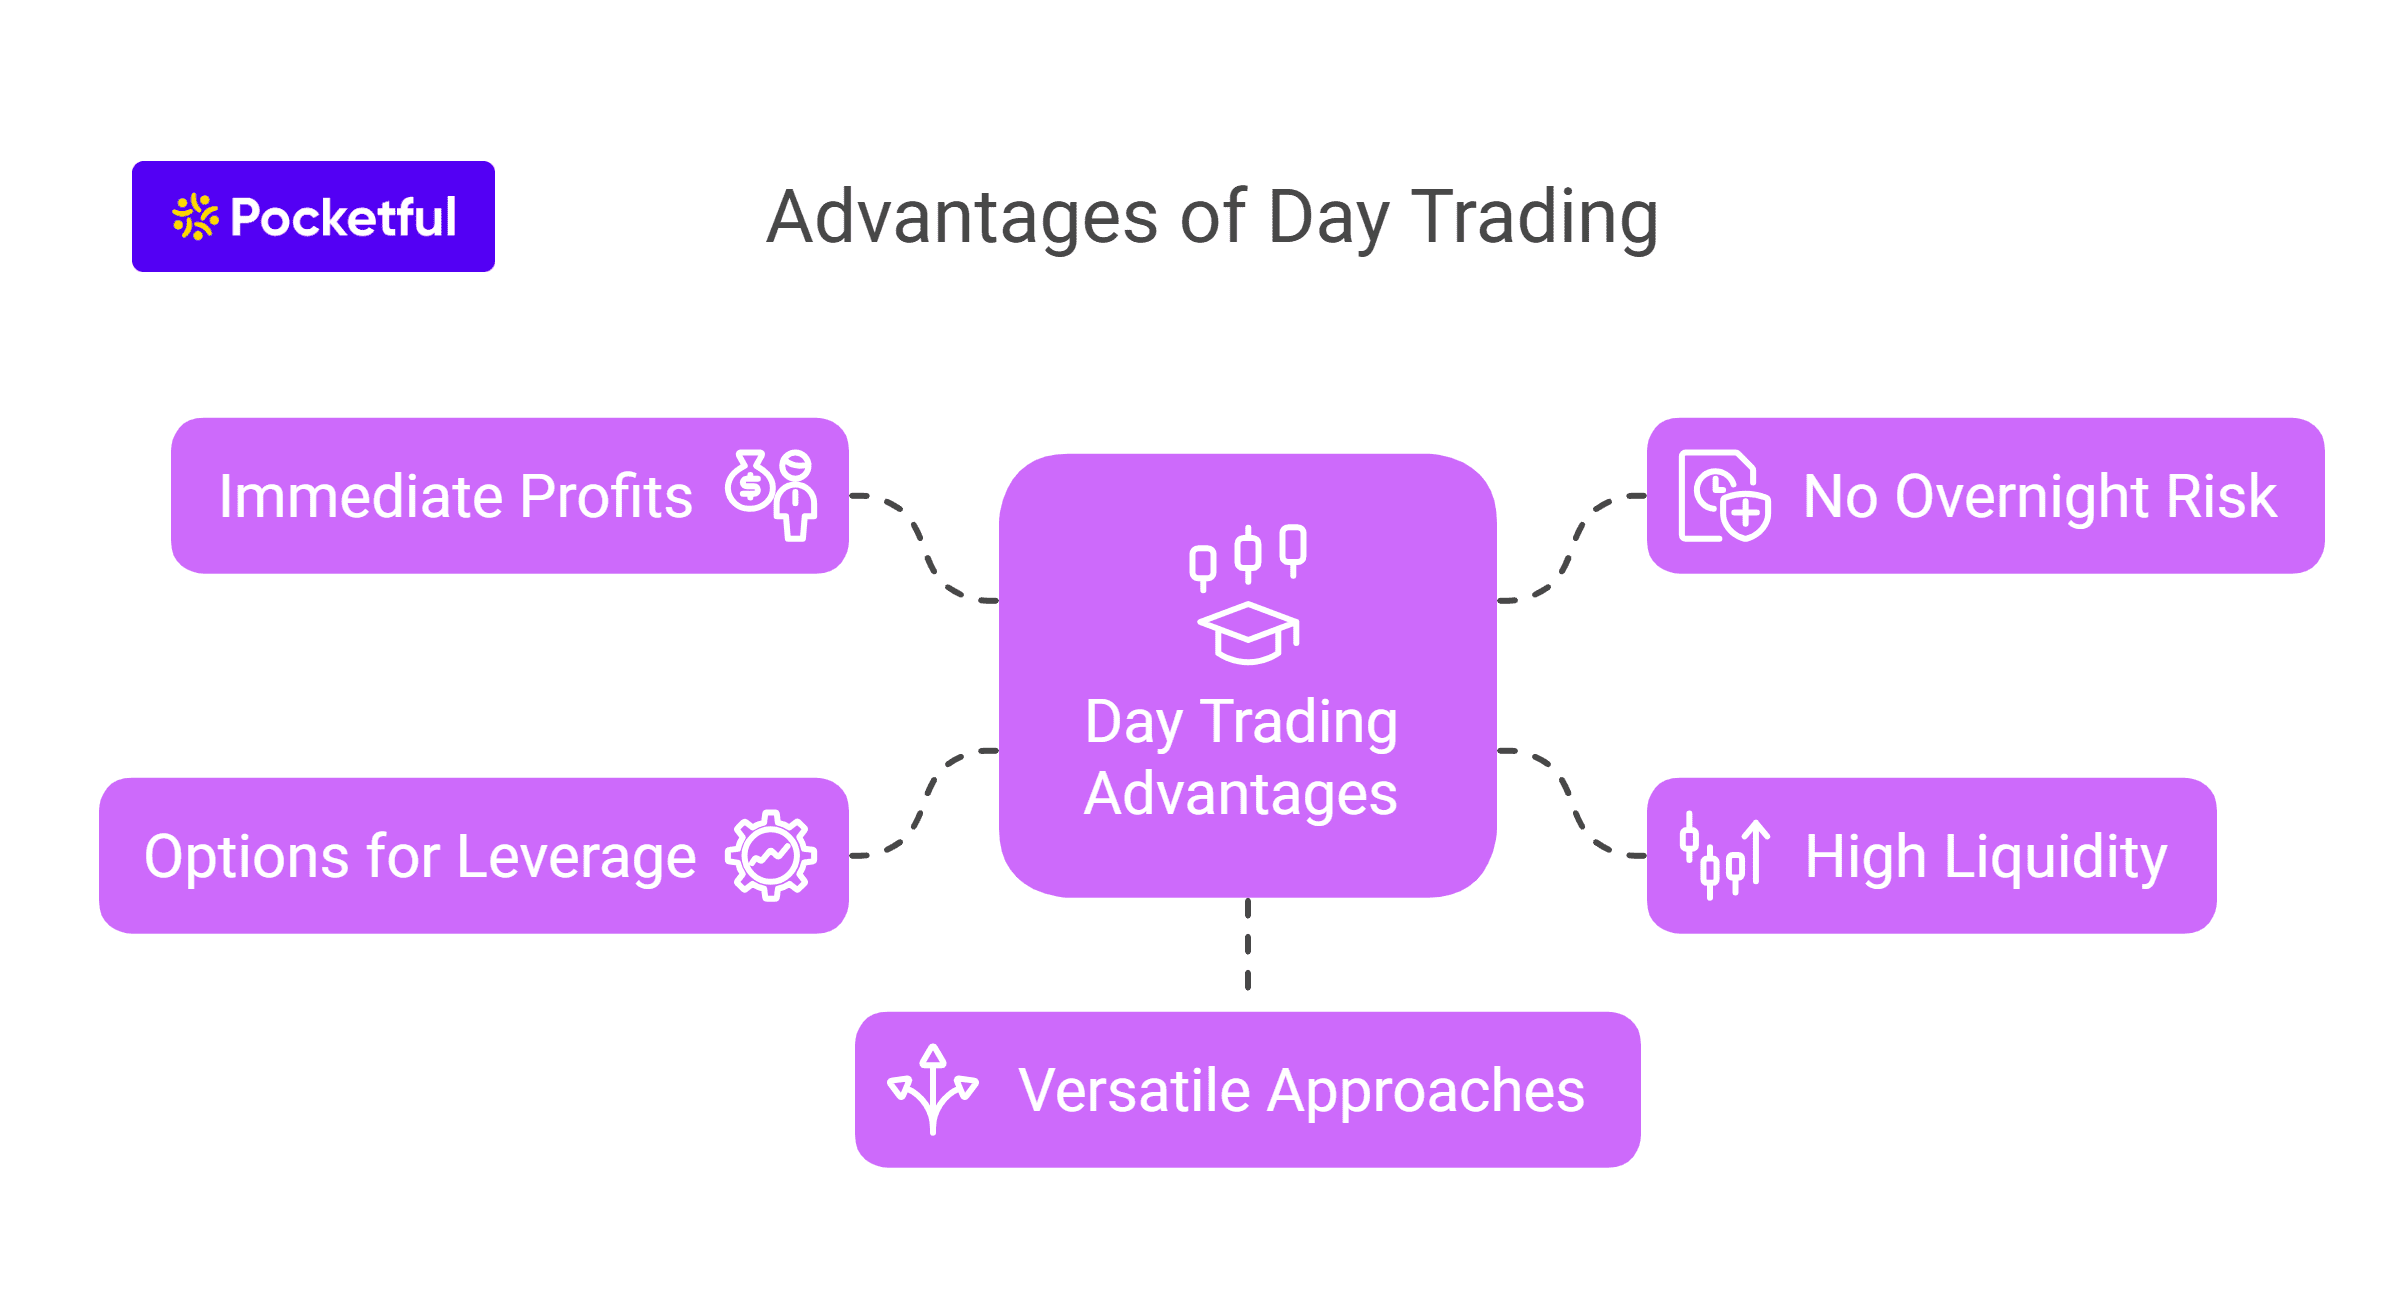
    • Day Trading: Day trading is a fast-paced trading strategy. It involves buying and selling assets within a single trading day. The main objective is to profit from brief price fluctuations, which demands quick thinking and laser-like focus. To reduce the possibility of unfavorable overnight price changes, traders usually liquidate their positions before the market shuts.
    • Swing Trading: Here, traders keep their position for a few days or weeks. They examine charts and look for bigger price fluctuations and market patterns to deliver a strong profit. While doing swing trading, one needs to have an active attitude, but it also requires deeper knowledge. Because of the short-term nature of swing trading, traders rely heavily on technical analysis with the occasional use of fundamental analysis.
    • Positional Trading: Positional trading is an investing technique in which traders hold their position for months. Their approach is based purely on fundamental analysis.
    • Scalping: It is a high-frequency trading strategy in which traders make hundreds of trades daily to capture small price movements. It heavily relies on technical analysis and requires a deep understanding of market mechanisms.

    Read Also: Trading For Beginners: 5 Things Every Trader Should Know

    How to start trading?

    How to Start Trading?

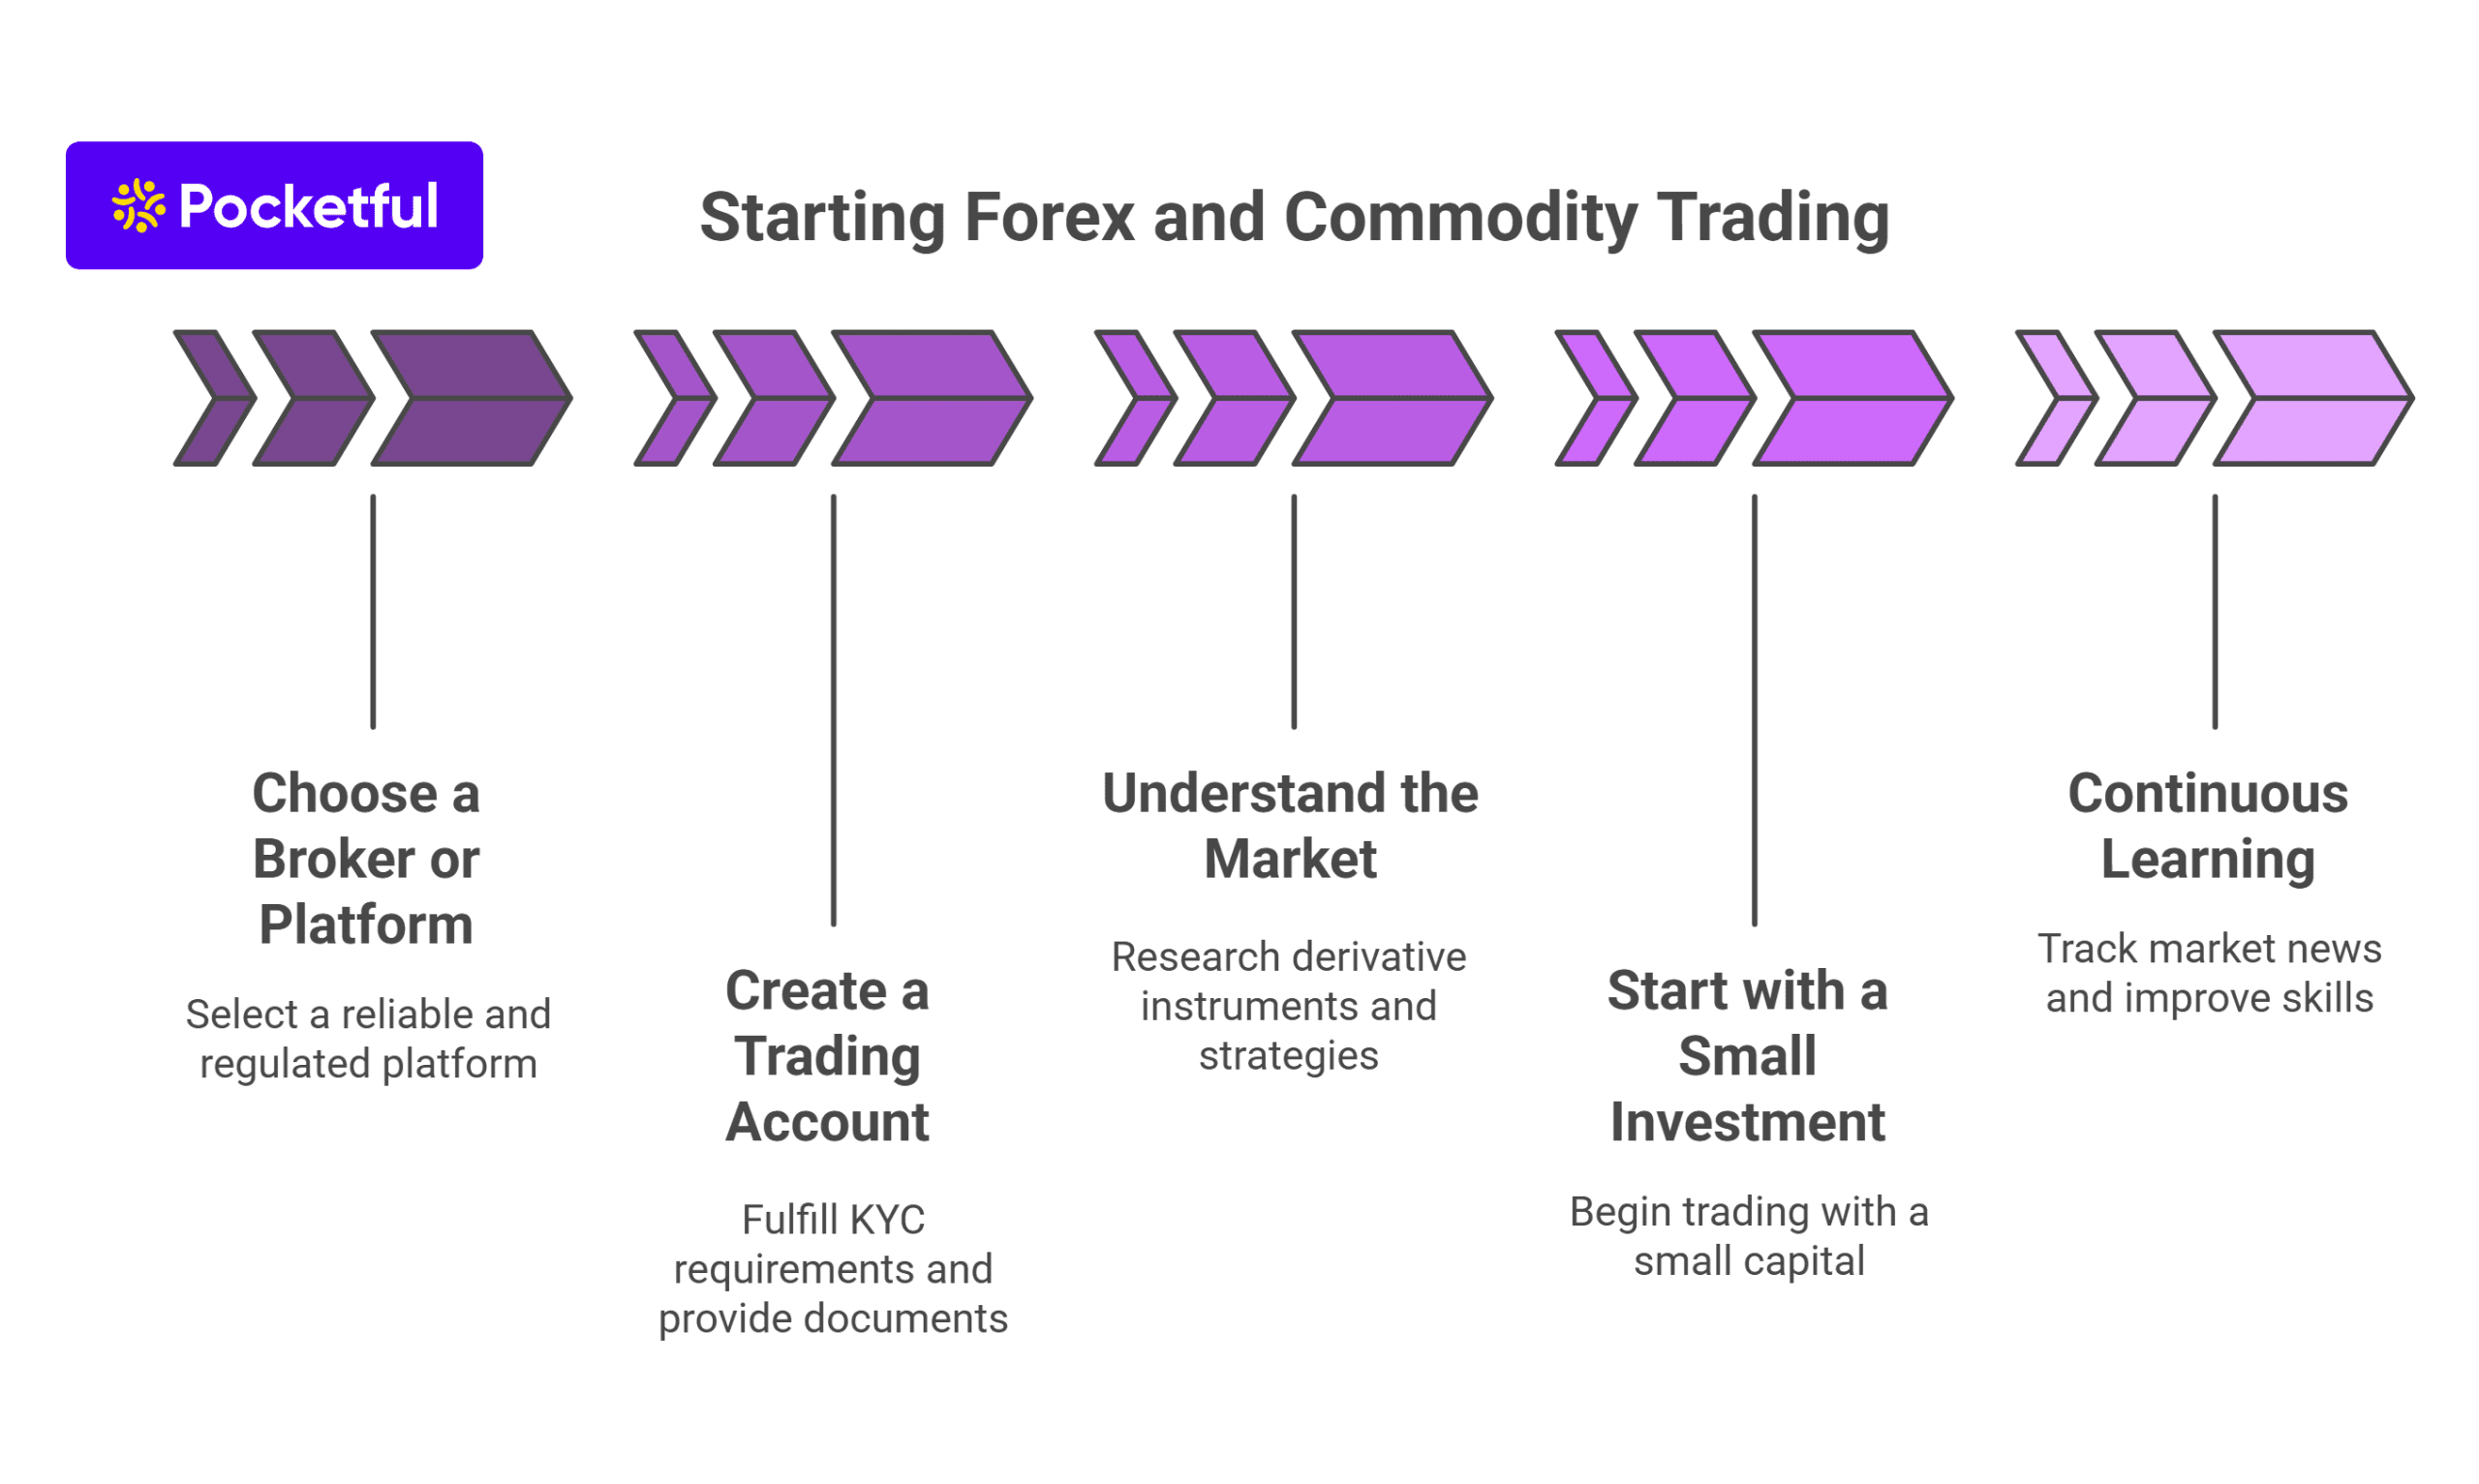
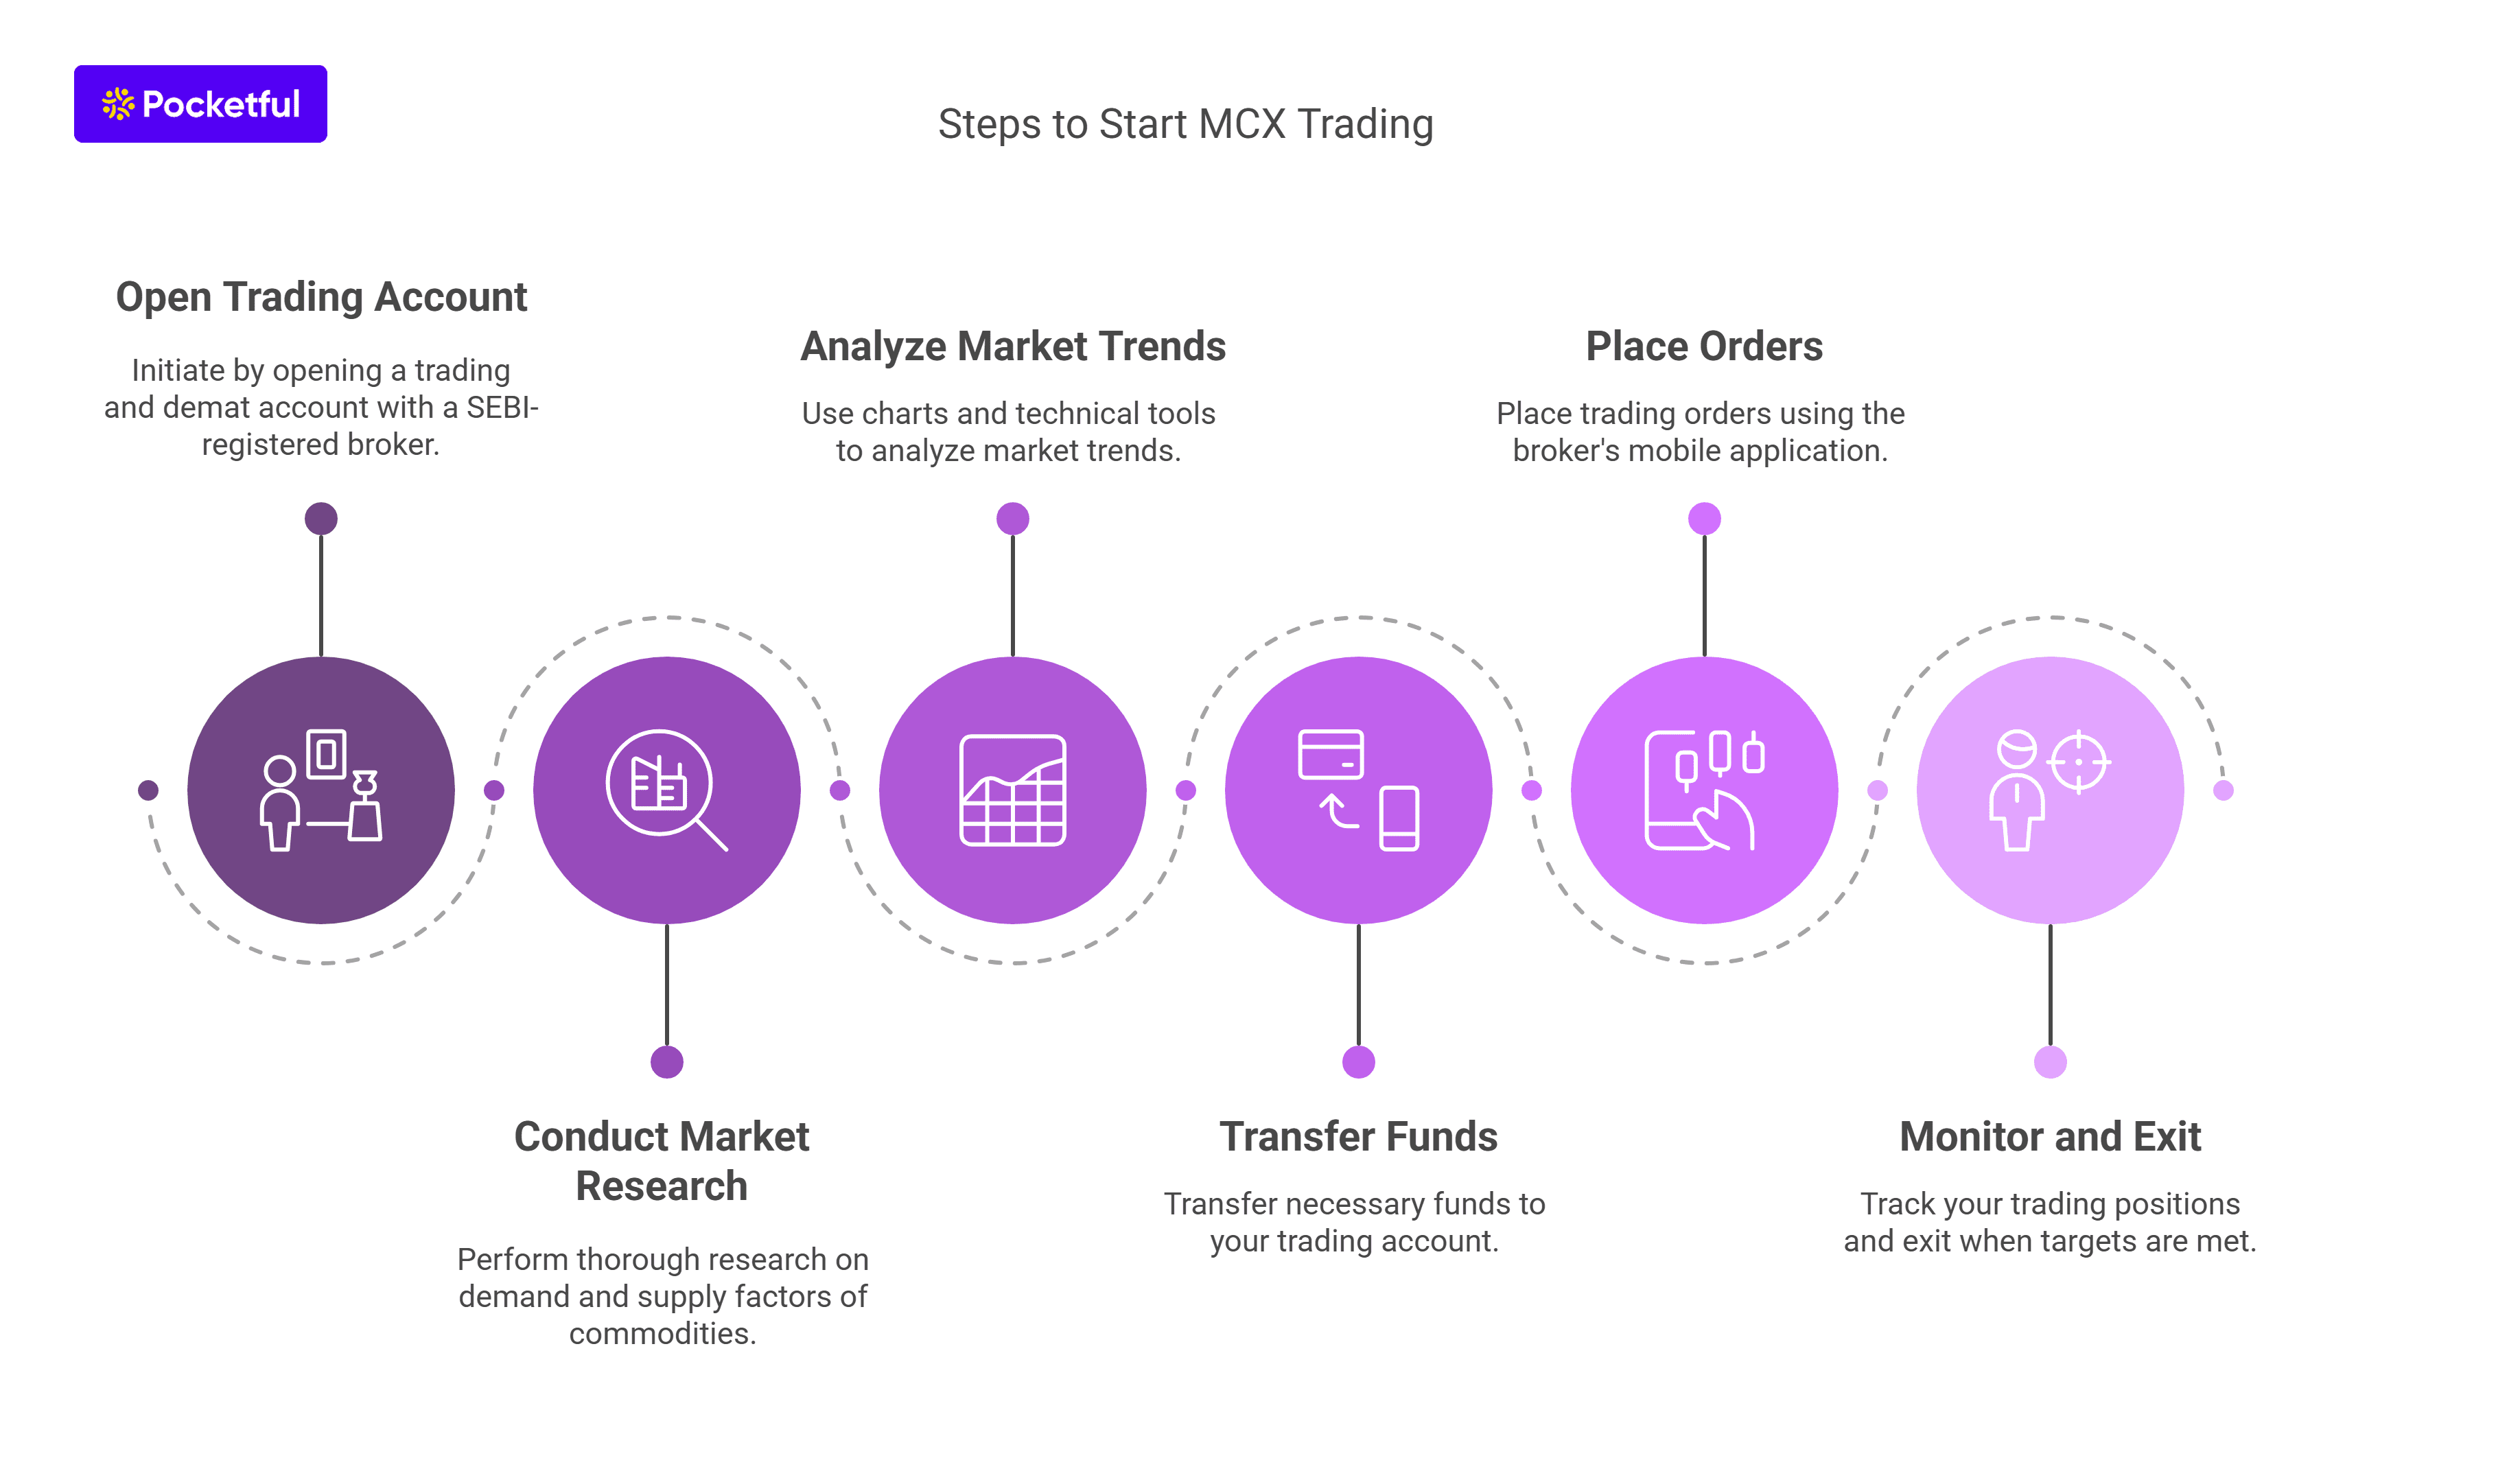
    Educate yourself: Before diving into the trading world, it is essential to learn the basics. Read books, go through articles, take online classes, and follow market news to stay updated.
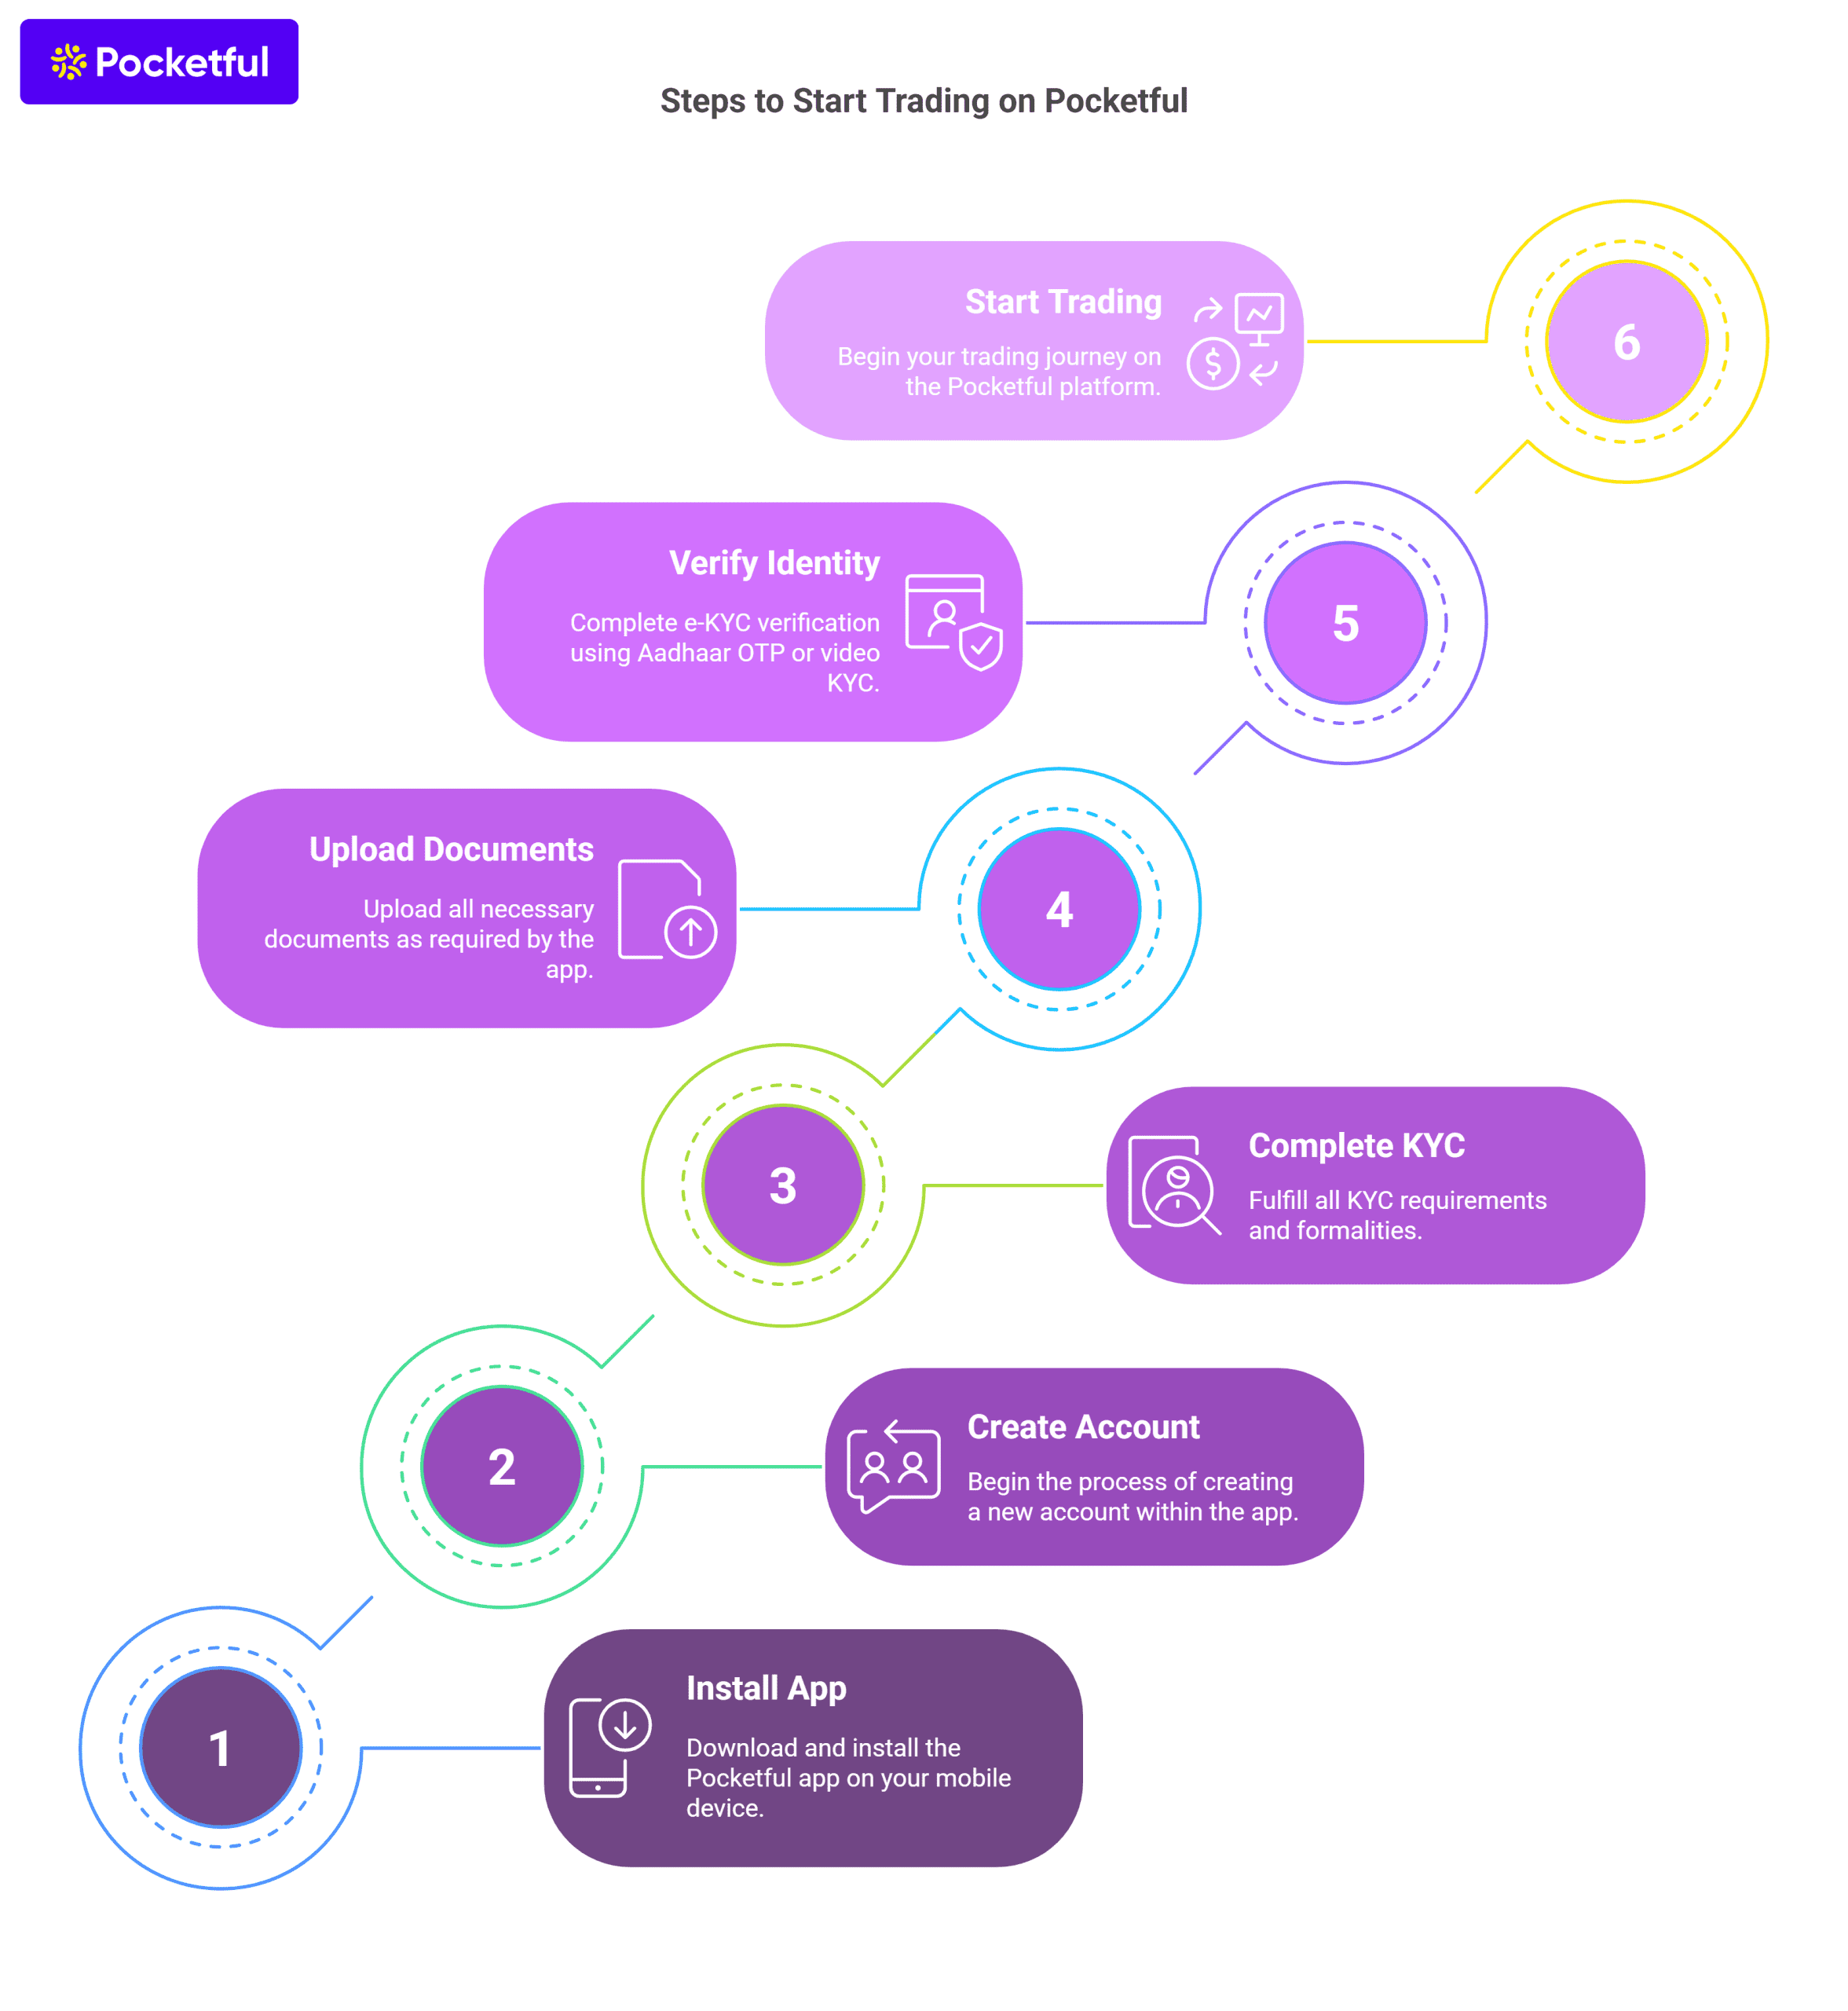
    Create a trading account: Once you have a decent understanding of how the markets function, create a trading account with online brokers, such as Pocketful. This will allow you to use state-of-art infrastructure with an easy-to-use interface.
    Choose your trading style: Decide which style suits your goals and risk tolerance.
    Fund your account: Deposit cash into your account using your preferred payment method to begin trading. Remember to invest money that you can afford to take risks with.
    Place your trade: Use the platform your broker provides to buy and sell the asset you choose.

    Trading vs Investing

    BasisTradingInvesting
    Time HorizonShort-term (days, weeks, months)Long-term (years, decades)
    GoalCapitalize on short-term price movementsGrow wealth over an extended period
    Risk Tolerance RequiredHighModerate to Low
    Research FocusTechnical analysis Fundamental analysis 
    ActivityMore frequent transactions.Less frequent transactions.
    Required KnowledgeDeep understanding of technical analysis and market mechanisms.Understanding of markets and asset classes.
    ProsHigh potential rewards, quick returns, and fast-paced.Lower risk, less time commitment, and less speculation.
    ConsHigh risk of losses, demands constant attention, and more speculation.Lower earning potential in the short term.

    Read Also: Swing Trading vs Day Trading: Which Strategy Is Right For You?

    Conclusion

    Finance can be scary, but if you know what you’re doing, you can handle trading like a pro. This guide intends to teach you the basics of trading, from its history to the different trade styles you can use. Remember that trading is exciting but dangerous. So, think about your goals and how much risk you can take before you step into the ring of stock trading.

    Frequently Asked Questions (FAQs)

    1. What is the difference between trading and investing?

      While trading talks about making money from short-term changes in the price of stocks, currencies, and commodities, investing mentions the art of slow but consistent returns; it involves sticking with trades for a much longer time.

    2. What are the different styles of trading?

      There are several trading styles, each with its own strategy and time frame. They are Day Trading, Swing Trading, Positional Trading, and Scaling.

    3. What are the risks associated with trading?

      Trading is exciting but comes with its own set of risks. It is heavily dependent on speculation, requires a high amount of technical knowledge, and can lead to immense losses even in the short term.

    4. How can I start trading?

      You can start trading by signing up and creating a demat account with popular brokers like Pocketful. You can fund your account and start placing trades once your account is created.

    5. What are the common mistakes to avoid while trading?

      The most common trading mistakes include overtrading, which leads to higher transaction costs and increased risk, and ignoring risk management, such as not setting stop-loss orders and failing to diversify your portfolio, which can result in significant losses

  • What is the NIFTY EV & New Age Automotive Index?

    What is the NIFTY EV & New Age Automotive Index?

    There has been a huge increase in the number of Electric vehicles on Indian streets recently. Now, India has its first NIFTY EV and New Age Automotive Index in the stock market!

    Today’s blog will explain the purpose of this groundbreaking index and how it benefits investors and the EV industry.

    What is the NIFTY EV

    The EV Index, also called the NIFTY EV & New Age Automotive Index, is a stock market index introduced in India on May 30, 2024. This is a first-of-its-kind index in India. It monitors the performance of companies involved in the electric vehicle industry or developing new automotive vehicles and related technologies.

    The introduction of the NIFTY EV Index is regarded as a favourable development for the EV sector in India. The industry is now expected to see a surge in investor interest, which will undoubtedly significantly boost EV companies.

    The base date for the NIFTY EV & Automobile Index is April 2, 2018, with a base value set at 1000. The index will be updated twice a year and adjusted

    Reasons for the New Index

    Reasons for the New Index

    There exist multiple rationales for the introduction of a new index tailored specifically to the EV sector. Some of the reasons are listed below.

    1. Benchmarking: The index can be utilized for various purposes, including benchmarking fund portfolios, launching index funds, ETFs and other structured products.
    2. Track Performance: The NIFTY EV & New Age Automotive index is designed to monitor the performance of companies operating in the EV and new age automotive sector. This sector includes hybrid vehicles, hydrogen fuel-based vehicles, and green-hybrid vehicles.
    3. Increased Interest of Investors: The introduction of a new EV index can elevate investor awareness and stimulate increased capital inflows into the EV sector in India. This will benefit both the established EV companies and startups seeking funding for research and development.

    Key Points to Note

    Key Points to Note
    • Stocks that are part of or soon to be part of the Nifty 500 index at the time of review can be included in the index.
    • Stocks in the Nifty 500 can be included in the index if they are involved in the production and supply of electric or new-age automotive vehicles, batteries, components, raw materials, and technology.
    • The overall weight of the stocks belonging to Group A (Manufacturing of 2W/3W/4W/PV/CV Electric and New Age automotive vehicles) shall be capped at 40%.
    • The weight of each stock belonging to Group A shall be capped at 8%. All other stocks are capped at 4%.

    Sector Representation & Current Components

    The sector representation in the new index is as follows:

    SectorWeight
    Automobile and Auto Components72.13
    Information Technology11.31
    Chemicals10.63
    Capital Goods6.39
    Oil, Gas & Consumable Fuels3.37
    Consumer Services0.18

    The top constituents by weightage are as follows.

    Company’s NameWeight (%)
    Bajaj Auto Ltd7.08
    Tata Motors Ltd.6.49
    Mahindra & Mahindra Ltd.5.83
    Maruti Suzuki India Ltd.5.28
    Exide Industries Ltd.4.78
    Bosch Ltd.4.56
    Samvardhana Motherson International Ltd.4.45
    Eicher Motors Ltd.4.42
    CG Power and Industrial Solutions Ltd.4.30
    Himadri Speciality Chemical Ltd.4.28

    Read Also: NIFTY Next 50 – Meaning, Types & Features

    Market outlook of EV Sector

    Market Outlook

    Industry experts hold both a bullish and bearish outlook for the EV sector. A concise explanation of both viewpoints is provided below:

    Bullish Outlook

    • Morgan Stanley predicts a 32% growth rate by 2030 for the Indian EV market.

      According to Morgan Stanley, India’s increasing demand for cars could account for half of the global car demand in the next two decades. New buyers can skip traditional cars and go straight to modern technology. This means that car manufacturers who are focusing on the future of the automotive industry will likely pursue opportunities for growth in India.
    • McKinsey estimates that electric vehicles could make up 30% of new car sales in India by 2030.

      As per McKinsey, consumers are increasingly showing interest in electric cars. Many people are considering buying electric vehicles for their next car. They prefer full-battery electric vehicles over plug-in hybrid electric vehicles.

      The company’s research on electric two-wheelers found that 86% of consumers would consider buying an EV, while only 69% would consider a Combustion Engine vehicle.

    Bearish Outlook

    • Citigroup has raised concerns regarding the consistency of government policies and the development of charging infrastructure.
    • Credit Suisse focuses on the importance of cost competitiveness in EVs compared to traditional vehicles.
    • JP Morgan has raised the issue of battery technology advancements and the scalability of sustainable raw materials to meet the growing demand for electric vehicles. This highlights the complex landscape the EV industry must navigate to achieve widespread adoption.

    Conclusion

    The introduction of the EV index represents a noteworthy milestone for the electric vehicle sector in India. This index has the potential to fuel sustainable growth by providing a clear benchmark and attracting new investments. This index is just the start of an exciting journey towards a cleaner and more sustainable future. However, it is important to consider consulting a financial advisor to determine whether EV-focused investments are compatible with your portfolio objectives.

    S.NO.Check Out These Interesting Posts You Might Enjoy!
    1What is Nifty BeES ETF? Features, Benefits & How to Invest?
    2What Is Nifty 50? How To Invest In It?
    3Bank NIFTY Intraday Options Trading: Steps, Strategies & Tips
    4Introduction to Gift Nifty: A Cross-border Initiative
    5How has Budget 2025 impacted Bank Nifty?

    Frequently Asked Questions (FAQs)

    1. What sectors are included in the EV index?

      The index includes the following sectors – Automobile and Auto Components, Information Technology, Chemicals, Capital Goods, Oil, Gas & Consumable Fuels, and Consumer Services.

    2. How is the New EV index beneficial for investors?

      Investors can use this index to benchmark their EV investments and gain exposure to the sector through index funds or ETFs.

    3. Is this the first EV Index globally?

      There are EV indices in other countries, but this is the first of its kind in India.

    4. How often will the index be reviewed?

      The index constituents will be reviewed every six months and rebalanced quarterly.

    5. Is it a good time to invest in EVs?

      The EV market is promising and evolving, but consult your financial advisor before making any investment decisions.

  • Swing Trading vs Day Trading: Which Strategy Is Right For You?

    Swing Trading vs Day Trading: Which Strategy Is Right For You?

    A million-dollar question: which trading strategy is right for you: Swing Trading or Day Trading? Let’s find out the answer.

    What is Day Trading?

    The Day trading involves buying and selling of financial instruments like stocks, bonds, futures, commodities, and currencies to generate profit from the short price movement within a single trading day. Many positions can be entered, which can last from several minutes to a few hours during the single trading day.

    Traders essentially close the position before the day ends to avoid risk exposure. As the activity of buying and selling takes place within a single day, traders make fast decisions on market direction and usually exit once the trade goes against their view.

    Anyone can perform day trading, but it requires lots of time and effort to monitor positions and some technical setup and knowledge to decide when to exit the market. A day trader wants to keep the risk minimum by not carrying it overnight. This is one of the major reasons for holding positions only until the end of the day because they are not subjected to overnight changes.

    There are multiple techniques which traders deploy in Day Trading. Some day trading techniques include:

    • Scalping: It Involves buying and selling a stock multiple times in a day to make small profits from small price movements. The time period for holding a trade could be a couple of seconds to minutes.
    • Range trading: It Involves buying when an asset’s price is in a particular range, it could be near the low end of the price range and selling when it’s near the high end of price range.
    • Algo Trading or High-frequency trading (HFT): It uses a computer-based system to automatically track price changes and execute trades. It is also called Algo trading.
    • Momentum trading: It means entering into a position of buying and selling on the basis of recent primary trends and exiting as soon as it shows signs of reversal. Momentum traders tend and volatility.

    What is Swing Trading?

    What is Swing Trading

    It involves buying and selling a financial instruments such as stocks, bonds, currencies, and commodities in an attempt to exploit short to mid-term price movements in a security using a favorable risk-reward ratio. The time period for holding a trade could be several days to weeks.

    Swing trading is often considered better for beginners compared to scalp trading or day trading. It requires fewer orders compared to scalp trading, hence lower trading costs. Also, it doesn’t require continuous monitoring. Though the minimum return is not guaranteed in this, Swing traders still have the potential to make a similar profit as of a scalper with less trading activity and less risk.

    Swing traders use many technical analysis signals to enter and exit a trade, such as Fibonacci retracement, Channel trading, MACD, RSI Crossover, divergences, and moving averages. Moreover, they also use Fundamental triggers like Quarterly results, management insights, inflation, interest rate scenarios, etc.

    What is the difference between Day Trading Vs Swing Trading

    Day TradingSwing Trading
    There is a low margin requirement for the Day trading as traders close the position on the same day.The requirement of margin is high compared to day trading.
    The higher leverage is made available for Intraday trading.The lower leverage is available for swing traders as it involves holding a position for days.
    Day traders are known as full-time traders as more time is required to execute and monitor the trades.Swing traders are known as part time traders as less time is required to monitor the trades.
    They make multiple trades and keep on exiting with small profits and losses.Swing traders analyze trends and choose securities that will perform better in future to earn profits.

    Read Also: 5 Must-Read Best Swing Trading Books for Trader

    Quick Summarization

    Quick Summarization
    1. Swing trading requires less involvement than day trading as it requires less monitoring.
    2. Swing trade positions are subject to overnight market risks, as swing trading often involves at least an overnight hold, whereas day traders close out positions before the market closes.
    3. Day traders have more access to margin or leverage as compared to Swing traders. Hence in day trading, because of leverage, traders risk magnifies but the good thing is if market goes against their view, they have time to instantly cut the position.
    4. Swing traders may incorporate both technical and fundamental analysis, whereas a day trader is more likely to focus on using technical analysis.

    Read Also: What is the Best Time Frame for Swing Trading?

    Conclusion

    In summation, there are no right or wrong answers to which trading strategy is right for you. It depends upon your skills, style, preference, and availability of time.

    Most of the people think trading is different from their actual mentality. Technical analysis, which is one of the tools used to gauge market direction, is nothing but a tool for judging mass psychology. The more the traders anticipate that the market is still undervalued or a certain sector or stock is available at a good valuation, the more they will buy, and the market will start taking support and eventually bounce. In similar way, the more the traders perceive that the market is overvalued or certain group of stocks or sectors are expensive, the more they will start exiting their position or start shorting.

    If traders could think they can analyze the market better, and are able to take risks to bet on market direction, then it is suggested that they go for Swing Trading. There are pros and cons of both the trading styles, so after taking them into consideration and as per one’s risk appetite, one can choose their respective trading style, Swing or Day Trading.

    Frequently Asked Questions (FAQs)

    1. What is Day Trading?

      Day trading is the activity of buying and selling financial instruments like stocks, bonds, futures, or commodities to generate profit from the price movement within a single trading day.

    2. What is Swing Trading?

      Swing trading is the activity of buying and selling financial instruments like stocks, bonds, futures, or commodities to generate profit from the price movement where traders keep the position open for a few days to a few weeks.

    3. Do Swing Traders make multiple trades?

      No, it is Day traders who make multiple trades and keep on exiting with small profits and losses.

    4. Which trading Strategy is less risky?

      Day trading is less risky than the Swing Trading as a trader can close the position on the same day, and there are no overnight uncertainty risks.

    5. What is the major difference between Day Trading and Swing Trading?

      There are various differences in Day trading and Swing trading such as difference of risks, time period, costs, size of profits and losses, etc.

  • Synthetic Futures – Definition, Risk, Advantages, Example

    Synthetic Futures – Definition, Risk, Advantages, Example

    Did you know that you can create a payoff similar to a futures contract using call and put options? We are talking about Synthetic Futures, one of the least discussed topics in options trading. Let’s have a deep dive into it.

    What are the Synthetic Futures?

    A synthetic future contract is a financial instrument that replicates the payoff of a traditional futures contract using other financial instruments such as options, swaps, or contracts for difference (CFDs). However, traders generally use options to create synthetic futures.

    In synthetic futures option version, we use options (call and put options) to replicate the payoff of a futures contract. For example, an investor buys a call option and sells a put option of same expiration date for a long synthetic future. And for a synthetic short future, the positions are reversed.

    The purpose of doing this is to replicate the payoff of the futures contract (without owning a physical asset) and or to bypass/reduce the limitations/risks associated with trading actual futures contracts.

    Risks associated with Synthetic Futures

    Risk in Synthetic Future
    • Liquidity Risk: Traders can face difficulty in executing and exiting synthetic future trades because of limited liquidity available, particularly in stock-specific contracts. Further, a higher bid-ask spread can reduce the profits.
    • Regulatory Restrictions: The use of synthetic futures contracts may be subject to regulatory compliance and restrictions in certain jurisdictions. Investors should be aware of the applicable laws and regulations governing these contracts in their respective countries.
    • Counterparty Risk: If you’re trading in Over the counter (OTM) markets, synthetic futures may involve counterparty risk, there is a risk of default or non-performance by any of the involved parties. It is crucial for investors to assess the creditworthiness and reliability of the counterparties before entering into synthetic positions.

    Benefits of Synthetic Futures

    • Lower Margin Requirements: One of the key advantages of synthetic futures contracts is that they often require lower margins compared to traditional future contracts.
    • Flexibility and Customization: Synthetic future contracts enable investors to   speculate on the various asset classes, including commodities, currencies, indices, and even individual stocks. Also, it allows traders to do certain adjustments using call and put options which is absent in future contracts.
    • Cost Efficient: The ability to make adjustments in the underlying asset helps in saving a lot of money.
    • Potential for Enhanced Returns: Due to the lower capital requirements and the ability to leverage derivative instruments, synthetic futures contracts offer the potential for enhanced returns.

    Read Also: Momentum Investing: Meaning, History, Types & Advantages

    Example

    Synthetic Future Example

    Consider that Berger paints is trading at INR 500. And a trader purchases a call option of ATM strike price, i.e., 500 strike for INR 50. This call option gives the trader the right, but not the obligation, to buy Berger Paints stock.

    Simultaneously, the trader sells a put option of 500 (ATM strike) for INR 30, with the same expiration date.

    By doing this, the trader has effectively created a synthetic long futures contract on Berger Paints stock by combining these two options. Thus, he or she can profit from the price increase if the stock price rises above INR 500.

    Based on the below formula, the net outflow of synthetic futures will be calculated as follows:

    Net Cash Outflow = Call option – Put option = 50-30 = 20

    Keep a note that we are buying the ATM Call Option and simultaneously selling the ATM Put Option. Further, the call and put options belong to the same underlying and same expiry. Synthetic Long mimics the payoff of the long futures contract. In case of short synthetic futures, we buy ATM Put Option and sell ATM Call Option of the same underlying and same expiry.

    Let us consider a few expiry scenarios:

    1. Berger Paints stock expires at 400 (Below ATM)
      • At 400, the 500 CE will expire worthless, hence we will lose call premium paid that is INR 50 but PE will have an intrinsic value of Max (Strike – Spot, 0), i.e., Max (500-400, 0) or 100 as we are short on this put option, we will lose the money from the premium, 30 – 100 = (70)
      • Total payoff from the long Call and short Put position would be, -50 – 70 = (120). Here, we made a loss of INR 120.
    • Stock expires at 500 (At ATM )
      • If the market expires exactly at 500, then both the options will expire worthless. Hence, we will lose the premium paid for the call option option = 50. But we will be able to retain the premium for the PE option = 30.
      • The net payoff from both the positions will be, 30-50 = (20). Here, we made a loss of INR 20.
    • Stock expires at 600 (Above ATM)
      • At 600, the 500 long CE would have an intrinsic value of 100, we would make, [Intrinsic value – Premium Paid] = 100 – 50 = +50. The 500 short PE would expire worthless; hence we get to retain the premium of INR 30.
      • Total payoff would be = +50 + 30 = INR 80

    We can conclude that the strategy makes money when the market moves higher and loses money when the market goes down, similar to futures. However, this does not necessarily mean that the payoff is similar to that of futures. To establish that the synthetic long payoff behaves similar to the futures, there should be a payoff symmetry around the breakeven point that is called linearity and then only it will behave like futures.

    Read Also: What is Future Trading and How Does It Work?

    Conclusion

    Synthetic futures contracts have gained popularity in the financial markets as they provide investors with a unique tool to gain exposure to the underlying assets without actually owning them. These contracts are designed to replicate the price movement and characteristics of traditional futures contracts.

    By replicating the characteristics of an actual Futures contract, Synthetic futures give flexibility, risk management and increased trading opportunities. However, it is essential to understand the risks involved and have a good understanding of options strategies with proper knowledge and skill.  

    FAQs

    1. What is a Synthetic Futures?

      A Synthetic Future is a financial instrument that mimics a futures contract’s characteristics and potential returns without having its limitations.

    2. Can I create Synthetic Futures apart from Options?

      Yes, it can be created using other financial instruments as well, like Swaps and CFDs.

    3. What are the advantages of Synthetic Futures?

      It provides alternative trading strategies and effective risk management tools.

    4. What is one of the limitations of Synthetic Futures?

      One of the limitations of Synthetic futures is the limited availability of certain synthetic instruments because of low volumes in call and put options.

    5. Is Counterparty Risk involved in Synthetic Futures?

      Counterparty risk is the risk of loss from a default of the counterparty. In case of OTC markets, it is a primary risk in synthetic futures and are subject to creditworthiness of the counterparty.

  • NIFTY Next 50 – Meaning, Types & Features

    NIFTY Next 50 – Meaning, Types & Features

    Are the gains offered by the Nifty 50 overwhelming you? We are here to inform you that this is only the beginning; discover the possibilities of the Nifty Next 50 market movers!

    This blog will explore the Nifty Next 50 and the recent development by NSE in detail. 

    What Is Nifty Next 50

    The Nifty Next 50 index comprises 50 large-cap stocks from the Nifty 100 after the first 50 shares of the Nifty 100 are removed. Nifty Next 50 is a tool that investors use to keep track of and find prospective future large-cap companies.  Nifty Next 50 companies can come from various industries, including finance, pharmaceuticals, FMCG, etc. As of September 2023, the Nifty Next 50 stocks comprise around 10% of the NSE’s entire free-float market capitalisation. 

    Nifty Next 50 Trading

    Correlation with Nifty 50

    Sriram Krishnan, NSE’s Chief Business Development Officer, stated that the Nifty Next 50 index has a beta value of 0.95 and a 71% correlation with the Nifty 50 index. 

    Did you know? 

    Over 40 stocks have been upgraded to Nifty 50 within the past 18 years.

    Sectoral Weightage

    SectorsCompaniesWeightageMarket Cap (in ‘000 Cr)
    Finance713.52%10,45,871.20
    Power Generation & Distribution410.63%8,22,400.78
    Insurance310.48%8,10,640.24
    Aerospace & Defence27.07%5,46,957.10
    FMCG46.49%5,01,711.57
    Retail25.88%4,54,929.85
    Capital Goods – Electrical Equipment25.54%4,28,682.07
    Banks34.95%3,82,849.35
    Cement23.20%2,47,197.61
    E-Commerce/App based Aggregator23.08%2,38,422.56
    Gas Distribution23.06%2,36,450.42
    Refineries13.05%2,36,107.11
    Chemicals22.88%2,22,560.03
    Realty12.62%2,03,000.31
    Pharmaceuticals22.53%1,95,954.21
    Auto Ancillaries22.43%1,87,787.04
    Mining & Mineral products12.19%1,69,188.64
    Air Transport Service12.09%1,62,001.05
    Consumer Durables11.53%1,18,142.28
    Steel11.39%1,07,354.07
    Automobile11.38%1,06,992.52
    Railways11.12%86,616.00
    Alcoholic Beverages11.12%86,325.64
    Edible Oil11.02%78,687.86
    Paints/Varnish10.75%57,794.34
    (As of 28th May 2024)

    Based on the above table, we can conclude that the finance sector has the highest allocation of 13.52%, followed by the power sector, which has 10.63%.

    Nifty 50 vs Nifty Next 50

    As previously established, the Nifty 50 and Nifty Next 50 are components of the Nifty 100 index. However, there is a significant disparity in the size of the companies in these two indices, which causes large differences in the returns. 

    Benchmark Name2021202220232024 (YTD)
    Nifty Next 50 TRI30.9127.213.2
    NIFTY 50 TRI25.65.721.33.7

    As the above table shows, the Nifty Next 50 Index has surpassed the Nifty 50 benchmark but reflects a higher volatility in returns. 

    Read Also: What is the NIFTY EV & New Age Automotive Index?

    Introduction of Derivative Contracts by NSE

    With approval from the Securities Exchange Board of India, the National Stock Exchange launched derivative contracts on the Nifty Next 50 index on April 24, 2024 (SEBI). In this derivative contract, the exchange will provide traders with three series of monthly index futures and option contract cycles—near-month, mid-month, and far-month. The contract typically ends on the final Friday of the expiration month. 

    Waiver of Transaction Cost

    Furthermore, to encourage more people to participate actively in the Nifty Next 50 Index, the NSE has announced that it will waive transaction costs for trading in futures and options contracts on the index for the first six months ending October 31, 2024. 

    First Monthly Expiry Insight

    The first monthly expiry is scheduled for 31 May 2024. The index has shown a turnover of more than 1100 crores within 3 weeks of its launch. The average daily turnover of the Nifty Next 50 Index is 50-60 crores, and the peak turnover is 82 crores. 7 ETFs and 13 mutual funds track the index.

    Conclusion

    The Nifty Next 50 index allows investors to profit from expanding industries and businesses. However, its volatility is comparable to mid-cap firms. Consequently, investors are urged to consider their risk tolerance before investing.

    S.NO.Check Out These Interesting Posts You Might Enjoy!
    1What is Nifty BeES ETF? Features, Benefits & How to Invest?
    2What Is Nifty 50? How To Invest In It?
    3Bank NIFTY Intraday Options Trading: Steps, Strategies & Tips
    4Introduction to Gift Nifty: A Cross-border Initiative
    5How has Budget 2025 impacted Bank Nifty?

    Frequently Asked Questions (FAQs)

    1. In which year was the Nifty Next 50 Index introduced?

      The Nifty Next 50 Index was introduced on 1st January 1997.

    2. Which sector has the highest allocation in the Nifty Next 50 Index?

      The banking & finance sector has the highest allocation of 13.26% in the Nifty Next 50 Index, followed by the power sector, which has a weightage of 10.64%.

    3. Should I invest in Nifty Next 50 Index funds now?

      Investment in the Nifty Next 50 Index offers a higher return than the Nifty 50 Index but also comes with higher volatility. Therefore, you can consider investing in this index if you have a longer investment horizon and can take risks.

    4. Can I use the Nifty Next 50 Index derivative for trading purposes?

      You can use the Nifty Next 50 derivative for trading purposes.

    5. Is the stock in Nifty Next 50 a part of large-cap stocks?

      Indeed, the stocks that comprise the Nifty Next 50 belong to the large-cap stock category. This is because the top 100 firms, determined by their free-float market capitalization, are classified as large-cap stocks.

  • Why Are PSU Stocks Falling? Key Insights and Considerations

    Why Are PSU Stocks Falling? Key Insights and Considerations

    The Indian infrastructure sector is the backbone of the nation’s economic growth. Financing these large-scale projects is crucial, and project finance has filled the gap. However, the RBI recently introduced draft guidelines aimed at revamping this system.

    In this blog, we will learn about these new RBI regulations and explore their impact on lenders and borrowers. Further, we will also understand whether they usher in a new era of prudence in project finance.

    PSU Stocks – An Overview

    PSU stocks refer to the shares of companies that are categorised as Public Sector Undertakings. These are businesses where the Indian government holds a majority stake, i.e., at least 51% ownership. Examples of PSUs include LIC, BHEL, Indian Oil, BSNL, NTPC, ONGC, SBI, etc.

    These companies operate across sectors like energy, oil & gas, power, banking, insurance, infrastructure, manufacturing, and telecommunications.

    PSUs have a profound impact on the economic growth of India through the provision of vital goods and services, the promotion of balanced development, as well as the effective implementation of government policies.

    Read Also: What is PSU Index? Performance, Comparison, Benefits, and Risks

    Why there was a fall in the PSU stocks?

    Fall in PSU Stocks

    The share of PSU stocks witnessed a sharp decline of up to 13% after the Reserve Bank of India’s implementation of more stringent regulations regarding project finance on 7 May 2024.

    But, what is Project Finance?

    Project Finance is a way to fund long-term infrastructure and industrial projects. It is distinct from conventional corporate loans, as it depends on the project’s cash flow for debt repayment rather than the creditworthiness of the sponsoring companies. In the event of default, lenders generally have limited recourse to the sponsor’s assets due to the project’s status as a distinct entity. The primary concern revolves around the security of the project’s assets and revenue.

    It is often used for large and complex projects that have high initial expenses, such as power plants, toll roads, bridges, tunnels, dams, etc.

    Let us have a quick overview of RBI’s new guidelines for project finance:

    As per the RBI letter dated 7 May 2024, Banks must increase their provisions for loan defaults during the project’s construction phase. The provisioning amount for this loan can be as high as 5% in contrast to the existing 0.4%. This may result in higher borrowing costs for developers and infrastructure companies.

    The proposed implementation of the 5% provisioning requirement is set to be carried out gradually until the fiscal year 2027.

    The provisioning requirements shall be alleviated as the project advances towards the operational phase. Once operational, banks may be required to only set aside 2.5% of the outstanding loan and this reduction can be further minimised to 1% if the project meets the specific financial performance benchmarks.

    The RBI has proposed minimum exposure requirements for projects that are financed by multiple lenders, also known as consortium lending. This means that each participating bank needs to have a minimum loan portion relative to the total project cost.

    Additionally, it is stipulated that when the participant lenders collectively have an exposure of up to INR 1,500 crore, no individual lender shall be permitted to have an exposure that is less than 10% of the aggregate exposure, and for projects where the aggregate exposure of lenders is more than INR 1,500 crore, the individual exposure floor will be 5% or INR 150 crore, whichever is greater.

    Objectives of RBI Guidelines

    Objectives of RBI Guidelines

    There are two main objectives behind RBI’s new guidelines on project finance:

    • The primary objective behind this is to prompt lenders, i.e., banks and financial institutions to exercise greater caution when providing financing for projects. The RBI has mandated banks to allocate higher provisions (up to 5% during construction) to ensure careful assessment of project risks before allocating funds. This can make project finance more stable in the future, with fewer loan defaults.
    • Implementing more rigorous loan approval procedures and emphasizing risk mitigation measures could catalyse project developers to enhance their project planning, feasibility, and overall execution. This will lead to higher quality projects with better chances of success and timely completion.

    Impact of the New RBI Guidelines

    The new draft guidelines for project finance by the RBI are anticipated to have a diverse influence on the myriad of stakeholders participating in this domain:

    • Lenders will need to set aside more money, which can go as high as 5%, for lending during construction. As a result, developers can expect borrowing rates to increase by 100-150 basis points. This means that loans will become more costly.
    • The implementation of more rigorous loan approval procedures and the presence of a cautious lending climate may result in setbacks in obtaining project finance.
    • New reporting requirements and consortium lending norms might add complexity to the loan approval process for banks.

    Read Also: RBI Retail Direct Platform

    Conclusion

    To sum it up, the RBI’s new guidelines for project finance aim to create a more balanced and risk-averse project financing environment. However, short-term challenges for borrowers and lenders may arise, but the long-term benefits of better project quality and stability could be substantial. The success of these guidelines will depend on effective implementation and open communication between lenders, borrowers and regulators.

    Frequently Asked Questions (FAQs)

    1. How will new RBI guidelines on project finance impact borrowing costs?

      With new guidelines, the Banks have to raise interest rates by 100-150 basis points because of increased provisioning needs, making project finance more expensive.

    2. Will new RBI guidelines on project finance affect borrowers?

      The Borrowers will face stricter loan approvals and higher borrowing costs, and there can be project delays.

    3. Can RBI’s new project finance guidelines slow down project financing?

      Tighter regulations and higher costs might cause a tentative slowdown, especially for smaller projects.

    4. Are project finance guidelines released by RBI the final one?

      No, these are draft guidelines. The final regulations may differ after considering the feedback of all stakeholders.

    5. When will RBI’s new guidelines for project finance come into effect?

      A phased implementation of new guidelines is expected, with full effect by March 2027.

  • Delisting Of ICICI Securities : Reasons and Brief Explanation

    Delisting Of ICICI Securities : Reasons and Brief Explanation

    Ever heard of a company delisting itself from the stock market on purpose? That is precisely what is happening to the ICICI Securities. In March 2024, the minority shareholders showed their support by voting in favour of ICICI Securities’ delisting, and to merge with its parent company, ICICI Bank. But before you jump to conclusions, this was not bad news. It was a strategic move by ICICI Bank to simplify its structure and create a more robust financial force.

    In this blog, we will explore the reasons behind the proposed delisting of ICICI Securities, the process, and how this decision could benefit both ICICI Bank and its shareholders.

    ICICI Securities – Brief

    ICICI Securities is a listed company founded in 1995 as ICICI Brokerage Services Limited and is a subsidiary of ICICI Bank. The company embraced technology and launched a revolutionary online brokerage platform, ICICIdirect.com, in 2000 and pioneered online investment opportunities in mutual funds and government bonds. It expanded its reach through physical ICICI direct branches across India in 2005 and diversified services by offering health and life insurance products by 2006. The company name was officially changed to ICICI Securities in 2007.

    On November 9, 2023, the Reserve Bank of India approved ICICI Bank’s request to establish full ownership of ICICI securities. About 71.9% of the brokerage’s minority shareholders approved the delisting, which is higher than the regulatory requirement of a two-thirds majority.

    The ICICI Bank is offering 67 shares of ICICI Bank for every 100 shares of ICICI Securities held by the shareholders. However, there was some disagreement among investor groups. Institutional shareholders, who have a more significant stake, supported the delisting, while some retail investors opposed it.

    Additionally, the Quantum Asset Management Company (QAM), with a 0.21% stake in ICICI Securities, voted against the deal. According to QAM, ICICI’s offer for the stake is undervalued. It should be priced at approximately INR 940 per share, considering the lowest multiple among its comparable peers in the market. This valuation is significantly higher than the current offer on the table by the ICICI Bank.

    Why Retail Investors are not in favour of Delisting

    Why Retail Investors Not in favour of ICICI Delisting

    A few Retail Investors are opposing the delisting of ICICI Securities because of the Swap Ratio concern:

    Swap Ratio Concern – Retail investors felt that the exchange rate offered by ICICI Bank (67 shares of ICICI Bank for every 100 shares of ICICI Securities) undervalued the ICICI Securities. They believe that their holdings are worth more than the offered price, and the swap ratio would not translate to the same potential growth as holding separate stocks.

    If you’re not familiar with Swap Ratio, it refers to the exchange rate at which shares of the acquiring company (ICICI Bank in this case) are offered for shares of the target company (ICICI Securities). It establishes the percentage of ownership a target company shareholder will receive in the new or surviving company.

    Read Also: Delisting Of ICICI Securities : Reasons and Brief Explanation

    Reasons for Delisting of ICICI Securities

    Reasons for Delisting of ICICI Securities

    ICICI Securities is proposed to become a wholly-owned subsidiary of ICICI Bank, which would give ICICI Bank complete ownership and control over ICICI Securities.

    The Bank believed that merging the two entities would improve efficiency and allow it to offer a broader range of financial products and services under one roof. The Delisting would also allow for streamlining operations and decision-making processes within the bank.

    Delisting – An Overview

    The Delisting refers to removing a company’s stock from a stock exchange, i.e., NSE and BSE in India. This means the stock can no longer be traded on an exchange. The companies might delist their shares for several reasons, such as mergers and acquisitions, non-compliance with listing requirements, financial distress, etc. Generally, the delisting can be classified as voluntarily or involuntarily.

    • Voluntary Delisting
      A company might choose to go private or get acquired by another company. In this case, the company will generally offer shareholders a way to sell their shares before the delisting happens. ICICI securities is a case of voluntary delisting.
    • Involuntary Delisting
      This happens when a company does not follow the stock exchange listing requirements. There are different requirements a company needs to meet to stay listed, such as maintaining a specific price or filing several reports on time. The exchange can delist, if a company does not meet the listing requirements.

    You must wonder what happens to the shares after the company is delisted, particularly in case of Involuntary delisting. Even though delisting makes things trickier, you still own a stake in the company, as indicated by your shares. Let’s have a quick overview:

    • Once the company is delisted, you can no longer trade it on the stock exchange. This significantly reduces liquidity, meaning finding a buyer for your shares might be challenging.
    • You might be able to sell your shares on the Over the counter (OTC) market, which is essentially a network of dealers who trade securities outside of exchanges. However, OTC markets are less regulated and generally have wider bid-ask spreads than the stock exchange.
    • Shareholders might find it challenging to sell their shares as there may be limited buyers in the OTC market.
    • In case of voluntary delisting, the acquirer provides the buyback window. The shareholders can sell their holdings to the promoters before delisting.

    Read Also: ICICI Bank Case Study: Financials, KPIs, Growth Strategies, and SWOT Analysis

    Conclusion

    The delisting of ICICI Securities will mark a turning point for the company and ICICI Bank. While some retail investors expressed concerns, the goal is to create a more efficient financial institution. Only time will tell the impact of this strategic move. The company may be delisted, but the decision positions them for future growth as a part of a stronger financial entity.

    Additionally, the delisting will pave the way for a more streamlined and competitive financial giant. This could be a positive development for ICICI Bank and the Indian financial landscape. Also, SEBI is currently reviewing multiple complaints regarding the delisting. Upon the collection of substantiated evidence, the SEBI will initiate an investigation. The actions that SEBI may take remain uncertain.

    Frequently Asked Questions (FAQs)

    1. Why ICICI Securities is getting delisted?

      The purpose of delisting is to simplify ICICI Bank’s structure, and achieve better integration between the two entities.

    2. Did ICICI Bank take this decision because of the poor performance of ICICI Securities?

      No, it was a strategic decision to delist ICIC Securities, and not due to negative performance of the company.

    3. Did everyone agree with the delisting?

      The institutional investors favoured the delisting; however, a few retail investors opposed it.

    4. What will happen to the shareholders of ICICI Securities?

      The shareholders of ICICI securities will receive the ICICI Bank shares in exchange for their holdings.

    5. Will this delisting affect the stock price of ICICI Bank?

      The long-term impact remains to be seen, but the move overall aims to strengthen the banking operations.

  • Price Action Analysis: An Easy Explainer

    Price Action Analysis: An Easy Explainer

    Price Action Analysis

    Have you ever felt the stock market is a complex puzzle with cryptic messages hidden within its charts? Price action analysis can be your decoder ring. This trading technique sheds light on the market psychology by focusing on the price movements.

    In this blog, we will delve deeper into the world of price action analysis, exploring its core principles and how you can use them to make informed trading decisions.

    Price Action Overview

    Price Action Analysis is a method for traders to understand the market by examining the movement of a security’s price over time. It is a core concept in technical analysis, though some consider it distinct because it completely focuses on price movements without relying on additional indicators.

    Price action traders concentrate on the highs, lows, openings and closings of a security’s price to identify trends, buying and selling pressures and trading opportunities.

    By analysing price movements, traders can determine whether the price is in an uptrend, downtrend, or consolidation phase.

    Traders use price action analysis to make informed decisions about entering or exiting trades.

    Evolution of Price Action Analysis

    Evolution of Price Action Analysis

    Although the exact origin of price action analysis is unclear, but we can trace its roots back to the beginning of the market analysis.

    In the early 20th century, before formal technical analysis existed, traders tracked prices on charts. This focus on price movements itself is the foundation of price action analysis.

    In the 1880s, Charles Dow, a journalist and financial analyst, laid the groundwork for technical analysis with his Dow Theory. While not purely price-action-focused, it emphasized the importance of trends and price movements.

    In the 1900s, technical indicators like moving averages and RSI started gaining prominence. While these provided additional data points, price remained a key input.

    The late 20th century made traders feel that the dependence on complex indicators was detracted from understanding the price. This led to a renewed focus on price action analysis as a distinct approach.

    Since then, the rise of online trading platforms and advanced charting software has made price action analysis more accessible to individual traders.

    How to use Price Action Analysis

    • Remove clutter from your charts. Get rid of technical indicators such as RSI, MACD, Bollinger Bands, etc. leaving just candlesticks to focus purely on price movements.
    • Understand the concept of uptrends and downtrends to understand the overall direction.
    • Numerous price patterns emerge from the price action and can signal future movements. Some of the common examples are,
      • Reversal Patterns – Head & Shoulders, Double top/bottom, Triple top/bottom, etc.
      • Continuation Patterns – Pennants, Flags, Triangles, etc.
      • Breakout Patterns – Breakouts above resistance or below support can signal trend continuation.

    While price action is valuable, it should not be used in isolation. Consider using it alongside other confirmation methods such as volume, corporate events, news & events, etc.

    Once you have grasped these concepts, you can use price action analysis to develop a trading strategy. This entails determining entry and exit points for your trades based on identified patterns and confirmations. Remember that every trader has their own judgement and analysis.

    Advantages of Price Action Analysis

    There are several advantages of using price action in your trading strategy. A few of them are:

    • Price action focuses on the core element of the market, i.e., price itself. This can be easier to learn and understand.
    • It can be applied to almost all the markets and asset classes, regardless of the underlying security or economic factors. In forex trading, most of the traders use Price Action analysis as there are no fundamentals in the forex market.
    • Price Action highlights trends which allow traders to position themselves according to the prevailing trend.
    • Understanding support, resistance levels, and critical concepts in price action analysis can help traders set stop-loss orders to manage risk.
    • Unlike some technical indicators that may become outdated as markets evolve, price action analysis focuses on the fundamental concept of price movements, making it a timeless approach.

    Disadvantages of Price Action Analysis

    • Interpreting pricing trends is subjective, which is a disadvantage. It is highly likely that traders can evaluate the same price activity and come to different conclusions, which can lead to missed opportunities or even bad trades if misinterpretations occur.
    • Price patterns are not perfect predictors; they may generate false signals, which can lead to wrong trades. This can be frustrating and result in losses.
    • Price movements can be influenced by short-term factors and random noise, making it challenging to distinguish between genuine signals and fleeting fluctuations. This can lead to confusion and difficulty in making clear trading decisions, particularly in short time frames.
    • Price action analysis focuses solely on price movements and ignores other important factors that can affect markets, such as fundamental company analysis, economic data and news events. These factors can also affect prices and should be considered for a well-rounded analysis.
    • Past price movements do not necessarily dictate future outcomes. Markets can be unpredictable, and unexpected events can cause price movements to deviate from expected patterns.

    Read Also: What is Price Action Trading & Price Action Strategy?

    Conclusion

    Price action analysis offers a valuable lens for understanding the market. However, it is just one piece of the trading puzzle. You can strengthen your trading decisions by combining it with other technical analysis methods, such as RSI, MACD, Moving Averages, etc., and sound risk management strategies.

    Moreover, to accurately spot patterns using price action analysis, it needs time and effort. New traders may require assistance interpreting the charts correctly.

    As you gain experience, you will develop your own analytical edge and become more confident in navigating the ever-changing market landscape.

    If you’re facing difficulty in Risk Management, check out our blog – Risk Management in Trading

    Frequently Asked Questions (FAQs)

    1. What is a Price Action analysis?

      In Price Action analysis, you look at price movements on charts to identify trends, support/resistance levels, and trading opportunities.

    2. What do price action traders focus on?

      The price action traders focus on Candlestick patterns and analyse how price interacts with past highs and lows.

    3. Is price action challenging to learn?

      The core concepts are relatively simple, but mastering it takes time and practice.

    4. Do I need special software for price action analysis?

      There is no requirement of a special charting software. Any charting platform that shows historical price data will work for Price Action analysis.

    5. Is price action analysis good for day trading or long-term investing?

      It can be applied to both, depending on the specific patterns and timeframes used. However, the shorter the time frame, the higher the chances of generating noise, which may create issues in identifying trends.

  • Chart Patterns All Traders Should Know

    Chart Patterns All Traders Should Know

    When analyzing trading charts, certain formations appear repeatedly. Traders use these to identify potential trading opportunities. In this article, we’ll explore various chart patterns crucial for understanding the Indian stock market.

    What is a Chart Pattern?

    A chart pattern is a specific formation on a price chart that is repeated over time. By studying these patterns, traders attempt to predict future price movements based on historical outcomes. However, it’s important to note that past performance does not guarantee future results.

    Types of Chart Patterns

    Chart patterns can be broadly categorized into three types:

    Continuation Patterns
    These patterns indicate that the current trend will continue. Examples include flags, pennants, and triangles.

    Reversal Patterns
    These suggest that the current trend is likely to change direction. Examples include double tops, double bottoms, and head and shoulders.

    Bilateral Patterns
    These patterns indicate that the market could move in either direction, often due to increased volatility. Examples include symmetrical triangles.

    Read Also: What are Candlestick Patterns? Overview and Components

    Common Chart Patterns in Technical Analysis

    1. Ascending and Descending Staircases
      These are basic chart patterns that indicate a clear trend. An ascending staircase shows a market moving upward with higher highs and higher lows. Conversely, a descending staircase indicates a downward trend with lower lows and lower highs.
    2. Ascending Triangle
      An ascending triangle is formed when a horizontal resistance line meets an ascending support line. It usually signals a continuation of an uptrend.
    3. Descending Triangle
      A descending triangle occurs when a horizontal support line meets a descending resistance line. It typically indicates a continuation of a downtrend.
    4. Symmetrical Triangle
      This pattern forms when two trend lines converge symmetrically. It can signal a continuation of the current trend or indicate potential volatility leading to a breakout in either direction.
    5. Flag
      Flag patterns are short-term continuation patterns that resemble a small rectangle sloping against the prevailing trend. Bullish flags slope downwards, while bearish flags slope upwards.
    6. Wedge
      Wedge patterns are similar to flags but have converging trend lines. A rising wedge is a bearish signal, while a falling wedge is bullish.
    7. Double Top
      A double top is a bearish reversal pattern that appears after a significant uptrend. It consists of two peaks at roughly the same level, signaling a potential downtrend.
    8. Double Bottom
      A double bottom is a bullish reversal pattern seen after a significant downtrend. It features two troughs at similar levels, indicating a possible upward trend.
    9. Head and Shoulders
      This is a bearish reversal pattern with three peaks: a higher central peak (the head) flanked by two lower peaks (the shoulders). It signals a trend reversal from bullish to bearish.
    10. Rounded Top and Bottom
      These patterns are reversal signals. A rounded top suggests a shift from an uptrend to a downtrend, while a rounded bottom indicates a transition from a downtrend to an uptrend.
    11. Cup and Handle
      This bullish continuation pattern resembles a cup with a handle. The cup forms a rounded bottom, followed by a smaller consolidation (handle) before a breakout.

    How to Trade Using Chart Patterns

    Confirm the Pattern
    Wait for a pattern to confirm itself by watching for a breakout in the expected direction. Volume indicators can help confirm the validity of a pattern.

    Set Stop Loss
    Always set a stop loss to manage risk. Place it at a level where the pattern is deemed to have failed.

    Choose a Profit Target
    Determine a profit target based on the height of the pattern. For instance, if a flag pattern has a height of 50 points, set a profit target 50 points beyond the breakout level.

    Read Also: Best Options Trading Chart Patterns

    Conclusion

    Understanding and recognizing chart patterns can significantly enhance your trading strategy in the Indian stock market. By identifying these patterns, you can make informed trading decisions and better manage risks. Remember, while chart patterns provide valuable insights, no pattern is infallible, so always use risk management strategies.

    FAQs

    1. What is the most successful chart pattern?

      The most successful chart pattern can vary, but many traders consider the head and shoulders pattern to be one of the most reliable.

    2. Which chart pattern is most powerful?

      The head and shoulders pattern is often considered the most powerful due to its strong predictive nature for trend reversals.

    3. What is the most accurate trading pattern?

      The double bottom pattern is often seen as highly accurate, especially for identifying bullish reversals.

    4. Which chart style is best for trading?

      Candlestick charts are generally considered the best for trading due to their detailed representation of price action.

    5. Which is the most accurate chart?

      Candlestick charts are regarded as the most accurate for technical analysis and trading decisions.

    6. How many types of chart patterns are there?

      There are three main types of chart patterns: continuation, reversal, and bilateral patterns.

    7. How many types are chart patterns?

      There are three types of chart patterns: continuation, reversal, and bilateral.

    8. What is the most successful chart pattern?

      The head and shoulders pattern is often cited as the most successful chart pattern.

    9. Which chart is best for trading?

      Candlestick charts are widely considered the best for trading.

    10. How many types of charts are there in the stock market?

      There are four main types of charts used in the stock market: line charts, bar charts, candlestick charts, and point-and-figure charts.

    11. How to use a chart pattern?

      To use a chart pattern, identify the pattern on the chart, confirm it with volume and other indicators, set a stop loss, and determine a profit target based on the pattern’s size.

    12. Which chart pattern is best for trading?

      The head and shoulders pattern is often considered the best for trading due to its reliability.

    13. What is the chart pattern strategy?

      The chart pattern strategy involves identifying specific patterns on price charts, confirming them, and making trades based on the predicted price movement.

    14. Are chart patterns enough for trading?

      While chart patterns are valuable, they should be used in conjunction with other technical indicators and risk management strategies for effective trading.

    15. How to read a chart in trading?

      To read a chart in trading, understand the basic components such as price action, timeframes, and volume, and identify patterns and trends.

    16. What is a chart pattern analysis?

      Chart pattern analysis involves studying historical price movements to identify patterns that predict future price movements.

    17. What is charts analysis?

      Chart analysis, or technical analysis, is the study of price charts to forecast future price movements based on historical data.

    18. How do you make a chart analysis?

      To make a chart analysis, select a chart type, identify trends and patterns, use technical indicators for confirmation, and interpret the data to make trading decisions.

    19. What are the three types of chart patterns?

      The three types of chart patterns are continuation patterns, reversal patterns, and bilateral patterns.

    20. Why are chart patterns important?

      Chart patterns are important because they help traders predict future price movements and make informed trading decisions based on historical price behavior.

  • What is T+0 Settlement : Overview And Benefits

    What is T+0 Settlement : Overview And Benefits

    In the evolving world of financial markets, every second counts. From traders seeking to capitalise on fleeting opportunities to investors aiming to swiftly reallocate their portfolio. Efficiency in transaction execution is crucial. This demand has fuelled the evolution of settlement systems in India and the much-awaited T+0 settlement is here, revolutionising the Indian trading landscape with lightning-fast transactions. But is it all sunshine and rainbows?

    In this blog, we will explore its benefits for investors along with some important considerations before you jump in.

    Overview

    T+0 settlement refers to a system where trades in shares are settled on the same day they occur. In simpler terms, when you buy a stock, the shares are transferred to the buyer, i.e., your demat account and the seller receives the money immediately.

    SEBI is launching T+0 in a beta version. This allows brokers to offer it optionally alongside the existing T+1 system in India.

    Did you know?

    As of April 2024, China is the only country with T+0 trade settlement cycle.

    If we look back at history, the settlement cycle in the Indian stock market was shortened from T+5 to T+3 in 2002 and then further to T+2 in 2003. In 2021, Sebi introduced the T+1 settlement cycle in a phased manner, which was fully implemented from January 2023.

    Currently, India operates on a T+1 settlement cycle, where trades are settled on the next business day.

    With the introduction of the T+0 settlement, sellers will receive their money right away, and buyers get the shares they purchase on the same day. This allows for greater liquidity, flexibility, and faster settlement; allowing traders to react to the market movements more quickly.

    It is a pilot program, launched on March 28, 2024, and applies to 25 stocks initially.

    T+0 Settlement will happen in two phases:

    1. In the first phase, an optional T+0 settlement cycle for trades till 1:30 pm is envisaged, with the settlement of funds and securities to be completed on the same day by 4:30 pm.
    2. In the second phase, an optional immediate trade-by-trade settlement will be carried out for trades till 3.30 pm.

    According to SEBI, a shorter settlement cycle can improve efficiency and transparency for investors, while strengthening the risk management for clearing corporations and the entire stock market system.

    Operational Guidelines for T+0 Settlement

    Overview of T+0

    1. Eligible Investors

      All investors can participate if they meet the requirements fixed by the Market Infrastructure Institutions (MIIs) like depositories and exchanges. These requirements could involve factors like risk management capabilities and transaction timelines.

      2. Trade Timings

        Currently, T+0 trading happens in a single session from 9:15 am to 1:30 pm.

        3. Price Band

          To manage volatility, T+0 trades occur within a price range of +/- 100 basis points compared to the T+1 market price for the same security. This range will be adjusted whenever the T+1 market price moves by 50 basis points.

          4. Index Calculation and Settlement Price Computation

            Trades happening within the T+0 settlement won’t influence index calculations or final settlement prices. Additionally, there won’t be a separate closing price specifically for T+0 trades.

            Furthermore, the only method of early payment for T+0 sell obligations will be through the use of a locking mechanism. T+0 will not accept early payment via pool or regular pay-in instructions.

            5. Fees/ Charges

              All the charges/fees like Transaction Charges, STT, and Regulatory Turnover Fees that are applicable for T+1 settled securities will be applicable for T+0 settled securities.

              Other key Points

              • T+0 trades are separate from T+1 trades. There is no netting of obligations between the two cycles.
              • T+0 trade prices will not be reflected in market indices or settlement price calculations, and separate closing prices won’t be determined based solely on T+0 trades.
              • There won’t be any Trading in T+0 settled securities on the following days:
              1. On the Ex-date of any corporate action in the corresponding T+1 settled securities (including the scheme of arrangement).
              2. On the day of the index rebalancing of the corresponding T+1 settled securities.
              3. On the settlement holiday.

              List of Stocks

              As of April 2024, there are a total of 25 stocks available in T+0 settlement cycle:

              Name of the Company
              Ambuja Cements LimitedLIC Housing Finance Limited
              Ashok Leyland LimitedMRF Limited
              Bajaj Auto LimitedNestle India Limited
              Bank of BarodaNmdc Limited
              Bharat Petroleum Corporation LimitedOil & Natural Gas Corporation Limited
              Birlasoft LimitedPetronet Lng Limited
              Cipla LimitedState Bank of India
              Coforge LimitedTata Communications Limited
              Divi’s Laboratories LimitedTrent Limited
              Hindalco Industries LimitedUnion Bank of India
              The Indian Hotels Company LimitedVedanta Limited
              Jsw Steel LimitedLtimindtree Limited
              Samvardhana Motherson International Limited

              Read Also: What is Zero Days to Expiration (0DTE) Options and How Do They Work?

              Benefits for Investors

              Benefits of T+0
              1. With immediate access to funds, investors can react more quickly to market fluctuations. They can sell a stock and use the proceeds to buy another one right away, potentially capturing short-term gains.
              2. The increased ease and speed of transactions under T+0 could lead to higher trading volumes, benefitting investors who enjoy active trading.

              Let us understand the T+0 settlement with the help of an example:

              Consider a scenario where an investor buys 100 shares of company named “Pocket” through an online brokerage platform. With T+0 settlement, the transaction is processed immediately, and the investor’s trading account is debited for the buy amount + transaction charges while the shares are simultaneously credited to the buyer’s demat account.

              Similarly, the seller’s trading account is credited with the proceeds from the sale instantly upon execution, and the shares are debited from the demat account.

              Conclusion

              To sum it up, T+0 settlement offers investors a faster and more dynamic trading experience, particularly those focused on short-term strategies. The quicker access to funds and reduced settlement risk can be beneficial for navigating the volatile markets and capitalising on fleeting opportunities.

              However, investors should also be aware of the potential drawbacks, such as the possibility of increased volatility and the need for stricter discipline to avoid impulsive trades. It is also important to keep in mind that T+0 is a relatively new concept and there may be some unforeseen challenges. Investors should carefully consider the risks before actively trading in a T+0 environment.

              Read Also: What are T2T (Trade to trade) stocks?

              Frequently Asked Questions (FAQs)

              1. Is T+0 suitable for all investors?

                While beneficial for day traders and short-term investors, it might not suit everyone because of higher volatility.

              2. What are some drawbacks of T+0 settlement?

                Some drawbacks are that higher transaction volume might result in increased volatility, and pressure to make decisions more quickly, which can result in impulsive trades and possible technical issues from clearing houses.

              3. How many securities are available for T+0 settlement in the Beta phase?

                A total of 25 securities are available in T+0 settlement as of April 2024.

              4. Who can trade in the T+0 settlement?

                All members eligible to trade in the Capital Market Segment shall be able to trade in T+0 settled securities.

              5. I have traded in T+0; can I change the settlement type?

                No. Orders for T+0 and T+1 settled securities are executed in separate series.

              Disclaimer: The securities, funds, and strategies mentioned in this blog are purely for informational purposes and are not recommendations.

            1. Open Free Demat Account

              Join Pocketful Now

              You have successfully subscribed to the newsletter

              There was an error while trying to send your request. Please try again.

              Pocketful blog will use the information you provide on this form to be in touch with you and to provide updates and marketing.