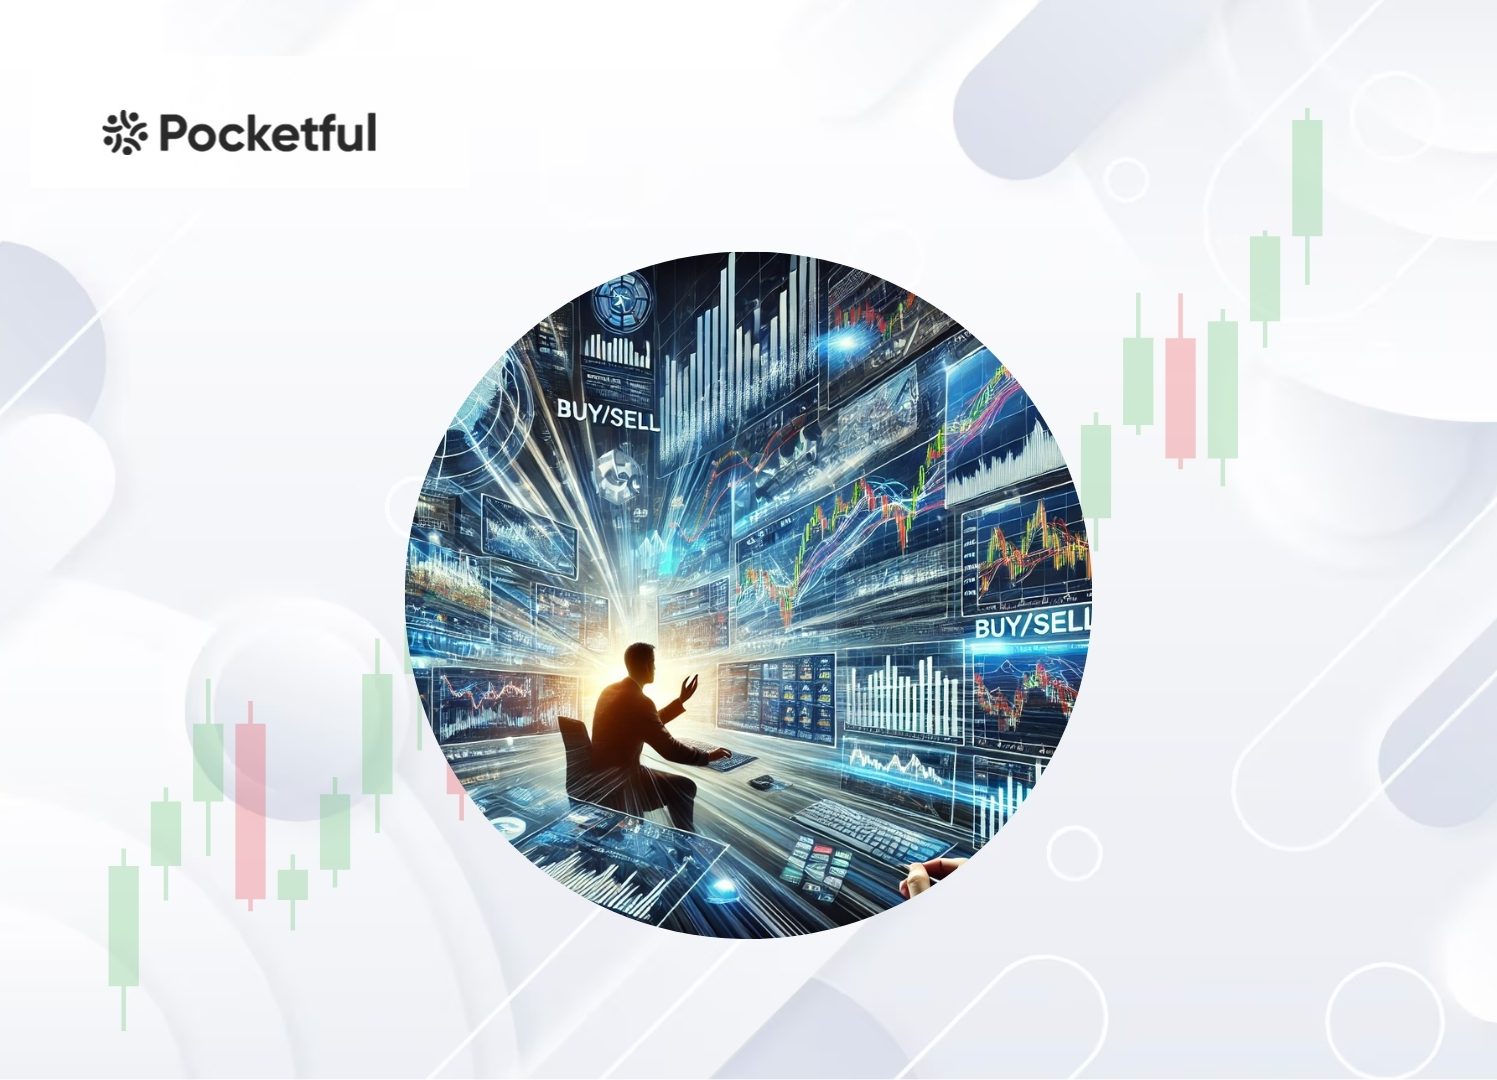
Hoping to maximize your trading potential in 2026? A broker providing high leverage can give you the upper hand in trading by maximizing your profit potential. If you are looking for high leverage brokers, then this blog is for you.
In this blog, we will provide you with an overview of the brokers in India that offer the highest leverage, enabling you to maximize your profits.
What is Margin and Leverage in the Stock Market?
When you hear traders talking about “margin” and ‘leverage’, they are talking about the facility to create a trading position in excess of what they own. Let’s explain this in simpler terms.
Margin is the total amount of capital you are required to put up with your broker as a security deposit to initiate a position larger than the value deposited. It’s sort of similar to a down payment. For instance, if you want to buy shares worth ₹1,00,000, but your broker only requires a margin of ₹20,000, that means in this case, you are borrowing 80,000 from the broker.
Leverage is the ratio that is often depicted as a multiplier of your buying power. For instance, 5x, 10x, and even 20x. In this case, when brokers provide 10x leverage, it means you can trade with ₹100,000 by only putting ₹10,000 in your trading account. But keep in mind the cons, while leverage can increase your profit margins, your losses as well can increase at the same speed.
Highest Intraday Leverage Brokers in India – Equity (MIS)
Here’s a comparison of brokers offering the highest intraday leverage in India:
| S.NO. | BROKER | Intraday Leverage |
|---|---|---|
| 1 | Pocketful | Up to 5x |
| 2 | HDFC Securities | Up to 5x |
| 3 | Zerodha | Up to 5x |
| 4 | 5paisa | Up to 5x |
| 5 | TradeSmart | Up to 5x |
| 6 | Stocko | Up to 5x |
| 7 | Tradejini | Up to 5x |
| 8 | Upstox | Up to 4x |
| 9 | Groww | Up to 4x |
| 10 | Kotak Securities | Up to 4x |
Broker with the Highest Leverage for Equity Delivery
Leverage offered can be particularly high with certain brokers in India, often bringing to mind intraday trading. However, many traders don’t trade intraday and wish to hold onto their trading positions a little longer, usually for a few days or longer. In these cases, features like Equity Delivery with MTF or Margin Trading Facility are very useful.
While brokers offer a leverage of 5x for equity intraday trading, the leverage offered by MTF is lower. Since you are holding stocks for longer than just a trading day, there is more risk for brokers. Many top brokers provide Margin Trading Facilities (MTF) which enable investors to purchase and retain shares by making only partial upfront payments.
Read Also: Top Trading Apps in India
Overview of Top 10 Margin Broker Platforms in India
1. Pocketful
Pocketful is a relatively recent brokerage platform that provides trading services in equities, commodities and derivatives.
Leverage: Up to 5x on equity intraday trading.
MTF Interest Rate: The MTF Interest Rates are slab-based as shown below:
- Up to ₹1,00,000 – 5.99% p.a. (0.0164% per day)
- ₹1,00,001 to ₹25,00,000 – 14.60% p.a. (0.04% per day)
- Above ₹25,00,000 – 16.00% p.a. (0.0438% per day)
Key Highlights: Pocketful is an upcoming discount stockbroker with an easy to use platform and innovative features that makes investing and trading easier.
Use our Margin Trading Facility Calculator
2. HDFC Securities
HDFC Securities is a full-service brokerage platform backed by HDFC Bank. It offers a wide range of trading and investment services including equity, futures & options, commodities, derivatives, and mutual funds.
Leverage: Up to 5x on equity delivery
MTF Interest Rate:1% per day (~12.00% p.a.)
Key Highlights: Provides reliable research, advisory services, and a robust trading platform suitable for both beginners and experienced traders.
3. Zerodha
Zerodha is India’s largest retail stockbroker, known for its user-friendly Kite trading platform and transparent pricing. This is a leading platform that deals in mutual funds, derivatives, stocks etc.
Leverage: Up to 5x on over 1,100 stocks.
MTF Interest Rate: 0.04% per day (~14.6% p.a.).
Key Highlights: Provides a seamless MTF trading experience through its Kite platform.
4. 5paisa
5paisa is a tech-driven discount broker offering a wide array of financial products, including stocks, mutual funds, and insurance. With transparent pricing, constant innovation, easy user experience and cutting edge technology, 5paisa is among the top 10 discount brokers in India.
Leverage: Up to 5x via MarginPlus.
MTF Interest Rate: Starts at 0.06% per day (~21.9% p.a.) if net worth is below ₹5 lakhs, with interest rates decreasing based on net worth.
Key Highlights: Offers slab-wise interest rates, benefiting high-net-worth traders.
5. TradeSmart
TradeSmart is a subsidiary company of VNS Finance that has over 20 years of track record and inculcates the same principle of trust & transparency. This discount brokerage firm offers trading services across equities, commodities, and currencies.
Leverage: Up to 5x on select stocks.
MTF Interest Rate: Details not publicly disclosed.
Key Highlights: Provides competitive leverage options; users should get in touch with their team for specific MTF rates.
6. Stocko Online
Stocko is a low-cost brokerage firm offering trading services in equities, commodities, and currencies. It is now known as Stocko with more exciting offers and easy to use interface.
Leverage: Up to 4x via Equity Plus.
MTF Interest Rate: Specific rates not publicly listed.
Key Highlights: Offers margin funding through its Equity Plus program; users are advised to contact the broker for detailed rates.
7. Tradejini
Tradejini is a discount brokerage firm offering trading services across various segments, including equities, stocks and derivatives.
Leverage: Up to 4x on eligible stocks.
MTF Interest Rate: Not publicly disclosed.
Key Highlights: Provides margin trading facilities; users should reach out directly for specific interest rates.
8. Upstox
Upstox is a tech-based brokerage company providing investing options such as stocks, mutual funds, and gold.
Leverage: Up to 4x on selected stocks.
MTF Interest Rate: ₹20 per day for every ₹40,000 borrowed.
Key Highlights: Offers a flat-fee MTF structure, simplifying cost calculations for traders.
9. Groww
Groww is an investment platform that started out with mutual funds and has now added stocks, ETFs, and fixed deposits to its offerings.
Leverage: Up to 4x on eligible stocks.
MTF Interest Rate: 0.043% per day (~15.75% p.a.) for amounts below ₹25 lakh; 0.027% per day (~9.75% p.a.) for amounts above ₹25 lakh.
Key Highlights: Provides competitive rates for higher investment amounts.
10. Kotak Securities
Kotak Securities is a brokerage company offering a full range of broking services. The company is associated with the Kotak Mahindra Group, offering a wide range of investment services.
Leverage: Up to 4x on select stocks.
MTF Interest Rate: 0.028% per day (~10.22% p.a.).
Key Highlights: Offers competitive interest rates with flexible holding periods for MTF positions.
Margin Trading: Essential Tips and Best Practices
Some of the essential tips when trading on margin are mentioned below:
- Timely Position Closure: When using intraday margin trading also called margin intraday square off (MIS), you can hold your positions for a single trading day only. You must close all your trades before market close or 3:20 PM for most brokers. If you forget to square off your position, the broker does offer an automatic closure option on your behalf.
- Broker Intervention: They Can Act for You – If you’re rapidly losing money on your position and your margin account dips into a negative balance, your broker has the authority to close the position without consulting you. This is called a margin call or forced liquidation.
- Risk Management: Higher leverage means higher risk – yes, profit potential increases significantly with leverage- but losses are amplified too. That’s precisely why employing a stop-loss order is crucial when engaging in margin trading.
- Interest Charges Accumulate Over Time: When you utilize leverage or the Margin Trading Facility (MTF) for delivery trades, your broker charges interest for the funds borrowed. Based on the platform, this might be in the range of 12% to 18% per annum.
- Regulatory Warnings: Always keep yourself updated, the margin rules are overseen by the Securities and Exchange Board of India (SEBI) and are subject to change. For instance, in the last few years the peak margin rules have increased the minimum leverage clients can use during intraday trading.
Read Also: 10 Best Paper Trading Apps in India
Discount Brokers, What Are They Up To?
Until a few years ago, full-service brokers seemed to be the only players offering MTF for delivery trades, but some discount brokers are also coming in. For example:
- Pocketful: The Pocketful app provides a streamlined investing approach for users, supporting investing for beginners. They offer 5x intraday leverage on equities and their MTF facility is expected to be launched soon with an attractive interest rate which will be at par or better than the industry.
- 5paisa: They support MTF where interest rates are quite reasonable, especially under premium plans.
- Angel One: They now support MTF with the ability to pledge existing stocks as margin.
- Groww: This broker has some of the lowest interest rates in MTF, but their interest rates vary based on the amount taken as loan.
Key Takeaways
For traders who prefer to hold their positions for longer than a day, delivery trading with MTF can make things easier. However, one should always consider the interest rate, approved stock list, and risk management prior to deciding on the platform.
While a high leverage broker could bring tremendous value, they are not limited to the amount of leverage a trader uses; it quickly becomes a question of safety, affordability, and overall flexibility of the experience.
Choosing the Right Broker for Margin Trading
The key features mentioned below can help you choose the right broker when it comes to margin trading:
- Leverage Offered: Leverage is a trader’s best friend if the trader has a profitable strategy, but it also comes with the potential risk of greater losses. Using leverage and creating a position that fits with your risk management rules is essential.
- Interest Rates: Not all brokers have the same interest rates for Margin Trading Facility (MTF). Interest rates for MTF vary across brokers and can significantly impact your trading costs. Selecting brokers with lower rates will reduce your borrowing cost and increase your profits.
- Platform Experience: Trading becomes even better with a user-friendly and simple platform. Many traders look for ease when it comes to trade execution, real-time market data, customizable dashboards, and quick order placements.
- Customer Support: A good customer support team helps resolve client issues with ease and instantly. This is extremely important in stock markets where trades are constantly done at an elevated pace.
- Regulatory Compliance: It is advisable to confirm that the broker is registered with SEBI. This gives assurance that regulations are complied with and improves the investor trust.
Read Also: Lowest MTF Interest Rate Brokers in India | Top 10 MTF Trading Apps
How to Create a New Account in Pocketful
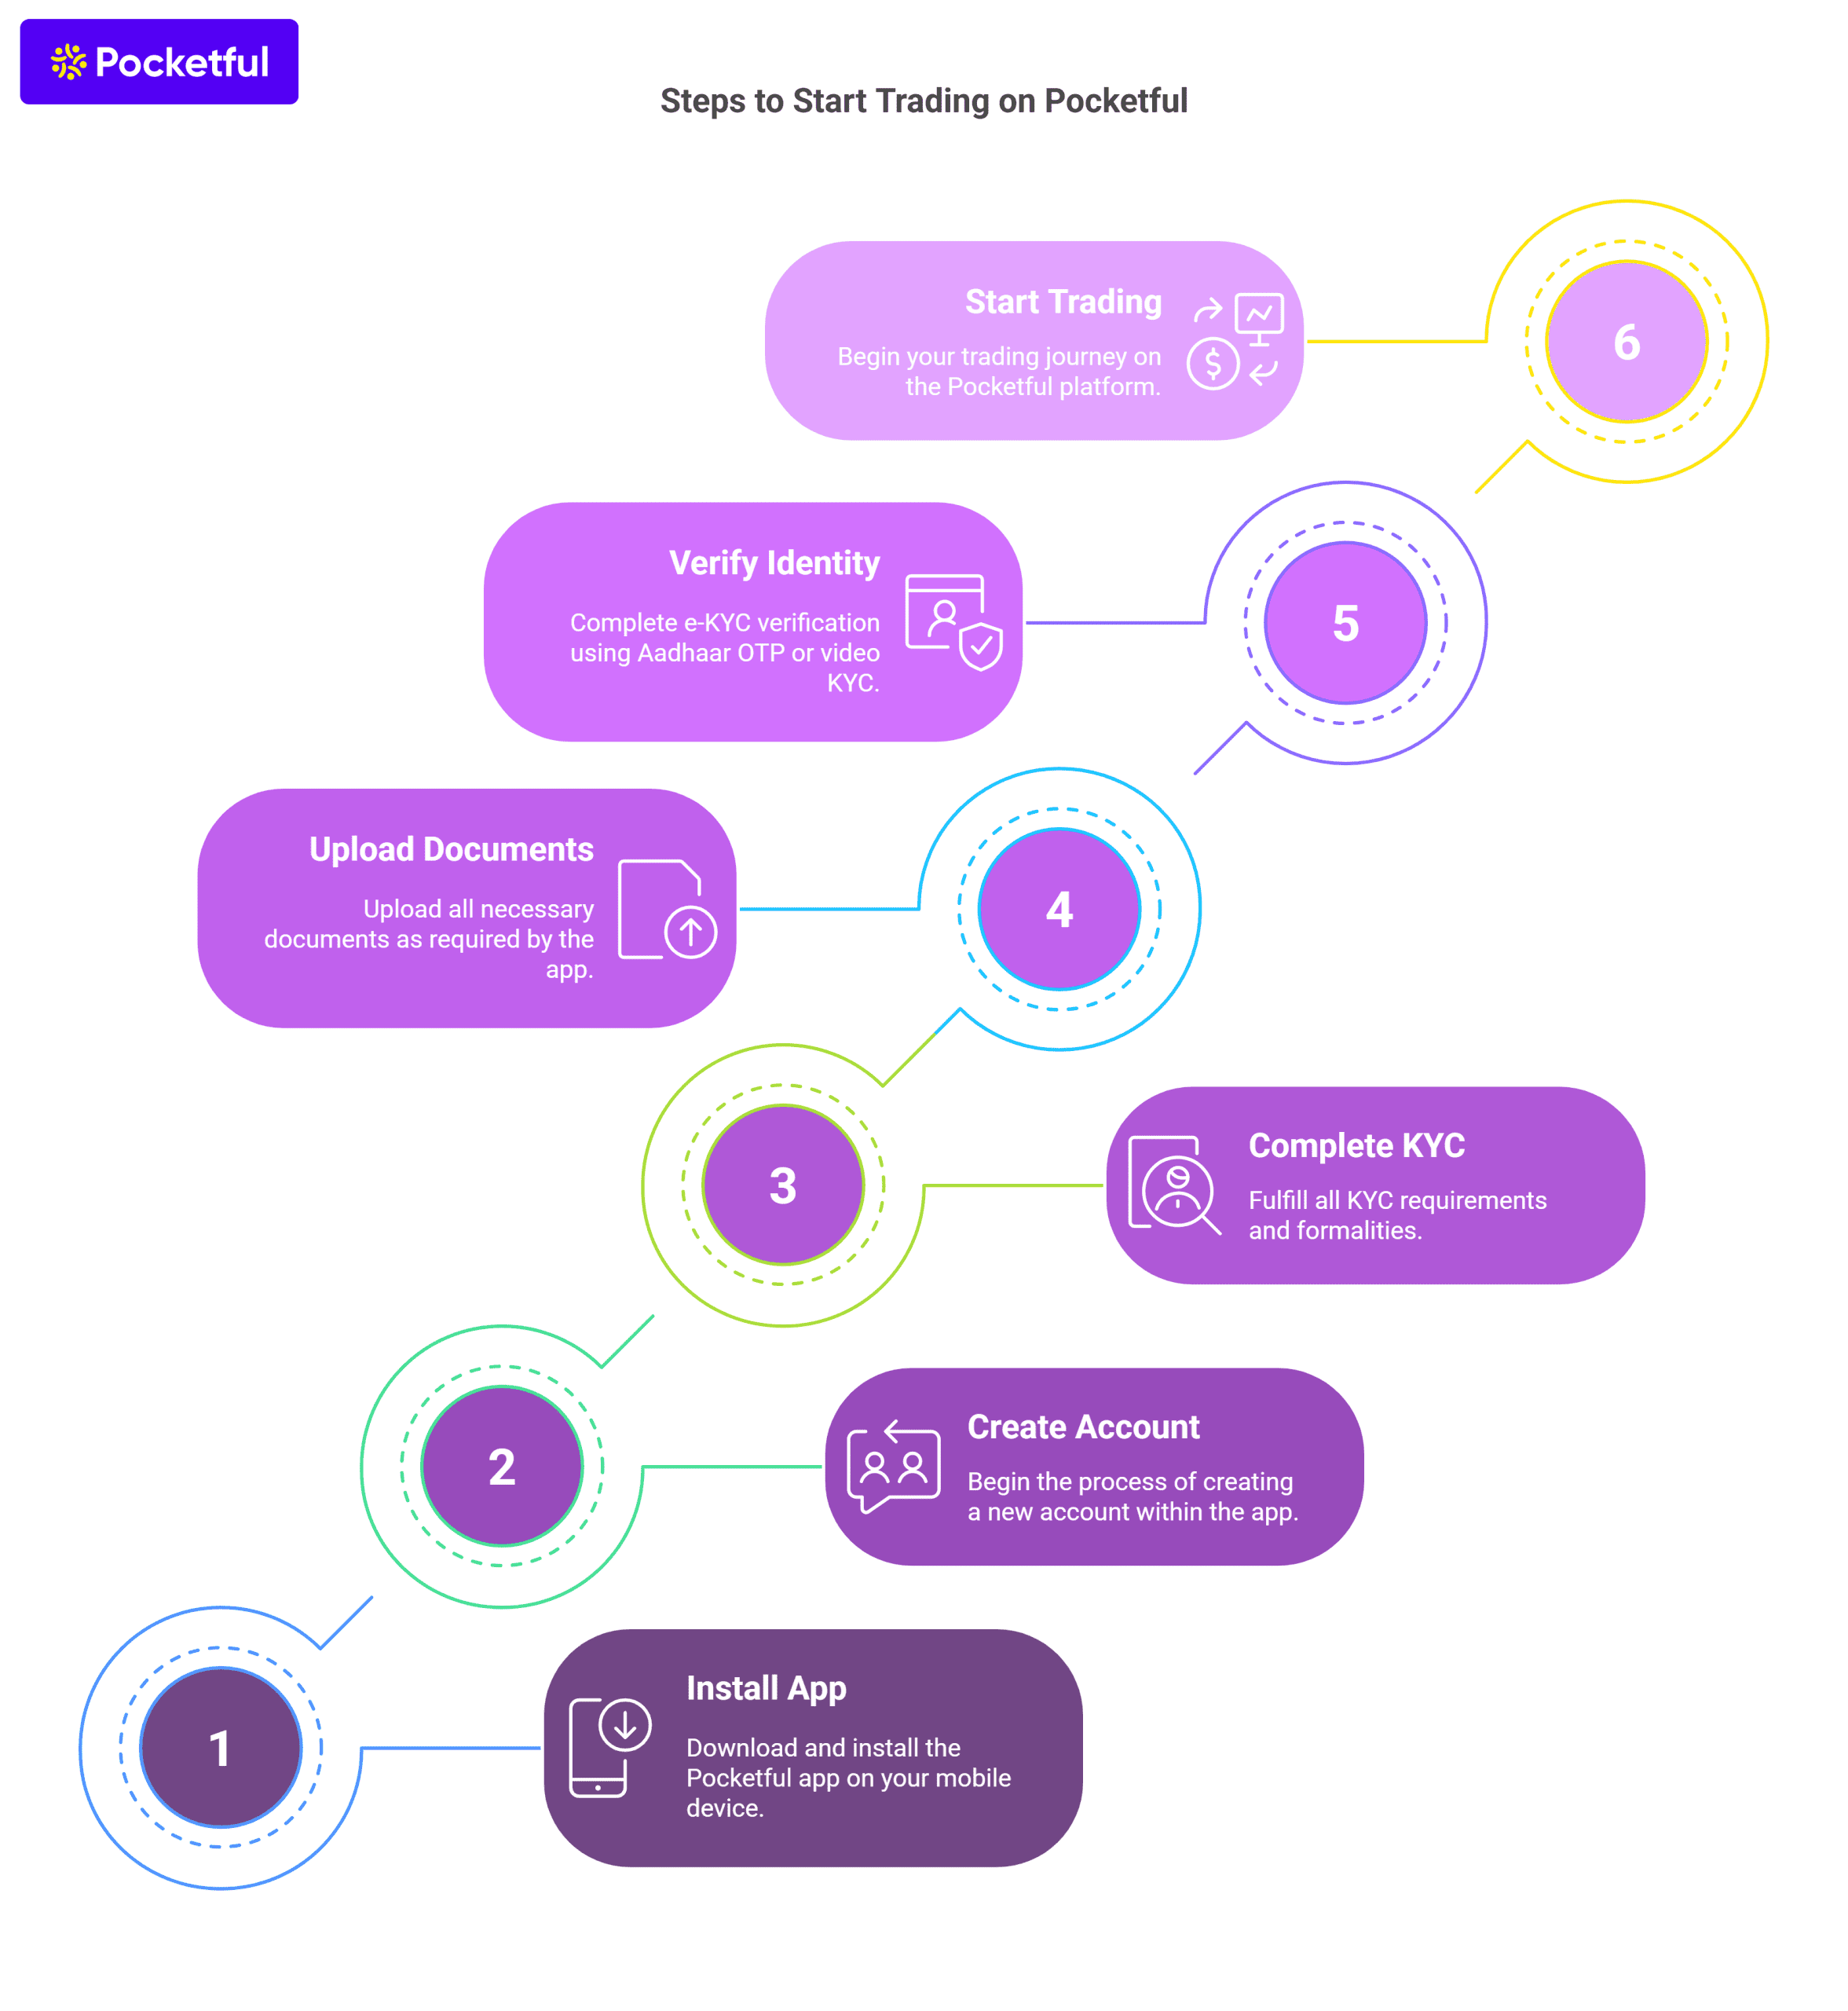
You can easily create a new account with Pocketful by following the steps mentioned below:
- Install the Pocketful App on your mobile device.
- Proceed to Create Your New Account
- Finish the KYC (Know Your Customer) Requirements & other formalities
- Upload required documents
- Complete e-KYC verification by Aadhaar OTP or short in-person video KYC. Upon successful verification, your Demat account and trading account is opened and you can then begin your trading journey.
The whole process is streamlined and often takes only a couple of minutes to finish.
Read Also: Top 10 Option Trading Books in India
Conclusion
The single most important element to consider in margin trading is leverage. While it can significantly increase the potential profits, it can place an equal magnifying effect on losses incurred. The expenses tied to margin trading interest on the borrowed money, commissions, and the dreaded margin calls are just as important to consider. The reliability of a broker is an equally important element for successful margin trading. A good broker provides high leverage with reasonable MTF interest rates, responsive customer service, and easy to use platform.
To conclude, successful margin trading seeks equilibrium between opportunity and risk. Conduct a deep dive study of various brokers, understand their offering’s margin accounts, terms, and most importantly, trade within your personal limits. It’s vital to note that trading on margin does not guarantee instant wealth; instead, it serves as a powerful tool that supports trading if managed adeptly. Nonetheless, if mismanaged, traders will experience huge losses. That said, always trade responsibly and stay updated.
| S.NO. | Check Out These Interesting Posts You Might Enjoy! |
|---|---|
| 1 | What is MTF (Margin Trading Facility)? |
| 2 | Difference between Margin Trading and Leverage Trading |
| 3 | Top Tips for Successful Margin Trading in India |
| 4 | What is Intraday Margin Trading? |
| 5 | Margin Against Shares: How Does it Work? |
Frequently Asked Questions (FAQs)
Which brokers are projected to have the highest leverage in equity intraday in India for 2026?
There are multiple brokers who provide substantial leverage in 2026 such as Pocketul, Zerodha, Rupeezy etc. offering up to 5x leverage for equity intraday trading.
Is higher leverage always better for trading?
This is not always the case. Higher leverage can undoubtedly enhance the profit potential, but at the same time, the losses can be devastating. High leverage is best suited to sophisticated traders who have a solid grasp of risk management. For novices, it is advisable to begin with lower leverage.
Are there any risks involved in using margin trading?
Absolutely, there is always a risk of getting a margin call, having your reading position liquidated, and suffering severe capital loss. Therefore, it is essential to keep a close eye on the trading positions and use leverage judiciously.
Do all brokers offer the same margin for all stocks?
No, a broker’s internal policy determines the margin offered. Some of the key factors that influence margin terms are stock volatility, segment (equity, F&O, commodity), and even SEBI regulations also impose restrictions.
What should I check before choosing a high-leverage broker?
Traders must try to find a broker that offers a perfect combination of high leverage, low MTF interest rates, and reliable platform. Also consider if the broker offers MTF on delivery trades or offers it solely for intraday trades.