Category: Trading

  • What is the Flag and Pole Pattern?

    What is the Flag and Pole Pattern?

    There are plenty of technical patterns in the stock market, but it can be challenging for traders to recognize a trustworthy chart pattern that can help them make the best decisions and increase their profits.

    To make things easier, we will introduce the “Flag and Pole Pattern” to you in this blog.

    Flag and Pole Pattern

    The Flag and Pole pattern is a technical analysis pattern traders use to determine a stock’s trend. In general, this pattern resembles a flag flying from a pole. It denotes a notable shift in price in the pole phase followed by a consolidation phase forming a shape similar to a flag. 

    Features of Flag and Pole Pattern

    Features of Flag and Pole Pattern

    The essential features of the flag and pole pattern are as follows-

    1. The continuation pattern indicates a price movement in the direction of the one shown in the pole phase, whether upside or downside.
    2. There will be a consolidation phase in the pattern observed in the flag part.
    3. Traders generally use it for short-term trading.
    4. This pattern provides you with valuable insight into market behaviors. 

    Read Also: What Is the Pennant Chart Pattern?

    Pattern Formation by the Flag and Pole

    There are majorly four qualities of the pattern formed by this technical analysis tool:

    1. Prior Trend – The term “prior trend” describes a stage in which the security price exhibits a sudden movement before the consolidation period. It represents the initial stages of development of a flag and pole pattern. 
    2. Consolidation Phase – This chart pattern phase functions as a flag segment within the flag and pole pattern. It occurs following the stock price’s initial directional change. 
    3. Volume Shift—This pattern simultaneously witnesses an increase in volume at first, followed by a slight fall in volume in the flag phase, and then a significant jump in stock volume once the price breaks out of the consolidation period. 
    4. Breakout – Breakout is the pattern’s last section. It is possible to observe the breakout in either an upward or downward direction in bullish and bearish pole phases, respectively.

    Types of Flag and Pole Patterns

    There are two types of flag and pole pattern-

    A. Bullish Flag

    This pattern, sometimes called an aggressive flag and pole pattern, sees a rise in stock prices during the initial phase before entering the consolidation phase. A bullish flag pattern is formed when there is an upside breakout within the flag followed by a consolidation phase followed by a breakout above the upper trendline of the flag and rising further. 
    Bullish Flag and Pole Pattern Image
    Bullish Flag  and Pole Pattern

    B. Bearish Flag

    This happens following a downward price movement and consolidation. The price typically increases during the consolidation phase and forms an upward-sloping channel. The security’s price forms a bearish flag pattern before breaking the support level and heading lower. 

    Bearish Flag and Pole Pattern Image
    Bearish Flag and Pole Pattern

    Precautions Taken by Traders

    Traders can utilize the flag and pole pattern after carefully examining the following facts: 

    1. To trade, one must be patient and wait for the pattern to finish. By doing this, the trader guarantees that the stock has completed the consolidation phase and is prepared for a breakout. 
    2. The investor should monitor the stock’s volume throughout the pattern; a drop in volume indicates a pattern weakness, while an increase in volume during the breakout confirms pattern completion. 
    3. Investors should evaluate the market’s overall state before trading. Any breakout may be misleading if the market does not support the trend. 
    4. A trader should review the support and resistance levels before the transaction.
    5. Since these patterns are only beneficial in short-term trades, a proper stop loss should be established near the support level for the bullish flag and resistance level for the bearish flag, and regular profit booking should also be carried out. 

    Read Also: What Is Head And Shoulders Pattern?

    How to Identify the Flag and Pole Pattern?

    How to Identify the Flag and Pole Pattern?

    A flag pattern can be affirmed using a stock’s volume. In a bull flag, volume is often highest during the first part of the upswing, declines as the market consolidates and rises again when the breakout happens. Usually, these patterns develop during a protracted upward trend. The lack of volume increases the probability that the trend will resume, which indicates that the retracement is less strong than the first gain. The stock price might not retreat during the consolidation phase but instead stay flat. To validate a flag chart pattern, wait for the original trend to reappear before initiating your position.  

    What Is the Target for the Flag and Pole Pattern?

    The height of the pattern’s pole is often measured and added to the pattern’s breakout point to determine the target for the flag and pole pattern. But before making any trades based on this pattern, one should think about a stop loss. 

    Read Also: Best Options Trading Chart Patterns

    Conclusion

    The flag and pole pattern is considered one of the most dependable tools in technical analysis. It is appropriate for traders to determine whether the stock price continues in a possible trend or not. However, even after correctly recognizing the pattern, trading profits are not a certainty. For this reason, as a trader, one must always have a stop loss on all transactions and combine this pattern with other patterns to reinforce the logic behind the trading decision. 

    Frequently Asked Questions (FAQs)

    1. How can I identify the pole in the flag and pole pattern?

      A flag and pole pattern’s pole can be distinguished by its vertical price movement, which often denotes a brief price increase or fall followed by a consolidation phase.

    2. How can a trader choose to invest based on flag and pole pattern?

      When the breakout from the flag phase happens, a trader can enter the transaction. Additionally, one should set a stop loss at the flag’s low (high) when the trend is upward (downward).

    3. What are the different types of flag and pole patterns?

      There are two types of flag and pole patterns: one is bearish, and the second one is bullish.

    4. As a trader, can I rely on flag and pole patterns?

      This pattern is considered dependable when the trader waits for the completion of the pattern and has a suitable stop loss in place.

    5. How long does a flag and pole pattern continue?

      The pattern typically lasts for no more than two to three weeks.

  • Breakout Trading: Definition, Pros, And Cons

    Breakout Trading: Definition, Pros, And Cons

    Did you know there is a way for traders to make money when security breaks through support or resistance levels? In this blog, we will cover Breakout Trading in depth, including its method, pros, and cons.

    What is Breakout Trading?

    Traders who do breakout trading look for price levels that security has not been able to break through before and take advantage of the significant price changes that happen when the price does. In simple terms, Breakout trading is spotting the trend when a stock price breaks through the key level, like a resistance or support point. These levels are like roadblocks that the price struggles to pass, but when it finally passes through, it often triggers significant price movements, giving traders a chance to cash in. Price history, technical signs, and chart trends are often used to find such breakout points.

    Strategy of Breakout Trading

    Strategy of Breakout Trading

    Spotting Support and Resistance: On the chart, you need to find crucial support and resistance levels. The support level acts as the floor and the resistance acts as the ceiling. Look for the places where the price of the security has bounced back multiple times.

    Keeping an eye out for breakouts: Always monitor the price of the securities for possible breakouts. Look for price changes that go beyond the established levels of support or resistance, along with a rise in trading volume and momentum.

    Stop-Loss: Always place stop-loss orders to manage risks. This will help to limit potential big losses. Make a proper execution plan considering the risk-reward ratio and stick to it.

    Profit Targets: The profit target needs to be set based on parameters such as distance between the support and resistance levels, volumes & momentum, market sentiments, etc.

    Pros of Breakout Trading

    1. Clear Exit & Entry Points: Breakout trading provides clear exit and entry points, which makes it easier for traders to execute trades.
    2. Potential for significant gains: Traders can make substantial money when they correctly spot a breakout. The breakouts can lead to significant price movements, offering the potential for large profits.
    3. Suitable for different time frames: The breakout strategy can be adapted to different time frames, whether you are an intraday or swing trader. The swing traders use daily or weekly charts, while intraday traders focus on minute or hourly charts.
    4. Simple to understand & implement: The Breakout strategy can be used by traders of all experience levels as it relies on basic chart analysis and can be enhanced with other technical indicators, that are simple to understand and implement.
    5. Universal Application: Traders can make use of the Breakout strategy across all asset classes, such as equities, currencies, commodities, etc., as it relies solely on price action.

    Cons of Breakout Trading

    1. False Breakout Signals: Dealing with false breakouts is one of the biggest challenges in breakout trading. A fake breakout happens when the price moves beyond a key level but quickly reverses, which results in a loss. If a false breakout is not managed properly, it can be frustrating and costly.
    2. Large Losses: If there are chances of a huge profit, then there are also chances of large losses if the breakout fails. It is suggested that stop-loss orders be set to avoid significant drawdowns.
    3. Constant Attention: Breakout trading often needs constant market tracking, due to the fast price changes, which can be cumbersome and time-consuming for many traders.

    Tips for Breakout Trading

    Tips for Breakout Trading
    1. Using Multiple Indicators: By using multiple other technical indicators for confirmation, you can enhance your breakout strategy. Other indicators such as Bollinger bands, moving averages, MACD, relative strength index (RSI), etc. can help validate the strength of a breakout.
    2. Risk Management: Develop a proper entry and exit plan before initiating a trade and rigidly follow the plan. Further, it is suggested to use stop-loss to protect your capital.
    3. Keep yourself updated: Stay up to date with the market news and events that can impact the price movements of the overall market or securities you want to trade.
    4. Trading Journal: Record your trades, including entry and exit points, stop-loss levels, profit targets, and the rationale behind each trade, and review your journal regularly. It will help you learn from your successes and mistakes.

    Read Also: Descending Triangle Pattern in Stock Trading

    Conclusion

    In summation, the Breakout trading is a powerful strategy that, when used properly, may provide substantial profits. With its clear entry and exit points, it has the potential to generate significant gains. Traders may increase their chances of success by learning what breakout trading is, putting a well-defined strategy into practice, and being aware of its benefits and drawbacks.

    Breakout trading takes patience, discipline, and ongoing learning, just like any other trading approach. As everything in this world has two sides, breakout trading also carries certain limitations. You must be careful about the risks that come with it.

    Despite the risks, breakout trading can help you achieve your objectives and capitalize on market opportunities when combined with other technical analysis tools and risk management techniques. Whether you are new to trading or looking to diversify your strategies, breakout trading is worth considering to capture market moves.

    Frequently Asked Questions (FAQs)

    1. What is breakout trading?

      In breakout trading, traders wait for a security’s price to break through important support or resistance levels, indicating a potential move in one direction.

    2. What do you mean by a breakout in simple terms?

      In a breakout, a stock’s price surpasses a support or resistance level, accompanied by increased trading volume, which signals a potentially significant move in that direction.

    3. What are the benefits of breakout trading?

      There are many benefits of breakout trading, such as the chance to make substantial profits, clear entry and exit spots, and the ability to profit from strong market trends.

    4. What risks are there in breakout trading?

      One of the risks in breakout trading is false signals, which happen when the price returns to the initial price after breaking a key level.

    5. Is breakout trading good for beginners?

      Although newbies can use breakout trading, they must learn to find key levels, trading nuances, and proper risk management. Further, it is suggested that virtual trading be started first and gradually start with real money.

  • Marubozu Candlestick Pattern: Means, History & Benefits

    Marubozu Candlestick Pattern: Means, History & Benefits

    Have you ever thought about how traders predict market movements using price action? It’s because of the patterns formed by the candlesticks. Understanding candlestick patterns is like having a secret tool for getting good at trading.

    In this blog, we will learn about the Marubozu candlestick pattern. Market participants use many patterns, but the Marubozu candlestick is one of the best at showing strong upward or downward movements.

    Overview

    Before we begin, a thorough understanding of Candlesticks is important. We have written a blog on the same; you can read it here: What are Candlesticks Charts?

    Have a look at the green and red candlestick below:

    Coming to the Marubozu candlestick pattern, it is an important indicator in technical analysis. It offers valuable insights into market sentiment and price action. We will explore the significance of Marubozu candlestick pattern, its implication in both bullish and bearish scenarios, and how traders can analyze it to make informed choices.

    What Is Marubozu Candlestick Pattern?

    A Marubozu candlestick is a type of candlestick with no shadow or wicks. This pattern is named after the Japanese word “Marubozu,” which means “bald” or “shaven,” which indicates the absence of shadows on the candlestick. It consists of a single, long body and signifies a powerful and definitive price movement throughout a trading period. When there is no upper or lower shadow, it suggests that the opening and closing prices were high or low in the session, which signifies the amount of buying and selling pressure.

    History of Marubozu

    Munehisa Homma developed the Marubozu Candlestick pattern back in the 18th century. He was a successful rice trader who predicted market trends using historical price data. The word “Marubozu” means “shaven head” indicating a candlestick with no shadow and showing strong buying or selling power. A bullish Marubozu, which closes at the period’s high and has no shadow, indicates strong buying. A bearish Marubozu that closes at a period’s low with no shadow indicates strong selling pressure.

    In 1991, the Marubozu patterns became popular in the world through Steve Nison’s book “Japanese Candlestick Charting Techniques,” and are now widely used to identify market trends and potential reversals.

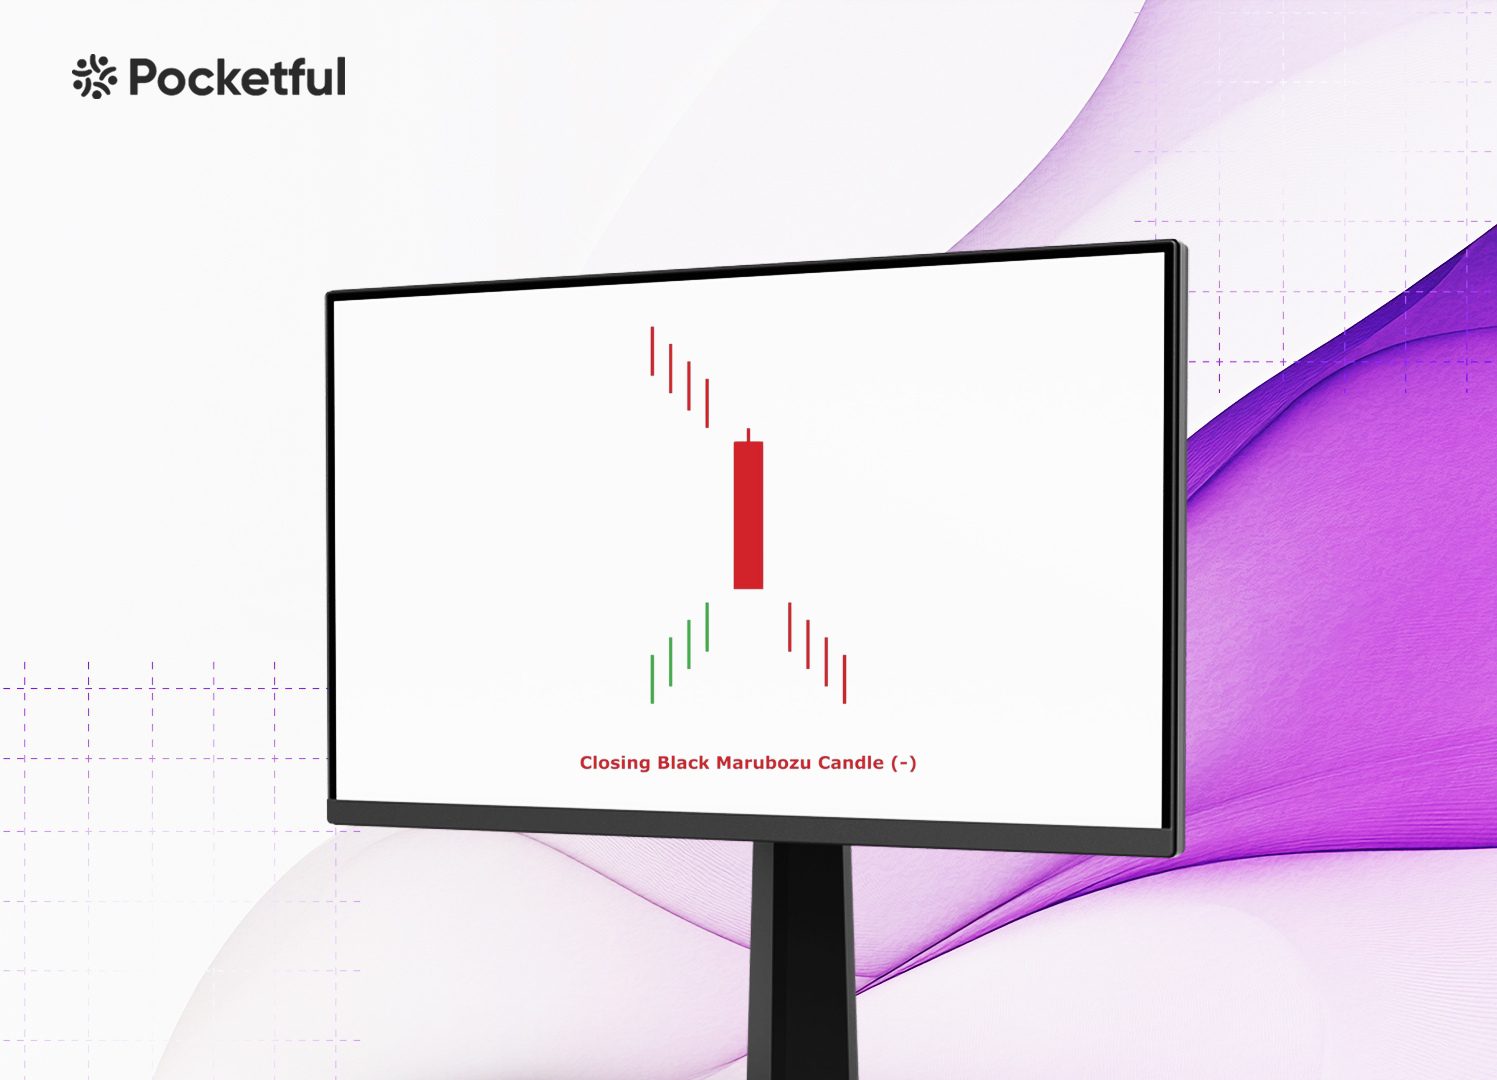
    Read Also: Closing Black Marubozu Candle

    Characteristics of a Marubozu Candlestick

    1. No shadow: In the Marubozu candlestick pattern, there is an absence of lower and upper shadows.
    2. Long body: The body of a candle stick is long, reflecting significant price movement during the trading session.
    3. Bullish and Bearish Marubozu: When the price opens at a low and closes at a high of the session, it is Bullish Marubozu. However, when the price opens at a high and closes at a low of the session, it is bearish Marubozu.

    Bullish Marubozu

    When the opening price is the same as the low and the closing price is the same as the high for a certain trading session, it signifies a bullish Marubozu pattern. Buyers were in charge of the whole session in this trend.

    Implications of Bullish Marubozu

    1. Strong buying pressure: When a shadow is absent, it means that the buyers have dominated the session, continuously driving the price higher.
    2. Continuation of Uptrend: A bullish Marubozu, in an uptrend, shows that the trend is likely to continue as buyers maintain their momentum.
    3. Potential Reversal: A bullish Marubozu, in a downtrend or a consolidation phase, can indicate that the market sentiment is shifting from bearish to bullish.

    Bearish Marubozu

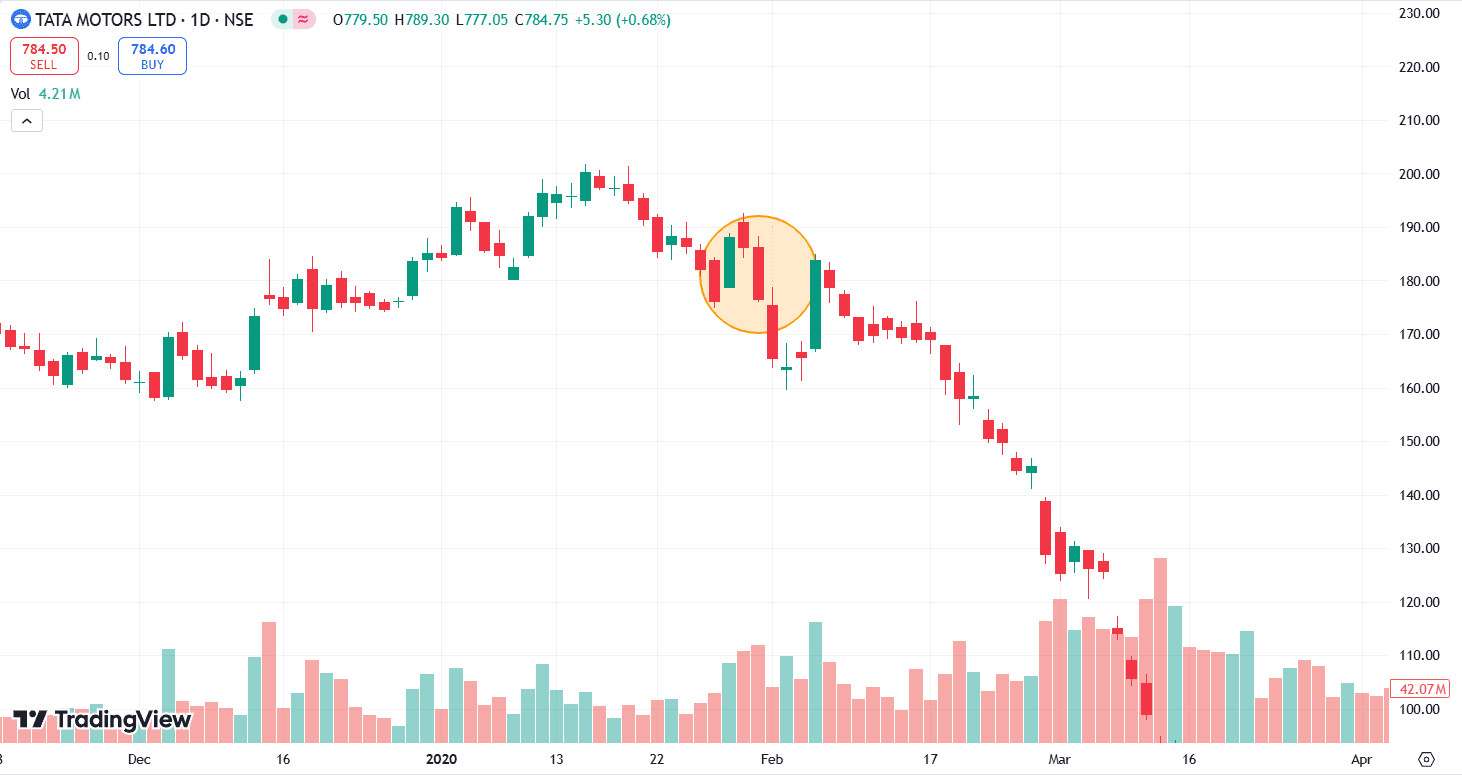
    If the beginning and closing prices for a certain trade session match the high and the low, this signifies a bearish Marubozu pattern. The price closed to the day’s low with no lower wick, indicating significant selling pressure during the trading session.

    Implications of Bearish Marubozu

    1. Strong selling pressure: When a shadow is absent, it means that sellers have dominated the session, continuously driving the price lower.
    2. Continuation of a downtrend: A bearish Marubozu, in a downtrend, shows that the trend is likely to continue as sellers maintain their momentum.
    3. Potential Reversal: A bearish Marubozu, in an uptrend or a consolidation phase, can signal a potential reversal, indicating that the market sentiment is shifting from bullish to bearish.

    Benefits of the Marubozu Pattern

    1. Clear and decisive signals: The good thing about Marubozu patterns is that they are easily understandable. When there is no shadow, it means there is no room for confusion. This gives traders clear and decisive signals about the market direction.
    2. Strong emotions of the market: Whether bullish or bearish, the sentiments of the market can be seen in Marubozu formations. This helps traders determine market sentiments and execute trades that fit the mood.
    3. Flexibility in different periods: From minute charts to weekly charts or even monthly charts, the Marubozu patterns can be used at different time frames. As they can be used in multiple time frames, they are useful for all kinds of traders, from day traders to long-term investors.
    4. Universal Application: Traders can make use of Marubozu patterns across all asset classes, such as equities, currencies, commodities, etc.

    Risks and Limitations of Marubozu Candlestick Pattern

    Risks and Limitations
    1. False signals: Marubozu patterns generally create strong signals, but don’t always work. When markets are sideways (not moving much), the possibility of false signs will increase. Further, the shorter the time frame, the higher the chances of getting false signals.
    2. Dependence on other factors: Sometimes traders make bad trading decisions because they rely solely on the Marubozu patterns and do not consider other technical indicators and analysis. Therefore, other technical indicators and research tools such as RSI, moving averages, volume analysis, etc., should always be used as a backup.

    Read Also: White Marubozu Pattern

    Conclusion

    In summation, if you’re a newcomer or an experienced trader, the Marubozu candlestick pattern is useful as it clearly indicates the sentiment of underlying. Traders can make use of Bullish and Bearish Marubozu patterns to improve their trading methods and make informed decisions.

    However, for a strong confirmation and to avoid false signals, it is advisable to use Marubozu patterns along with other technical indicators and tools such as volume analysis, support and resistance levels, overall sentiments, macro indicators, etc.

    Frequently Asked Questions (FAQs)

    1. How can the Marubozu pattern be used?

      Marubozu patterns are used to identify strong market trends and potential reversal points, and can often be combined with other technical indicators for confirmation.

    2. Why are there no shadows on a Marubozu candlestick?

      It is because in Marubozu, the price opens at one extreme (high or low) and closes at the other extreme, showing consistent movement in one direction.

    3. Can a Marubozu pattern appear in any time frame?

      Yes, it can appear at any time frame, from minutes to months, making it a convenient tool for different trading styles.

    4. Should the Marubozu pattern be used alone for trading decisions?

      Well, it is suggested to use the Marubozu pattern with other technical indicators to increase the reliability.

    5. What is the difference between a Marubozu and other candlestick patterns?

      Other candlestick patterns may have shadows, but Marubozu candlesticks have no shadows, indicating strong unidirectional market sentiments.

  • What is Price Action Trading & Price Action Strategy?

    What is Price Action Trading & Price Action Strategy?

    Did you know there is a simple yet powerful concept in trading that focuses solely on the movement of price over time to gauge market sentiments?

    We are talking about Price Action Trading, which primarily focuses on trends, chart patterns, candlestick patterns, and major historical price movements to gauge market sentiments. Candlestick patterns help to identify the relationship between buyers and sellers over a period of time by analyzing the open, close, high, and low prices of the candlestick.

    What is Price Action Trading?

    Price action in trading analyses the price performance of a security, index, commodity, or currency to predict the future. If price action analysis tells us that the price is about to rise, one might want to take a long position, or if one believes that the price action is signaling a negative trend, one might choose to initiate a short trade.

    Merits of Price Action Trading

    • Simple to understand: This is its biggest advantage; candlestick patterns can be observed on the charts without the need for any complicated technical indicators. Candlesticks itself give the signal of trend change; it’s confirmation or buying and selling signals. Along with that, a few other chart patterns can be observed with a wider time frame, that candlesticks make to give mid to long-term signals like Double bottom, Rounding bottom, Head & Shoulders, etc.
    • Easily accessible: Price Action uses only candlesticks which are easily accessible in charts as compared to complicated indicators.
    • Without any Lag: All the technical indicators have some lag before generating signals, but Candlesticks move in sync with the price movement.
    • Develop Independent thinking: As this method needs close observation and analysis, it engages traders’ analytical and critical thinking skills to make informed trading decisions.
    • Universal Application: Traders can make use of price action across all asset classes such as equities, currencies, commodities, etc.

    Limitations of Price Action Trading

    • Not for all markets: Price action is not a perfect method in all market conditions.
    • Time Consuming: Interpretation of candlesticks can be more time consuming as compared to technical indicators because it relies on traders understanding and skills to interpret the patterns accurately. This can impact the decision-making.
    • No automation: In price action, most of the traders do manual execution as it is difficult to deploy fully automated price action strategies. This can lead to emotional bias, which eventually hampers the profitability.

    Strategies Used in Price Action Trading

    Strategies used in Price Action Trading

    A pattern is formed by a group of candles over a certain period of time that creates a unique shape and carries a specific meaning. Such patterns help traders analyze the behavior of buyers and sellers during the formation of the pattern and predict the future direction of price movements.

    There are various price patterns that traders should keep an eye on, including Double-bottom and Triple bottom patterns, head and shoulders patterns, cup and handle patterns, wedge patterns, pennants, triangle patterns, and more.

    However, correctly identifying these patterns requires traders to have a good understanding of each pattern and observe price charts on different time frames.

    Read Also: Price Action Analysis: An Easy Explainer

    Best Price Action Trading Strategies

    There are numerous Price Action strategies, but learning each one can be challenging. To simplify things, we’ve explained a few key strategies below for your convenience.

    1. Hammer

    Hammer

    The hammer candlestick pattern, which consists of a short body and a long wick, is found at the bottom of a downward trend.

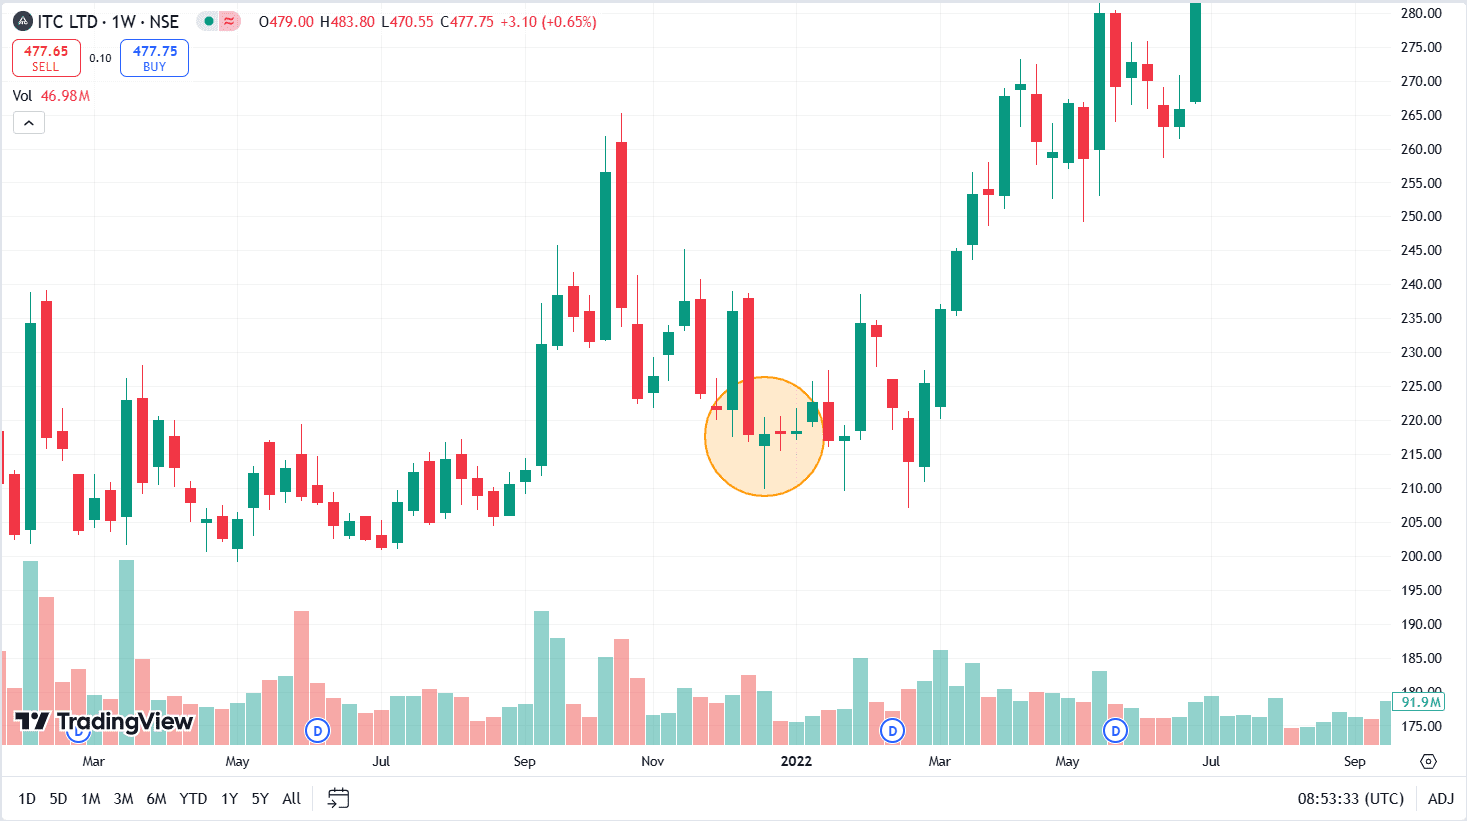
    The colour of the body can vary, but green hammers indicate a stronger bull market than red hammers. If the pin bar/hammer pattern has a long lower tail, this tells the trader that there has been a trend of lower prices being rejected, which implies that the price could rise from here. Generally, the next day is the confirmation day, and if the next day’s price crosses the high of Hammer, then a strong buy signal is generated. Stop loss is the low of Hammer, the entry point is a bullish breakout above Hammer’s high and can continue with the trend till it gets any reversal signal.

    2. Bullish Engulfing

    Bullish Engulfing

    The bullish engulfing pattern is formed by using the two candlesticks. The first candle is a short red body which is completely engulfed by a larger green candle. That’s called bullish engulfing. It signals a potential trend change from down to up, so the next day, even if the price opens a little bit lower, it will be a buying opportunity as bulls are in control and will push the price higher eventually.

    The reversal of Bullish engulfing is Bearish engulfing, which occurs after an uptrend.

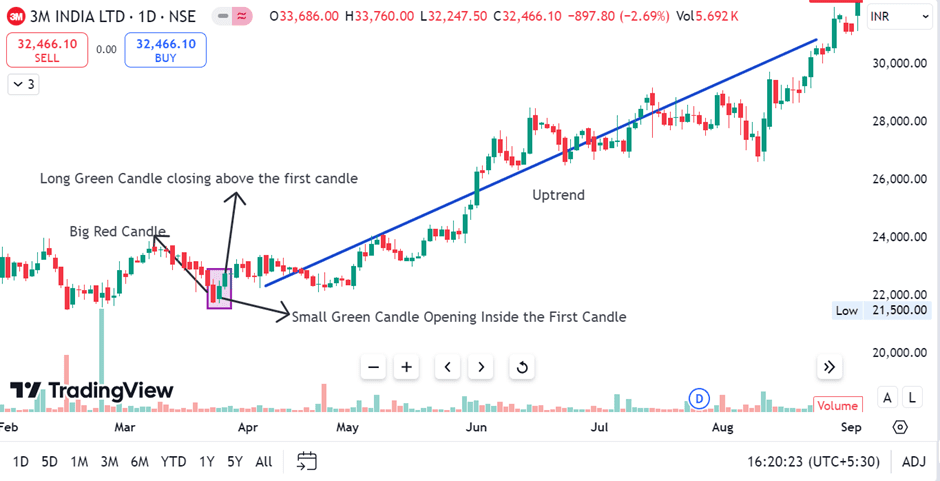
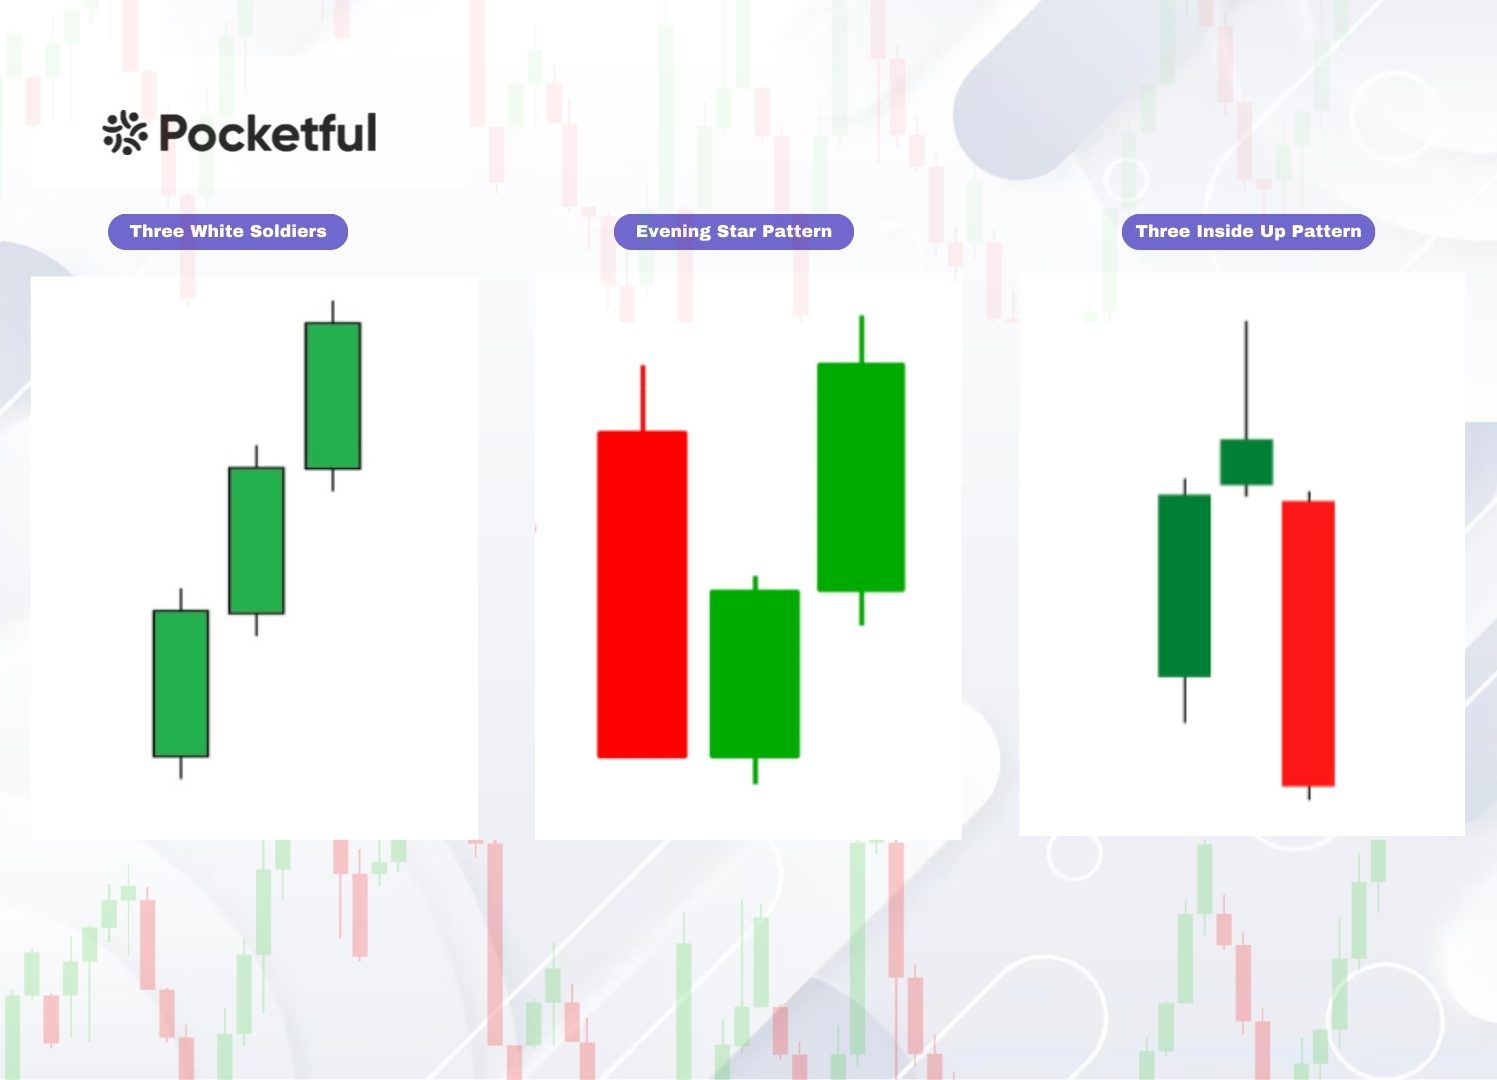
    3. Three White Soldiers

    Three White soldiers

    It is a very strong bullish signal that occurs after a downtrend. It’s a three-candle pattern and consists of consecutive long green candles with small wicks and long bodies, which open and close progressively higher than the previous day. The potential direction is up.

    In contrast, the reversal of Three White Soldiers is Three Black Crows, which signals a strong bearish trend after an uptrend.

    4. Hanging man

    Hanging man

    The hanging man is a bearish pattern and it’s the opposite of a hammer. It has the same shape as of a hammer but forms at the end of an uptrend, so, it’s a bearish signal. It indicates that there was a significant sell-off during the day. The large sell-off is often seen as an indication that the bulls are losing control of the market. The next day, a lower close confirms the downtrend. One can continue with the short trade till get any reversal.

    5. Head and Shoulders Pattern

    Head and Shoulder Pattern

    As the name suggests, the head and shoulders pattern is a market movement that looks a bit like the head and shoulders. The head and shoulders trade is one of the most popular price action trading strategies as it’s relatively easy to choose an entry point (generally near the neckline after the breaking of the shoulder) and set a stop loss around or above the left shoulder and set the target at the downside till the length of the head.

    A similar pattern can be reversed, called reverse head and shoulder. It works as a bullish signal and gives upside targets.

    How to Trade Using Price Action

    Traders can follow below mentioned steps to trade using price action:

    • Identify the asset class and market you want to trade.
    • Analyze the patterns and trends.
    • Decide whether to go long or short.
    • Build a trading plan, for e.g., entry price, exit price, risk reward ratio, stop loss levels, etc.
    • Execute the trade, monitor the position, and make a timely exit.

    Conclusion

    Price action trading is a powerful tool used by traders all around the world across different markets. It provides a systematic way to analyze the market and gives the direction to initiate a trade. Traders look out for price action signals for the emergence of a trend.

    Unlike technical analysis, the Price Action focuses on the price itself and not on other indicators. The more expert a trader will be, the more likely repeated patterns of behavior from buyers and sellers can be found out and traded upon. 

    Following a set of price action trading rules is important to achieve consistent performance. Always be mindful of the risks involved in trading and make decisions accordingly. Further, for new traders, it is suggested to do paper trading at the initial stages; this will allow them to trade in a virtual environment until they get the confidence and clarity to go live.

    Frequently Asked Questions

    1. Is Price Action Trading Relevant?

      Yes, it’s relevant as it is used to understand the price action and involves looking at the patterns and identifying the key indicators.

    2. What do you mean by Price Action Analysis?

      Price action is the process of analyzing historical price trends to forecast the direction of prices in the future. It is generally done by analysing the candlestick patterns, which show the relationship between buyers and sellers in a given time period.

    3. Is Price Action Trading Good for Beginners?

      Yes, price action is suggested to beginners as it is a good starting point for understanding the market through historical trends and predicting future market movements based on that.

    4. Are there any strategies involved in Price Action Trading?

      Yes, there are a number of different price action methods that traders use to predict market movements, like Head & Shoulder, Hanging Man, etc.

    5. What are Candlesticks Patterns?

      Candlestick patterns help traders to identify the relationship between buyers and sellers over a period of time by analyzing the candlestick’s open, closed, high, and low prices.

  • Momentum Investing: Meaning, History, Types & Advantages

    Momentum Investing: Meaning, History, Types & Advantages

    Have you ever seen an unexpected spike in the price of a stock? After seeing it, everyone seems to rush in like it’s a bar fight over the final slice of pie. That is an oversimplified idea of momentum investing. 

    Momentum investing is the practice of purchasing stocks experiencing an upward price trend and selling those experiencing a downward price trend. Making money off of current market trends is the aim. Utilizing the current trends in the industry is a part of the procedure. This strategy is based on the idea that stocks that have performed well historically will continue to do so going forward.

    What is Momentum Investing?

    When you trade based on momentum, the idea is “buy high, sell higher”. It comes from the idea that assets that have done well in the past will continue to do well in the coming future. People often use this approach because they’ve seen that stocks that have done well in the last three to twelve months tend to keep doing well, and stocks that have been doing poorly tend to continue doing poorly.

    History of Momentum Investing

    The concept of momentum investing is not new. Its origins can be traced back to the 19th century. Richard Driehaus is known to have modernized the strategy, emphasizing the concept of “buy high, sell higher.” Momentum investing was empirically validated by academic studies, including those conducted by Jegadeesh and Titman in the 1990s, illustrating that stocks with robust recent performance are more likely to maintain their performance.        

    What is Momentum Investing?

    Read Also: Synthetic Futures – Definition, Risk, Advantages, Example

    Momentum Investing Key Concepts 

    There are a few key concepts of momentum investing. They are explained in detail below:

    A. Price Momentum

    This investment strategy is founded on the principle of price momentum. It entails identifying assets with either upward or downward price trends over a specific period. Investors typically screen for securities with the most robust price performance in the past six to twelve months.

    B. Strength in Relationship 

    Another fundamental principle of momentum investing is relative strength. It entails comparing a security’s performance to a pertinent benchmark, such as a sector or index. Under this strategy, stocks with greater relative strength than their counterparts are considered appealing investments.

    Momentum investors frequently follow market trends to capitalize on existing price fluctuations. This involves identifying and investing in assets that are trending in a specific direction, such as an uptrend in an optimistic market. 

    Momentum Investing Strategies

    There are many momentum strategies that are used by traders to generate above-average returns. Some of them are mentioned below. 

    1. Relative Strength Strategy

    It involves ordering securities based on their past performance record, most often for a specific duration such as three, six, or twelve months. Investors subsequently select the best-performing securities and sell off the worst.

    2. 52-Week High/Low Strategy

    A stock is bought when it is close to its highest level over the past 52 weeks. Otherwise, it is sold or shorted when it is near its lowest over the same period. This strategy believes that securities approaching new peaks are more likely to continue rising due to upbeat investors’ attitudes and sustained buying pressure.

    3. Momentum Oscillators

    Technical indicators such as the Relative Strength Index (RSI), Moving Average Convergence Divergence (MACD), and Rate of Change (ROC) are used to identify momentum of stocks. These indicators can signal overbought or oversold conditions and potential trend reversals, guiding buy or sell decisions for traders.

    4. Earnings Momentum

    This strategy focuses on shares of companies that have consistently exceeded earnings expectations. Investors buy stocks of companies that have recently reported positive earnings surprises and strong earnings growth, anticipating that the momentum will continue.

    5. Sector Rotation

    This involves moving investments from one sector to another based on the relative momentum of different sectors. Investors shift their portfolios into sectors showing high performance and away from those showing low performance.

    Investors analyze price trends and trading volumes to confirm momentum. A high volume of upward price movement indicates strong buying interest and can signal to buy, while a high volume of downward price movement can signal to sell.

    Advantages of Momentum Investing

    • Opportunity to earn higher returns: Momentum buying can yield big gains, especially when the market is moving strongly. By riding the current wave of progress, buyers may be able to make money as prices continue to rise in certain assets.
    • Spreading out: Momentum investing can help more if you spread your investments across different assets that have strong momentum. This may lower risk and increase the overall return-to-risk ratio.
    • Rules and ease of use : Many buyers like momentum trading because it is easy to understand and is based on clear rules. It gives you a structured way to earn profit from current market trends.
    Advantages of Momentum Investing

    Disadvantages of Momentum Investing

    • Risk and Volatility: Due to the stock market’s extreme volatility, momentum investing can result in substantial losses during market trend reversals. The strategy may put investors at greater risk since it depends heavily on short-term price fluctuations, particularly during volatile times. 
    • High Charges for Transactions: Frequent trading may impact the total profits of momentum investing due to increased transaction expenses. For smaller investors, the strategy’s profitability may be weakened by the accumulation of trading costs.

    Read Also: Why Are PSU Stocks Falling? Key Insights and Considerations

    Conclusion 

    By taking advantage of current market movements, momentum investing is a dynamic and fascinating technique that has attracted attention due to its potential to generate substantial profits. But it comes with its own set of difficulties. Success in investing based on momentum requires careful planning, risk management, and a long-term outlook, just like any other technique. Ultimately, an investor’s risk tolerance, financial objectives, and market forecast determine whether or not they choose to use momentum investing in their investing journey.

    In summary, momentum investing is an effective strategy for navigating the financial markets. It allows investors to increase returns by giving them a framework for recognizing and taking advantage of current price trends. However, before incorporating momentum investing into your portfolio, you must thoroughly assess the risks involved and consider your unique investment goals.

    S.NO.Check Out These Interesting Posts You Might Enjoy!
    1What Are The Challenges Traders Face When Trading In The Stock Market?
    2What is Gann box: How to use, meaning and strategy
    3Delisting Of ICICI Securities : Reasons and Brief Explanation
    4Option Chain Analysis: A Detail Guide for Beginners
    5What Is The Gap Up And Gap Down Strategy?

    Frequently Asked Questions (FAQs)

    1. What is investing with momentum?

      Investing based on momentum involves performing transactions based on market trends; for example, one might buy equities that have shown an upward trend in price with the expectation that the price will climb further.

    2. How can I tell which stocks are momentum-rich?

      Use price charts, RSI, and averages to identify steady-rising patterns.

    3. When should you purchase and sell based on momentum investing?

      Based on momentum investing, you should invest in stocks while they are increasing in value but are yet to reach their peak and sell them when they start to fall in value or experience a trend reversal. 

    4. How should you diversify your portfolio?

      It is advised to have a mix of bonds, index funds, and blue-chip stocks in your portfolio, so that during economic downturns, your investments remain safe. 

    5. What kind of risks are involved in momentum investing?

      Momentum investing comes with its own set of risks, such as reduced returns due to high transaction costs, market reversals, and increased volatility.

  • What is Nifty BeES ETF? Features, Benefits & How to Invest?

    What is Nifty BeES ETF? Features, Benefits & How to Invest?

    Do you want to invest in stocks but need help choosing which ones to include? Selecting stocks can be a risky gamble. However, there’s an option that lets you invest in the top 50 companies simultaneously in India. This is possible through the Nifty BeES exchange-traded fund (ETF).

    This blog will discuss the advantages of investing in the Nifty BeES fund and how it operates.

    Understanding Nifty BeES ETF Meaning

    Nippon India Nifty BeES ETF, more commonly known as just Nifty BeES ETF, was launched in 2001 with the objective of following the Nifty 50 Index. Its name was chosen so that Nifty stood for the index it monitors, and BeES stood for the abbreviation of the Benchmark Exchange-Traded Scheme. 

    Features of Nifty BeES

    Features of Nifty BeES
    1. Like any other ETF, this is the most straightforward type of investment vehicle that allows for easy trading and investment. 
    2. Returns are aligned with the Nifty 50 index, thus allowing investors to earn a return similar to the top 50 stocks of the exchange.
    3. Nifty BeES has a lower expense ratio than actively managed mutual funds.
    4.   The invested capital stays spread throughout 50 large-cap firms, reducing risk through diversification.

    Advantages of Nifty BeES

    1. The ETF has high liquidity, thus allowing you to quickly liquidate your money whenever you want. 
    2. Given the extremely low expense ratios, they are typically considered cost-effective investment options. 
    3. The fund allows the investors to gain exposure to India’s top 50 large-cap firms by investing in Nifty BeES. 
    4. Unlike other investment options, investing in Nifty BeES gives transparency because the investor already knows where their money will go.
    5. During market hours, investors can buy and sell the units in real time. 

    Read Also: What are ETFs? Are ETFs good for beginner investors?

    How Does Nifty BeEs Work?

    How does Nifty Work?

    The Nifty BeES are funds that are managed passively. The money is invested in stocks that are part of the Nifty 50 index, and the fund aims to produce returns comparable to the index. However, it is important to know that though they invest in the Nifty 50 index, there is no assurance or guarantee that the fund will achieve its goal completely due to the presence of tracking errors.  

    How to Invest in Nifty BeES?

    Investors can invest in Nifty BeES like other stocks through a trading and demat account. It has an ISIN (International Securities Identification Number) assigned to it. Unlike mutual funds, which can be traded only at the end of the day, the Nifty BeES ETF is listed on the National Stock Exchange. An investor can buy and sell the units of the Nifty BeES ETF at any time during market hours. The dynamics of supply and demand determine the price of Nifty BeES. 

    You can hold these securities in your demat account. Investors and authorized participants can participate through units. The minimum denomination of units that can be purchased or redeemed from the AMC is 50,000 units. Investors can buy as little as one unit at a time and at the prevailing market price.

    Taxation of Nifty BeES

    Taxation of Nifty BeES

    The tax treatment of the Nifty BeES is the same as that of any other stock index fund, as they are treated like equity mutual funds. The Nifty BeES units are subject to a 15% tax on profit (Short-Term Capital Gains) if sold within a year and a 10% tax on profit (Long-Term Capital Gains) if sold after a year and with more than one lakh in profit. 

    Who Should Invest in Nifty BeES?

    If you are new to investing and lack sufficient understanding of the range of investment items on the market, you should consider investing in the Nifty BeES. The fund is known to provide the benefit of diversification as it spreads your capital among the top 50 companies listed on the exchange. 

    Additionally, an investor may want to think about this alternative if they want to invest in the equities market and are willing to pay a minor charge in expense ratios. Overall, it’s a good option for those investors who wish to gain exposure to the Nifty 50 index without going through the hassle of manually picking stocks. 

    Nifty BeES Performance

    Scheme Name1 Week1 Month3 Months6 Months1 Year3 Years5 Years
    Nippon India Nifty 50 BeES ETF 1.891.632.1414.2624.8915.9515.79
    Nifty 50 TRI2.062.52.3114.4725.4815.5915.93
     (As of 25th May 2024)

    From the return table above, the fund has provided a slightly lower return than the Nifty 50 Index. This is probably due to the presence of tracking errors. 

    Read Also: What is Nifty BeES ETF?

    Conclusion

    Nifty BeES is an exchange-traded fund that invests in the top 50 Indian firms. It provides investors with the benefits of diversification while providing a hassle-free solution to the problem of manually picking stocks. The fund is also known to provide immense liquidity, thus making it more beneficial for investors to choose. Those looking to begin their investment path may find Nifty BeES to be a suitable solution. 

    However, equity markets have drawbacks, such as high volatility and no guaranteed return. Therefore, it’s important to analyze all the pros and cons before investing thoroughly. 

    Frequently Asked Questions (FAQs)

    1. Is there any disadvantage to investing in Nifty BeES?

      A drawback to investing in Nifty BeES is that it is a passively managed fund and, hence, cannot earn more than the benchmark.

    2. Is there any lock-in period for Nifty BeES?

      Nifty BeES has no maturity dates or lock-in periods since anyone can withdraw from this plan when markets are open.

    3. Can I get a dividend while investing in Nifty BeES?

      Indeed, the fund declares dividends. Upon the announcement of dividends by the holding companies, investors are given the choice to reinvest the income or receive it in their demat account.

    4. Can I hold Nifty BeES for a longer period?

      Yes, you can hold Nifty BeES in your demat account as long as you want.

    5. What is the full form of Nifty BeES?

      BeES stands for “benchmark exchange traded scheme,” whereas Nifty refers to the index it tracks, which is the Nifty 50

  • Margin Pledge: Meaning, Risks, And Benefits

    Margin Pledge: Meaning, Risks, And Benefits

    Do you sometimes feel that your current capital is holding you back from the bigger moves in your F&O trades? If you are looking to seize new opportunities and are short on cash, then a margin pledge can be the ultimate solution.

    In this blog, we will explore margin pledge and how it affect futures and options trading. Additionally, we will also discuss the advantages and risks involved in margin pledge.

    What is Margin Pledge?

    Margin Pledge is a facility offered by brokers that allows you to use your existing securities as collateral to borrow margin for trading. With the pledged margin, traders can utilize it for Intraday equity trading, futures trading, and selling options.

    Margin Pledge overview

    You deposit your financial assets like stocks, mutual funds, or government securities with your broker. These deposited securities act as collateral. The broker then lends you a margin amount which is less than the value of the pledged securities because of Haircut.

    Here is a breakdown of the key points:

    Haircut

    It simply means the difference in asset price given for collateral and amount provided by the lender as collateral.

    Suppose, you pledged small cap stocks worth INR 10,000 with a haircut of 30%, then the available collateral margin would be INR 7,000.

    It is because the brokers do not lend you the total value of your pledged securities. Instead, they apply a deduction to account for market volatility and price fluctuations. This deduction reduces the amount you receive as a collateral. Haircuts are generally represented as a percentage of the asset price. The riskier the asset, the higher the haircut.

    Read Also: What is Pledging of Shares?

    Example of How a Margin Pledge Works

    Example of how a margin pledge works

    You have shares worth INR 1 lakh in HDFC, but you need funds to trade the F&O contracts of the Nifty 50 Index.

    Here, you will pledge your shares of HDFC with your broker. The broker will deduct a haircut from the total value of the shares, let’s take 20% haircut for simplicity, which is INR 20,000.

    The remaining INR 80,000 will be your margin limit, which you can use to trade the F&O contracts of Nifty 50 Index. Keep in mind that with a pledged margin, you cannot buy option contracts of Nifty 50; it can only be utilized to buy / sell future contracts and short option contracts.

    Cash vs. Non-Cash Component

    The Securities and Exchange Board of India (SEBI) regulates the margin requirements for F&O trading. It has mandated a minimum margin for each F&O position, and the required margin can be achieved through a combination of cash and non-cash components in case of pledged margin.

    The cash component refers to your own cash deposited with the broker, the amount invested in liquid funds, bank guarantees, government securities, etc. and the non-cash component includes the collateral margin obtained by pledging your holdings, such as stocks, ETFs, mutual funds apart from liquid funds, etc.

    Importantly, SEBI mandates that at least 50% of the total margin requirement for overnight F&O positions must be in cash and cash equivalents. The remaining 50% can be non-cash collateral. In case of non-fulfilment of the cash component, your broker will levy interest charges.

    Other factors that can be taken into account:

    • Not all assets in your portfolio are eligible for pledging. Brokers accept stocks, ETFs, and government securities like SGBs.
    • This regulation aims to ensure that traders have sufficient liquidity to meet their margin obligations and mitigate the risk of excessive leverage.
    • Margin trading carries the risk of margin calls if the market moves against your position and the value of your collateral or F&O contract drops. Failing to fulfil a margin call may result in the broker’s forced selling of your pledged holdings.

    *Margin Call is a notification from the broker demanding additional cash or securities to maintain the minimum margin requirement for your positions.

    Advantages of Margin Pledge

    Advantages of Margin Pledge
    1. Amplified buying power: The most important benefit is increased purchasing power. By using your current holdings as collateral, you have the opportunity to access additional capital to take larger positions in F&O contracts, magnifying the profits.
    2. Strategic use of existing Assets: Margin pledge enables the efficient deployment of one’s idle holdings for productive purposes. You can use stocks or bonds to generate additional trading opportunities.
    3. Convenience and Efficiency: The traders do not need to sell existing holdings to free up cash. They can use it while their assets keep on increasing.

    Read Also: Margin Call: – Definition and Formula

    Risks Involved

    Risk Involved in Margin Pledge

    While margin pledge offers an attractive way to boost your trading margin, it is essential to understand the inherent risks involved.

    • The increased buying power that comes with the margin pledge can also increase your losses. It is a double-edged sword; market fluctuations can cause a sharp decline in your positions.
    • If the value of your pledged securities or F&O positions falls, you might face margin calls from your broker, which will require you to deposit additional cash or securities to maintain the minimum margin needs. Failure to meet a margin call could result in the broker being forced to sell your pledged securities.
    • F&O trading itself is inherently volatile. A margin pledge further increases this volatility, causing sharper swings in trading positions.
    • The ease of taking larger positions with pledged margins might tempt you to make impulsive or emotional trades.

    Conclusion

    To sum it up, margin pledge can substantially amplify your purchasing capacity for intraday, futures, and options trading. However, it is essential to use it strategically and have a clear understanding of the risks involved in it.

    Additionally, it is important to understand mechanics of intraday, futures, and options trading and risk management prior to utilising the pledged margins.

    Frequently Asked Questions (FAQs)

    1. What is a margin pledge?

      In margin pledge, you use your existing securities as collateral to borrow money for further trading.

    2. Can I buy call and put options from the pledged margin?

      No, you cannot utilize the pledged margin for buying option contracts. It can only be used for intraday equity, buying or selling futures, and selling option contracts.

    3. Do liquid funds considered as a cash component?

      Yes, liquid funds are considered as a cash component.

    4. Do brokers have the right to sell my pledged holdings?

      Yes, in case of a short fall, the broker has the right to liquidate your pledged holdings.

    5. Is the margin pledge safe?

      Yes, it is safe. However, you should use margin pledge only if you understand the F&O risks, and have a well-defined trading strategy.

  • What is Trading? History, Trading Styles, and Trading vs Investing

    What is Trading? History, Trading Styles, and Trading vs Investing

    The main aim of trading and investment is to grow wealth. Although both participants’ strategies and tenure differ, they aim to increase their wealth. In this post, we will explain trading strategies and how they can be used to earn higher profits.

    What is Trading?

    Let’s understand it in this manner: when we buy something from a shop, we give them money for the product. This activity is exchanging goods and services. A similar thing happens in the financial market. We purchase and sell financial products, such as stocks, commodities, or currencies. We buy them when the price is low and sell them when the price rises, in turn earning a profit.

    This purchasing and selling of financial products, such as stocks, commodities, or currencies, is called trading.

    History of Trading

    Humanity has used the barter system, the earliest form of trading and investment, for thousands of years. In 600 BCE, the Lydians are said to have invented coins, introduced money, and facilitated trade.

    The oldest stock exchange was founded in the 16th and 17th centuries. In 1602, the Amsterdam Stock Exchange opened for business, which resulted in the purchase and sale of corporate shares by people. The New York Stock Exchange was founded in 1792 and has become a significant global trade center.

    Humanity has since witnessed significant technological advancements, including computers, telegraphs, and telephones. All these sped up the stock trading business and led to an electronic trading platform. This has provided access to a lot more individuals who were earlier unable to enter the stock market.

    In the 21st century, online trading has now become even more accessible because of mobile applications and discount brokers.

    Trading Styles

    Trading Styles

    There exist numerous trading styles, some of which are mentioned below.

    • Day Trading: Day trading is a fast-paced trading strategy. It involves buying and selling assets within a single trading day. The main objective is to profit from brief price fluctuations, which demands quick thinking and laser-like focus. To reduce the possibility of unfavorable overnight price changes, traders usually liquidate their positions before the market shuts.
    • Swing Trading: Here, traders keep their position for a few days or weeks. They examine charts and look for bigger price fluctuations and market patterns to deliver a strong profit. While doing swing trading, one needs to have an active attitude, but it also requires deeper knowledge. Because of the short-term nature of swing trading, traders rely heavily on technical analysis with the occasional use of fundamental analysis.
    • Positional Trading: Positional trading is an investing technique in which traders hold their position for months. Their approach is based purely on fundamental analysis.
    • Scalping: It is a high-frequency trading strategy in which traders make hundreds of trades daily to capture small price movements. It heavily relies on technical analysis and requires a deep understanding of market mechanisms.

    Read Also: Trading For Beginners: 5 Things Every Trader Should Know

    How to start trading?

    How to Start Trading?

    Educate yourself: Before diving into the trading world, it is essential to learn the basics. Read books, go through articles, take online classes, and follow market news to stay updated.
    Create a trading account: Once you have a decent understanding of how the markets function, create a trading account with online brokers, such as Pocketful. This will allow you to use state-of-art infrastructure with an easy-to-use interface.
    Choose your trading style: Decide which style suits your goals and risk tolerance.
    Fund your account: Deposit cash into your account using your preferred payment method to begin trading. Remember to invest money that you can afford to take risks with.
    Place your trade: Use the platform your broker provides to buy and sell the asset you choose.

    Trading vs Investing

    BasisTradingInvesting
    Time HorizonShort-term (days, weeks, months)Long-term (years, decades)
    GoalCapitalize on short-term price movementsGrow wealth over an extended period
    Risk Tolerance RequiredHighModerate to Low
    Research FocusTechnical analysis Fundamental analysis 
    ActivityMore frequent transactions.Less frequent transactions.
    Required KnowledgeDeep understanding of technical analysis and market mechanisms.Understanding of markets and asset classes.
    ProsHigh potential rewards, quick returns, and fast-paced.Lower risk, less time commitment, and less speculation.
    ConsHigh risk of losses, demands constant attention, and more speculation.Lower earning potential in the short term.

    Read Also: Swing Trading vs Day Trading: Which Strategy Is Right For You?

    Conclusion

    Finance can be scary, but if you know what you’re doing, you can handle trading like a pro. This guide intends to teach you the basics of trading, from its history to the different trade styles you can use. Remember that trading is exciting but dangerous. So, think about your goals and how much risk you can take before you step into the ring of stock trading.

    Frequently Asked Questions (FAQs)

    1. What is the difference between trading and investing?

      While trading talks about making money from short-term changes in the price of stocks, currencies, and commodities, investing mentions the art of slow but consistent returns; it involves sticking with trades for a much longer time.

    2. What are the different styles of trading?

      There are several trading styles, each with its own strategy and time frame. They are Day Trading, Swing Trading, Positional Trading, and Scaling.

    3. What are the risks associated with trading?

      Trading is exciting but comes with its own set of risks. It is heavily dependent on speculation, requires a high amount of technical knowledge, and can lead to immense losses even in the short term.

    4. How can I start trading?

      You can start trading by signing up and creating a demat account with popular brokers like Pocketful. You can fund your account and start placing trades once your account is created.

    5. What are the common mistakes to avoid while trading?

      The most common trading mistakes include overtrading, which leads to higher transaction costs and increased risk, and ignoring risk management, such as not setting stop-loss orders and failing to diversify your portfolio, which can result in significant losses

  • What is the NIFTY EV & New Age Automotive Index?

    What is the NIFTY EV & New Age Automotive Index?

    There has been a huge increase in the number of Electric vehicles on Indian streets recently. Now, India has its first NIFTY EV and New Age Automotive Index in the stock market!

    Today’s blog will explain the purpose of this groundbreaking index and how it benefits investors and the EV industry.

    What is the NIFTY EV

    The EV Index, also called the NIFTY EV & New Age Automotive Index, is a stock market index introduced in India on May 30, 2024. This is a first-of-its-kind index in India. It monitors the performance of companies involved in the electric vehicle industry or developing new automotive vehicles and related technologies.

    The introduction of the NIFTY EV Index is regarded as a favourable development for the EV sector in India. The industry is now expected to see a surge in investor interest, which will undoubtedly significantly boost EV companies.

    The base date for the NIFTY EV & Automobile Index is April 2, 2018, with a base value set at 1000. The index will be updated twice a year and adjusted

    Reasons for the New Index

    Reasons for the New Index

    There exist multiple rationales for the introduction of a new index tailored specifically to the EV sector. Some of the reasons are listed below.

    1. Benchmarking: The index can be utilized for various purposes, including benchmarking fund portfolios, launching index funds, ETFs and other structured products.
    2. Track Performance: The NIFTY EV & New Age Automotive index is designed to monitor the performance of companies operating in the EV and new age automotive sector. This sector includes hybrid vehicles, hydrogen fuel-based vehicles, and green-hybrid vehicles.
    3. Increased Interest of Investors: The introduction of a new EV index can elevate investor awareness and stimulate increased capital inflows into the EV sector in India. This will benefit both the established EV companies and startups seeking funding for research and development.

    Key Points to Note

    Key Points to Note
    • Stocks that are part of or soon to be part of the Nifty 500 index at the time of review can be included in the index.
    • Stocks in the Nifty 500 can be included in the index if they are involved in the production and supply of electric or new-age automotive vehicles, batteries, components, raw materials, and technology.
    • The overall weight of the stocks belonging to Group A (Manufacturing of 2W/3W/4W/PV/CV Electric and New Age automotive vehicles) shall be capped at 40%.
    • The weight of each stock belonging to Group A shall be capped at 8%. All other stocks are capped at 4%.

    Sector Representation & Current Components

    The sector representation in the new index is as follows:

    SectorWeight
    Automobile and Auto Components72.13
    Information Technology11.31
    Chemicals10.63
    Capital Goods6.39
    Oil, Gas & Consumable Fuels3.37
    Consumer Services0.18

    The top constituents by weightage are as follows.

    Company’s NameWeight (%)
    Bajaj Auto Ltd7.08
    Tata Motors Ltd.6.49
    Mahindra & Mahindra Ltd.5.83
    Maruti Suzuki India Ltd.5.28
    Exide Industries Ltd.4.78
    Bosch Ltd.4.56
    Samvardhana Motherson International Ltd.4.45
    Eicher Motors Ltd.4.42
    CG Power and Industrial Solutions Ltd.4.30
    Himadri Speciality Chemical Ltd.4.28

    Read Also: NIFTY Next 50 – Meaning, Types & Features

    Market outlook of EV Sector

    Market Outlook

    Industry experts hold both a bullish and bearish outlook for the EV sector. A concise explanation of both viewpoints is provided below:

    Bullish Outlook

    • Morgan Stanley predicts a 32% growth rate by 2030 for the Indian EV market.

      According to Morgan Stanley, India’s increasing demand for cars could account for half of the global car demand in the next two decades. New buyers can skip traditional cars and go straight to modern technology. This means that car manufacturers who are focusing on the future of the automotive industry will likely pursue opportunities for growth in India.
    • McKinsey estimates that electric vehicles could make up 30% of new car sales in India by 2030.

      As per McKinsey, consumers are increasingly showing interest in electric cars. Many people are considering buying electric vehicles for their next car. They prefer full-battery electric vehicles over plug-in hybrid electric vehicles.

      The company’s research on electric two-wheelers found that 86% of consumers would consider buying an EV, while only 69% would consider a Combustion Engine vehicle.

    Bearish Outlook

    • Citigroup has raised concerns regarding the consistency of government policies and the development of charging infrastructure.
    • Credit Suisse focuses on the importance of cost competitiveness in EVs compared to traditional vehicles.
    • JP Morgan has raised the issue of battery technology advancements and the scalability of sustainable raw materials to meet the growing demand for electric vehicles. This highlights the complex landscape the EV industry must navigate to achieve widespread adoption.

    Conclusion

    The introduction of the EV index represents a noteworthy milestone for the electric vehicle sector in India. This index has the potential to fuel sustainable growth by providing a clear benchmark and attracting new investments. This index is just the start of an exciting journey towards a cleaner and more sustainable future. However, it is important to consider consulting a financial advisor to determine whether EV-focused investments are compatible with your portfolio objectives.

    S.NO.Check Out These Interesting Posts You Might Enjoy!
    1What is Nifty BeES ETF? Features, Benefits & How to Invest?
    2What Is Nifty 50? How To Invest In It?
    3Bank NIFTY Intraday Options Trading: Steps, Strategies & Tips
    4Introduction to Gift Nifty: A Cross-border Initiative
    5How has Budget 2025 impacted Bank Nifty?

    Frequently Asked Questions (FAQs)

    1. What sectors are included in the EV index?

      The index includes the following sectors – Automobile and Auto Components, Information Technology, Chemicals, Capital Goods, Oil, Gas & Consumable Fuels, and Consumer Services.

    2. How is the New EV index beneficial for investors?

      Investors can use this index to benchmark their EV investments and gain exposure to the sector through index funds or ETFs.

    3. Is this the first EV Index globally?

      There are EV indices in other countries, but this is the first of its kind in India.

    4. How often will the index be reviewed?

      The index constituents will be reviewed every six months and rebalanced quarterly.

    5. Is it a good time to invest in EVs?

      The EV market is promising and evolving, but consult your financial advisor before making any investment decisions.

  • Swing Trading vs Day Trading: Which Strategy Is Right For You?

    Swing Trading vs Day Trading: Which Strategy Is Right For You?

    A million-dollar question: which trading strategy is right for you: Swing Trading or Day Trading? Let’s find out the answer.

    What is Day Trading?

    The Day trading involves buying and selling of financial instruments like stocks, bonds, futures, commodities, and currencies to generate profit from the short price movement within a single trading day. Many positions can be entered, which can last from several minutes to a few hours during the single trading day.

    Traders essentially close the position before the day ends to avoid risk exposure. As the activity of buying and selling takes place within a single day, traders make fast decisions on market direction and usually exit once the trade goes against their view.

    Anyone can perform day trading, but it requires lots of time and effort to monitor positions and some technical setup and knowledge to decide when to exit the market. A day trader wants to keep the risk minimum by not carrying it overnight. This is one of the major reasons for holding positions only until the end of the day because they are not subjected to overnight changes.

    There are multiple techniques which traders deploy in Day Trading. Some day trading techniques include:

    • Scalping: It Involves buying and selling a stock multiple times in a day to make small profits from small price movements. The time period for holding a trade could be a couple of seconds to minutes.
    • Range trading: It Involves buying when an asset’s price is in a particular range, it could be near the low end of the price range and selling when it’s near the high end of price range.
    • Algo Trading or High-frequency trading (HFT): It uses a computer-based system to automatically track price changes and execute trades. It is also called Algo trading.
    • Momentum trading: It means entering into a position of buying and selling on the basis of recent primary trends and exiting as soon as it shows signs of reversal. Momentum traders tend and volatility.

    What is Swing Trading?

    What is Swing Trading

    It involves buying and selling a financial instruments such as stocks, bonds, currencies, and commodities in an attempt to exploit short to mid-term price movements in a security using a favorable risk-reward ratio. The time period for holding a trade could be several days to weeks.

    Swing trading is often considered better for beginners compared to scalp trading or day trading. It requires fewer orders compared to scalp trading, hence lower trading costs. Also, it doesn’t require continuous monitoring. Though the minimum return is not guaranteed in this, Swing traders still have the potential to make a similar profit as of a scalper with less trading activity and less risk.

    Swing traders use many technical analysis signals to enter and exit a trade, such as Fibonacci retracement, Channel trading, MACD, RSI Crossover, divergences, and moving averages. Moreover, they also use Fundamental triggers like Quarterly results, management insights, inflation, interest rate scenarios, etc.

    What is the difference between Day Trading Vs Swing Trading

    Day TradingSwing Trading
    There is a low margin requirement for the Day trading as traders close the position on the same day.The requirement of margin is high compared to day trading.
    The higher leverage is made available for Intraday trading.The lower leverage is available for swing traders as it involves holding a position for days.
    Day traders are known as full-time traders as more time is required to execute and monitor the trades.Swing traders are known as part time traders as less time is required to monitor the trades.
    They make multiple trades and keep on exiting with small profits and losses.Swing traders analyze trends and choose securities that will perform better in future to earn profits.

    Read Also: 5 Must-Read Best Swing Trading Books for Trader

    Quick Summarization

    Quick Summarization
    1. Swing trading requires less involvement than day trading as it requires less monitoring.
    2. Swing trade positions are subject to overnight market risks, as swing trading often involves at least an overnight hold, whereas day traders close out positions before the market closes.
    3. Day traders have more access to margin or leverage as compared to Swing traders. Hence in day trading, because of leverage, traders risk magnifies but the good thing is if market goes against their view, they have time to instantly cut the position.
    4. Swing traders may incorporate both technical and fundamental analysis, whereas a day trader is more likely to focus on using technical analysis.

    Read Also: What is the Best Time Frame for Swing Trading?

    Conclusion

    In summation, there are no right or wrong answers to which trading strategy is right for you. It depends upon your skills, style, preference, and availability of time.

    Most of the people think trading is different from their actual mentality. Technical analysis, which is one of the tools used to gauge market direction, is nothing but a tool for judging mass psychology. The more the traders anticipate that the market is still undervalued or a certain sector or stock is available at a good valuation, the more they will buy, and the market will start taking support and eventually bounce. In similar way, the more the traders perceive that the market is overvalued or certain group of stocks or sectors are expensive, the more they will start exiting their position or start shorting.

    If traders could think they can analyze the market better, and are able to take risks to bet on market direction, then it is suggested that they go for Swing Trading. There are pros and cons of both the trading styles, so after taking them into consideration and as per one’s risk appetite, one can choose their respective trading style, Swing or Day Trading.

    Frequently Asked Questions (FAQs)

    1. What is Day Trading?

      Day trading is the activity of buying and selling financial instruments like stocks, bonds, futures, or commodities to generate profit from the price movement within a single trading day.

    2. What is Swing Trading?

      Swing trading is the activity of buying and selling financial instruments like stocks, bonds, futures, or commodities to generate profit from the price movement where traders keep the position open for a few days to a few weeks.

    3. Do Swing Traders make multiple trades?

      No, it is Day traders who make multiple trades and keep on exiting with small profits and losses.

    4. Which trading Strategy is less risky?

      Day trading is less risky than the Swing Trading as a trader can close the position on the same day, and there are no overnight uncertainty risks.

    5. What is the major difference between Day Trading and Swing Trading?

      There are various differences in Day trading and Swing trading such as difference of risks, time period, costs, size of profits and losses, etc.

  • Open Free Demat Account

    Join Pocketful Now

    You have successfully subscribed to the newsletter

    There was an error while trying to send your request. Please try again.

    Pocketful blog will use the information you provide on this form to be in touch with you and to provide updates and marketing.