Swing trading: A versatile trading strategy where a trader opts to capitalize on short- to medium-term market fluctuations or benefit from the swings that occur in markets. One of the key decisions while doing swing trading is selecting the appropriate time frame.
Selecting a suitable time frame significantly impacts trading decisions and risk management, which affects profitability. Here is an in-depth guide on the importance of optimal time frames for swing trading.
The holding period for a swing trading strategy falls between that of a holding period of day trading and long-term investing. The strategy enables traders to take advantage of price “swings” spanning from a couple of days to weeks without constantly monitoring the markets. However, the trick to maximize profits and minimize losses lies in the selection of proper time frames. Nowadays, you can easily analyze the market conditions using the tools available on an online stock trading platform.
What is Swing Trading?
Swing trading is a style of trading where positions are held for a few days to several weeks to capitalize on expected price movements. Unlike the day trader, swing traders do not close all their positions by the end of the trading day. Neither will they hold trades for years like the long-term investor.
Key Features of Swing Trading:
- Focused on predicting medium-term trends.
- Involves technical analysis and indicators such as moving averages, RSI, and MACD, among others.
- Less time-consuming as compared to day trading.
The choice of swing trading time frame depends on the expected returns and risk profile of a particular individual.
Understanding Timeframes in Trading
The time frame is the amount of time each candlestick represents on the price chart of stocks. Selecting an appropriate time frame is essential in making better trading decisions. Many trading styles exist, and various time frames that can be used to trade are demonstrated below:
Short-term Time Frames (5 minutes, 15 minutes, 1 hour):-
- Ideal for intraday traders.
- Vulnerable to market noise.
Medium-term Timeframes (4 hours, daily):-
- Ideal for swing trading.
- Well-defined trends without much noise.
Long-term Timeframes (weekly, monthly):-
- Best for investors.
- The focus is on macro trends over months or years.
Swing traders usually use medium-term timeframes; however, most people use multiple timeframes to get more market insights and determine entry and exit levels.
Best Time Frames to Use for Swing Trading Success
Here are the best time frames to use for swing trading:
- 4-Hour Charts (4H)
- Efficient for quick decision-making and gathering in-depth insights.
- Used for fine-tuning entry and exit points within bigger trends.
- In volatile markets, shorter time frames like 4-hour charts allow traders to capitalize on short-term fluctuations.
- Daily Charts (1D)
- It is one of the most popular time frames used for swing trading.
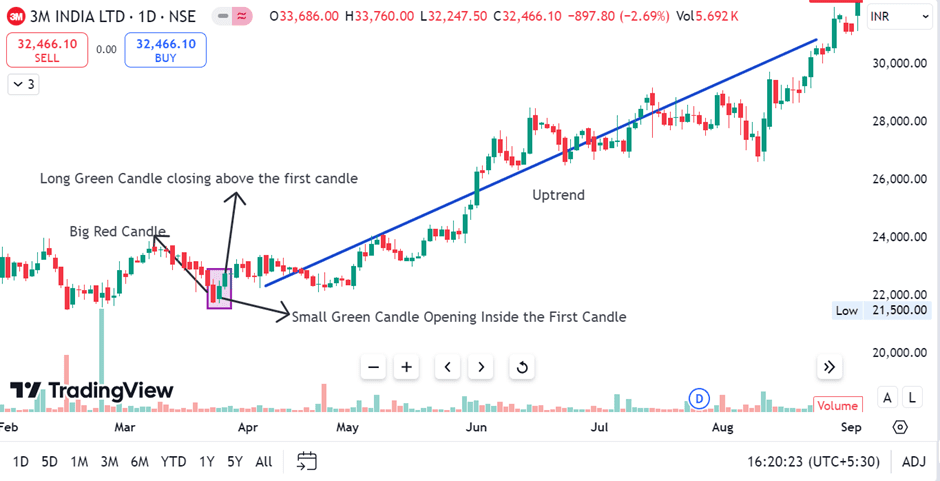
- Useful to identify Head and Shoulders, Double Bottom, or flag patterns, among others.
- Reduced market noise compared to a shorter time frame.
- Weekly Charts (1W)
- Focuses on the larger trend of the market.
- Useful for determining the long-term direction of the market.
- Combination of Timeframes
Many traders use a top-down approach, analyzing higher timeframes (weekly) to determine trends and using lower timeframes (daily or 4-hour) for precise entries and exits. This method minimizes risks and optimizes trade timing.
Why are Timeframes Important for Swing Trading?
Choosing a time frame is critical to swing trading since it affects the following:
- Optimum Number of Trades: Shorter timeframes can result in overtrading, while longer timeframes delay trading decisions. A balance between the two is provided by medium timeframes.
- Risk Management: Correct timeframes ensure that stop-loss and targets are determined accurately.
- Implementation of Strategies: Using a wrong time frame can lead to inconsistent application of certain strategies based on even the best swing trading patterns.
For example, a head-and-shoulders pattern may look very different on a daily chart than it will on a 4-hour chart. Selecting the appropriate time frame eliminates spurious signals.
Choosing the Right Time Frame for Swing Trading
You can follow the below steps to select a suitable time frame for your swing trading strategy:
Evaluate Your Trading Objectives
- You must decide your target return and the number of trades to achieve that. A swing trader aims to make substantial gains in a moderate number of trades.
- Swing traders often use daily or weekly charts as they provide clear trends without requiring constant monitoring.
Know the Trend of the Market
- Volatile markets demand a shorter time frame, i.e., 4-hour charts. A shorter time frame allows traders to capture short-term fluctuations.
- Stable markets can be best analyzed using longer time frames like daily or weekly charts, which help identify sustained trends.
Analyze Your Trading Tools
- Online stock trading platforms like Zerodha, Pocketful, or Upstox offer advanced charting features that allow traders to analyze multiple timeframes for enhanced accuracy.
Benefits of Using Multiple Timeframes
Using multiple timeframes enhances your swing-trading skills. Here’s how you can use multiple timeframes:
- Multiple Timeframes in Trend Identification: Higher timeframes confirm primary trends. However, lower timeframes allow for more accurate entry and exit points. For instance:
- Weekly charts show that an uptrend is prevailing.
- Daily charts help identify a pullback to initiate a long position.
- Reduced Risk: Multiple timeframes help you identify strong support and resistance levels. This increases the chances of having better stop-loss.
Conclusion
The best time frame for swing trading varies for different trading strategies. Most traders prefer a daily timeframe for swing trading. Nevertheless, using several timeframes improves the accuracy of trades, reduces risks, and maximizes profits.
Be it a beginner or a seasoned trader, using a reliable online stock trading platform with the knowledge of optimal timeframes is crucial for sustained success. Swing trading can be a great approach for making consistent profits; however, choosing the right time frame will unlock your full potential.
Frequently Asked Questions (FAQs)
What is the best time frame for swing trading?
The best time frame for swing trading is a daily time frame, as it usually depicts a clear trend with actionable insights without much noise.
Are weekly charts effective for swing trading?
Yes, weekly charts are great for monitoring broad market trends and executing swing trades aligned with long-term trends.
Can beginners use 4-hour charts for swing trading?
Beginners can use a 4-hour time frame, but it is recommended to use multiple timeframes for better entry and exit levels.
How do online trading platforms facilitate swing trading?
Online trading platforms offer advanced charting tools, indicators, and quick execution of trades, which makes it easy to analyze and execute trades.
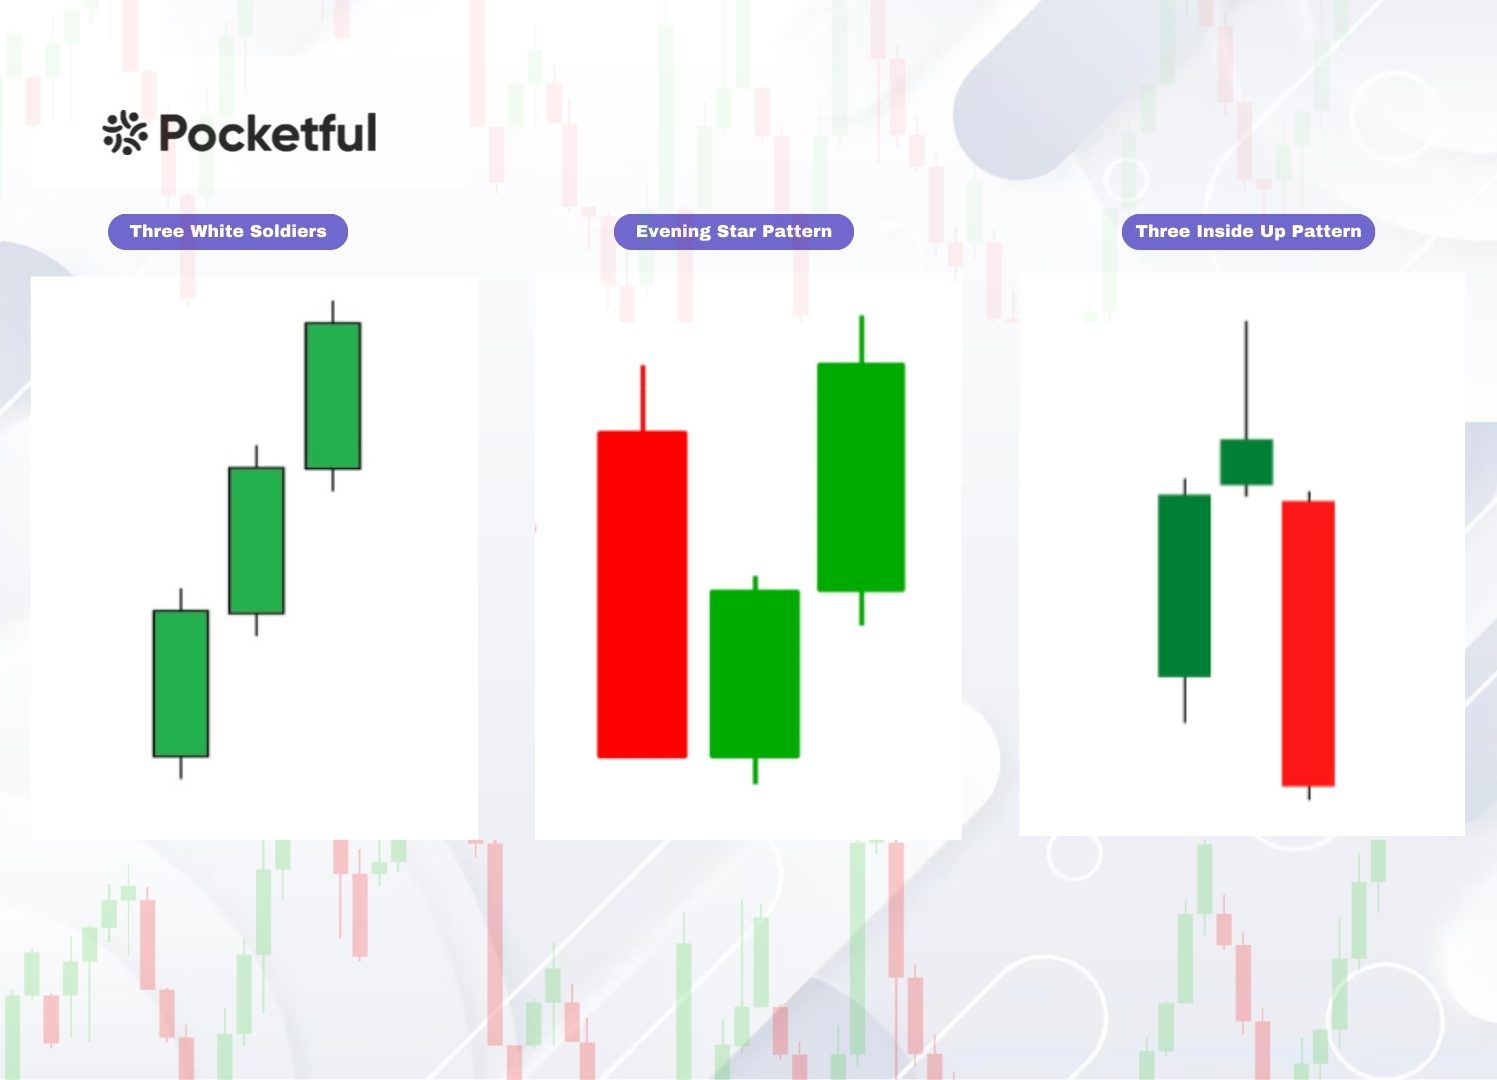
What are the best swing trading patterns?
Head and shoulders, double bottoms, and flag patterns are some of the most reliable swing trading patterns.