Think about how a supermarket runs in India, it doesn’t just open whenever it feels like. The government has set rules for markets and supermarkets opening timings, the staff gets in early to set things up, then the doors open for business, and finally, they close for the day to count the sales.
The Indian stock market works in a similar pattern where it runs on a strict schedule to keep things fair and orderly for everyone. If you’re a beginner then you must be aware about the stock market timings, as this is the first step. So, what are the share market timings in India? When is the official share market opening time, and what’s the market open and close time? People also have a doubt, does the stock market open on Saturday? In this blog we will learn the exact stock open time and walk through a day at India’s major stock exchanges, the BSE and NSE.
Pre-Market Timings (9:00 AM – 9:15 AM)
Before the main trading starts, there’s a special 15-minute window called the “pre-open session.” You can think of it as the market’s warm-up time, where it helps traders to look for overnight market changes like how global markets did or if a big company made an announcement related to its operations or finances. This session was introduced back in 2010 to stop prices from fluctuating massively the moment the market opens. It makes sure the opening price of a stock is fair and reflects what people are actually willing to pay.
This 15-minute session is split into three parts.
1. Placing Your Orders (9:00 AM – 9:08 AM)
During the first eight minutes of the market, you can place new orders, change, or cancel your buy and sell orders. It works like an auction where everyone submits their bids before the market really opens for trading. The system collects all the information of these orders to know the mood of the market (positive or negative).
2. Finding the Opening Price (9:08 AM – 9:12 AM)
For the next four minutes the exchange systematically looks at the buy and sell orders placed by traders and then it calculates the equilibrium price by looking at all these orders as equilibrium price is the price where the most shares can be bought and sold. This becomes the official opening price for the day, and during these four minutes you cannot place any new orders.
3. Getting Ready (9:12 AM – 9:15 AM)
The last three minutes before 9:15 is the buffer period, this is the moment that helps the market move smoothly from the pre-open session into the main trading day. No orders or trades take place during this time and everything stays calm before the market starts to function.
The financial market fully starts to function from 9:15 AM to 3:30 PM, this is the time when people can buy and sell stocks in the financial markets. The buying and selling of shares works on matching buy and sell orders, meaning when the buyer’s price matches a seller’s price for a stock, a trade happens right away. This happens thousands of times every second for all the companies listed on the exchange.
How the Closing Price is Decided
You might think a stock’s closing price is just its price at 3:30 PM on the dot, but it is not exactly that, here the stock exchanges calculate the closing price as the weighted average of all the trades that happened between 3:00 PM and 3:30 PM. This gives a much fairer and more stable price that reflects the stock’s value over the last half-hour of trading.
Post-Market (3:30 PM – 4:00 PM)
As soon as the time is 3:30 PM the main session of the stock market ends but the day is not over yet as from 3:30 PM to 3:40 PM, After that, from 3:40 PM to 4:00 PM you can still place buy or sell orders, but only at the official closing price. This period is known as the “post-market session” where a trade will only happen if there’s someone on the other side who is willing to trade at that same price.
You should also be aware about After Market Orders (AMOs) as these are a bit different, an AMO lets you place an order for the next trading day after today’s market has closed (starting from 3:45 PM, for example). This is a handy tool if you’re busy during market hours and want to set up your trades ahead of time.
The stock market can seem complicated for beginners, but knowing the details can help you in easy decision making for your financial investment journey. You should know that from the pre-open warm-up to the post-close wrap-up, timings are set to make trading fair for everyone.
Understanding these timings is like learning the rules of a game. Once you are aware of these facts you can trade more confidently. It’s a great first step before you start your investment journey, as it helps in planning better decisions and trade more effectively.
S.NO.
Check Out These Interesting Posts You Might Enjoy!
The trading hours for both BSE and NSE start from 9:15 AM and the closing time is 3:30 PM from Monday to Friday.
Can trade orders be placed on Saturdays or Sundays?
No, the Indian stock market is closed on Saturdays, Sundays, and even on public holidays.
Why is the pre-open session important?
It helps figure out a fair opening price for stocks based on overnight news and helps prevent big price swings right at the start of the day.
Can order be placed after the market closes at 3:30 PM?
Yes, investors can trade between 3:40 PM and 4:00 PM at the day’s closing price. You can also place an After Market Order (AMO) that will be sent to the exchange on the next trading day.
Do NSE and BSE have exactly the same market timings?
Yes, the trading schedules for all sessions are the same for both the BSE and the NSE.
No matter whether you are a new investor or one with years of experience, you will still find many questions before you when you start investing. Starting from where to invest, how to compare, to knowing when to buy or sell, everything is important. This is why many investors rely on the indices, which makes investing simpler.
Of these indices, BankBeES and Bank Nifty stand out. They look similar at first. Both follow the banking sector, and both move with the top banks in India. But they work in very different ways. One is an ETF that you can buy like a stock. The other is an index that traders use for futures and options.
This is where most people get confused. Understanding the difference can help greatly. You can make better decisions, avoid wrong trades, and choose the right tool for your goal. In this guide, we break down BankBeES vs Bank Nifty in a simple way so you know what suits you as an investor or trader.
What Is BankBeES
BankBeES is an Exchange Traded Fund that tracks the Nifty Bank index. You can buy it on the stock market just like any listed share. Its price moves in line with the Nifty Bank index, with a small difference because of expenses and tracking error. It is mainly used by investors who want simple and low-cost exposure to the banking sector.
Features of BankBeES
Tracks the Nifty Bank index and reflects its movement.
Trades on NSE like a normal stock through a Demat account.
Gives diversification across major banking stocks in one unit.
Has a low expense ratio for long term investing.
Supports small and regular investing, suitable for SIP.
Does not need margin or leverage, keeping the risk lower.
Offers good liquidity during market hours for easy entry and exit.
Bank Nifty is also called the Nifty Bank index. It is a benchmark index. This is the one that tracks the performance of leading banking companies in India. It includes the most liquid and well-capitalised banks. You cannot buy Bank Nifty directly because it is only an index. But you can trade its futures and options or invest through ETFs that follow this index. Traders use it for high-volume intraday and expiry-based strategies.
Features of Bank Nifty
Represents top and most liquid banking stocks in India.
Used widely for futures and options trading.
Shows high volatility and so it is good for active traders.
Acts as a benchmark for banking sector performance.
Helps ETFs like BankBeES mirror the sector movement.
Updated and reviewed regularly by NSE for accuracy.
Popular among intraday, swing, and positional traders.
Difference Between BankBeES and Bank Nifty
Before comparing both, it helps to understand how they behave in real investing situations. Many new investors assume they are the same, but the difference between BankBeES and Bank Nifty is quite clear once you look at how each one works. One gives you ownership through an ETF, while the other acts as a trading benchmark for futures and options.
Point of Difference
BankBeES
Bank Nifty
Type
BankBeES is an ETF that you can buy and sell on the NSE.
Bank Nifty is an index that tracks the performance of leading banking stocks.
How It Works
It mirrors the Nifty Bank index with a small tracking error.
It shows the exact movement of the banking sector in real time.
Can You Buy It?
You can buy BankBeES directly through your Demat account.
You cannot buy the index directly and must trade its futures or options.
Purpose
BankBeES is built for long term investing in the banking sector.
Bank Nifty is mainly used for short term trading strategies.
Ownership
When you buy BankBeES, you receive ETF units in your Demat.
You do not receive any ownership when trading Bank Nifty.
Risk Level
The risk is lower because there is no leverage involved.
The risk is higher due to leverage and high volatility.
Cost Structure
You pay normal brokerage and a low ETF expense ratio.
You incur F&O charges along with margin requirements.
Volatility
It shows moderate volatility compared to Bank Nifty.
It shows high volatility because traders are very active.
Suitable For SIP
BankBeES works well for SIP and gradual accumulation.
Bank Nifty cannot be used for SIP since it is not a buyable asset.
Liquidity
Liquidity is good but depends on market demand.
Liquidity is very high due to heavy futures and options trading.
Margin Requirement
No margin is required because it is a simple ETF.
Margin is mandatory for trading futures and options.
Investment Style
It suits a stable buy-and-hold investing approach.
It suits active intraday, swing, and expiry-based trading.
Your choice depends on how you approach the market. Both follow the same banking sector. But the experience you get as an investor or trader is completely different. A simple look at your goals, risk comfort, and investing style will help you decide.
So, here are the points that can help you decide when you should use which of the two: BankBeES vs Bank Nifty.
When BankBeES Makes More Sense
Long-term sector exposure becomes easy with BankBeES because you simply hold the ETF in your Demat account.
Volatility stays controlled, which helps if you prefer stable returns.
Costs remain low due to the ETF structure, making it suitable for long-horizon investing.
Anyone who wants banking sector growth without handling F&O complexity will find it a simpler fit.
When Bank Nifty Fits Better
Active traders benefit from Bank Nifty because it offers fast price movement and strong liquidity.
Futures and options strategies become possible since the index is built for trading, not holding.
Higher volatility can work in your favour if you know how to manage sharp intraday swings.
Margin-based positions allow you to amplify gains, though the risk rises as well.
Weekly expiries create frequent opportunities for those who enjoy short-term setups.
Returns Comparison
Returns from both move in the same direction because BankBeES tracks the Nifty Bank index. The difference appears only due to tracking error and small cost adjustments. Bank Nifty, on the other hand, reflects pure index movement without any deviation.
Traders may see higher gains with Bank Nifty in short bursts, especially during strong intraday swings. BankBeES offers steadier long-term returns since it is built for holding, not fast trading.
Risk levels vary sharply between the two. BankBeES carries market risk, which is the natural rise and fall of the banking sector, but nothing beyond that. There is no leverage, no margin, and no expiry pressure.
Bank Nifty, however, moves quickly. It reacts strongly to news, policy changes, and market sentiment. Futures and options add leverage, which increases both potential gains and losses. This makes Bank Nifty far more demanding in terms of timing and discipline.
Conclusion
BankBeES and Bank Nifty may look similar, but they serve very different goals. If you want simple, steady exposure to the banking sector, BankBeES is easy to manage and works well for long-term holding.
If your focus is short-term movement, trading setups, and high liquidity, Bank Nifty is a better choice. This is why knowing how each behaves helps you invest or trade with clarity and confidence.
For more helpful investing guides and insights, explore Pocketful. Get all the details you need to trade smarter and sharper, and ensure that you gain better.
S.NO.
Check Out These Interesting Posts You Might Enjoy!
Investing in the stock market can be a rewarding and long-term wealth-building strategy. But for a beginner, it is difficult to identify which stock to invest in and to regularly monitor the portfolio. For such an investor, investment in a single fund known as the “Nifty50 Index Fund” can be a better choice.
In today’s blog post, we will make you understand the concept of Nifty50 Index Funds, along with the list of the best Nifty50 index funds in India 2026.
Meaning of Nifty50 Index Fund
A Nifty50 Index Fund is a type of mutual fund that mainly buys stocks of the 50 biggest companies on the Indian Stock Exchange based on market capitalisation. They are passively managed funds, and their portfolios are made up of the same companies as the Nifty50 Index. They do not wish to do better than the index; they simply want to replicate its performance.
Best Nifty50 Index Fund
Scheme Name
AUM (Crore)
Expense Ratio (%)
6 Months
1 Year
3 Years
UTI Nifty50 Index Fund Reg Gr
24335.81
0.17
14.14
2.32
14.22
HDFC Nifty50 Index Fund Gr
20929.71
0.20
14.12
2.28
14.19
Navi Nifty50 Index Fund Reg Gr
3436.14
0.06
14.19
2.39
14.27
Nippon India Index Fund Nifty50 Plan Growth Plan Growth Option
2606.59
0.07
14.18
2.40
14.23
Bandhan Nifty50 Index Fund Reg Gr
1952.97
0.10
14.18
2.39
14.25
Tata Nifty50 Index Fund Reg
1296.46
0.20
14.12
2.21
14.11
ABSL Nifty50 Index Gr Reg
1121.21
0.20
14.12
2.30
14.17
Kotak Nifty50 Index Fund Reg Gr
919.74
0.07
14.18
2.19
14.08
DSP Nifty50 Index Reg Gr
824.56
0.18
14.15
2.33
14.22
Motilal Oswal Nifty50 Index Reg Gr
738.34
0.51
14.15
2.34
14.26
Franklin India Index Fund NSE Nifty50 Index Fund Gr
737.22
0.25
14.06
2.32
14.13
Axis Nifty50 Index Fund Reg Gr
735.01
0.10
14.15
2.38
14.27
HSBC Nifty50 INDEX FUND Reg Gr
344.48
0.18
14.15
2.28
14.18
Edelweiss Nifty50 Index Reg Gr
186.71
0.05
14.18
2.37
14.12
Baroda BNP Paribas Nifty50 Index Reg Gr
61.3
0.55
14.03
2.18
–
ANGEL ONE Nifty50 INDEX FUND REG GR
36.03
0.2
–
–
–
Mirae Asset Nifty50 Index Fund Reg Gr
31.92
0.14
14.09
–
–
Kotak Nifty50 Equal Weight Index Fund Reg Gr
19.90
0.22
16.65
–
–
Bajaj Finserv Nifty50 Index Fund Reg Gr
8.21
0.9
–
–
–
(As of 08th October 2025)
While most Nifty50 index funds deliver very similar returns, the real difference lies in their expense ratios and fund sizes—so it’s wise to pick one that balances low costs with strong credibility.
How does the Nifty50 Index Fund Work?
The Nifty50 Index Fund works on the principle of replication. As it is a passively managed fund, the fund manager does not actively choose the stock; instead, it decides to invest the fund accumulated from the investor into the exact stocks of the Nifty50 Index in the same weightage.
The key benefit of investing in the Nifty50 Index Fund is as follows:
Diversification: An investor can easily diversify their portfolio by investing in only one fund.
Economical: As index funds are passively managed funds, their expense ratio is comparatively much lower than any other actively managed fund.
Low Risk: The portfolio of the Nifty50 Index Fund consists of the top 50 companies listed on the stock exchange; therefore, they are less volatile as the investments are made in fundamentally strong companies.
Rebalancing: As the Nifty50 index is balanced periodically, this saves the time and effort of monitoring the portfolio.
Risk of Investing in the Nifty50 Index Fund
The major risks involved while investing in Nifty50 Index Funds are as follows:
Market Risk: As the capital of investors is invested in the top 50 companies, the underperformance of the stock market can significantly impact the overall return of Nifty50 Index Funds.
Tracking Error: The Nifty50 Index Fund’s returns may not be the same as the Nifty50 Index’s returns because of tracking error. This can happen because of the fund manager’s cash reserves, the expense ratio, and delays in reinvesting dividends.
Limited Return: These funds post returns similar to the Nifty50 Index, as they are passively managed and do not claim to outperform the index. Therefore, it is suitable only for conservative investors.
Factors to Consider Before Investing in the Nifty50 Index Fund
The key factors which one must consider before investing in the Nifty50 Index Fund:
Investment Horizon: The typical investment horizon for the Nifty50 Index Fund is more than five years. Hence, one should consider its investment horizon as a key parameter before investing in the Nifty50 Index Fund.
Expense Ratio: The expense ratio is a key factor which can impact the returns of the Nifty50 Index Fund. Hence, one should opt for the fund which has the lowest expense ratio.
Risk Appetite: As the Nifty50 Index fund invests in the shares of the top 50 companies. And they are volatile, hence they can show volatility in your portfolio. Therefore, if you can handle the fluctuation in your portfolio, then only consider investing in it.
Investment in the Nifty50 Index Fund is suitable for the following investors:
Minimum Cost: Investment in the Nifty50 Index Fund is suitable for investors who want to pay a minimum cost for their investment. As the Nifty50 Index Fund is passively managed, and has a minimum cost.
Risk Averse: The Nifty50 Index Fund is a good choice for an investor who wants to make more money by investing in stocks but also wants a safer option.
Long-term investor: Investors who generally have an investment horizon of more than five years can invest in the Nifty50 Index Fund.
Difference Between Nifty50 and Nifty50 TRI
The key differences between Nifty50 and Nifty50 TRI are as follows:
Particular
Nifty50
Nifty50 TRI
Meaning
It only includes the prices of the top 50 companies listed on Nifty.
Along with the prices, it also includes dividends distributed by those 50 companies.
Accuracy
As compared to the Nifty50 TRI Index, it is less accurate, as it does not include dividends.
It has high accuracy as it includes dividends.
Benchmark
It is rarely used as a benchmark by funds.
Nifty50 TRI is commonly used as a benchmark by almost all funds.
Dividends
It ignores the dividends distributed by companies.
It includes all the dividends distributed by the companies.
On a concluding note, A Nifty50 Index Fund is one of the easiest ways to start investing to allocate your money across India’s top 50 companies. A lot of investors like it because it’s low-cost, well-diversified, and not as volatile as funds that are actively managed. This means you should still pay attention to elements like the expense ratio and tracking error before you invest. Therefore, we suggest that you consult your investment advisor before making any investment decision in the Nifty50 Index Fund.
S.NO.
Check Out These Interesting Posts You Might Enjoy!
A Nifty50 Index Fund is a type of mutual fund that follows the Nifty50. It puts money into the 50 biggest companies on the index (by market cap).
What makes Nifty50 different from Nifty50 TRI?
Nifty50 only shows changes in stock prices, but Nifty50 TRI (Total Return Index) also takes into account dividends paid by those companies.
What does the acronym TRI mean?
TRI stands for the Total Return Index (TRI). It includes both price changes and dividends.
What is Tracking Error in a fund?
The difference between an index fund’s return and the benchmark index is called the tracking error. It usually happens because of costs, cash flow, and other things.
Do Nifty50 Index Funds actively manage their investments or not?
These are passive funds. The fund manager doesn’t choose stocks; they just follow the index in the same way.
If you’ve looked at stock technical charts for a while, you’ve probably noticed how patterns in prices tell stories. These narratives, which are presented in candlestick language, assist traders in making educated guesses about potential future events. One of those tales is the Harami Candlestick Pattern, a straightforward two-candle arrangement that frequently suggests a trend reversal. Let’s explain this pattern’s meaning, how to spot it, and how traders apply it in actual markets in plain English.
What is the Harami Candlestick Pattern
“Harami” is a Japanese word that means pregnant. The Harami looks like a “mother” candle with a “baby” candle inside it. It is made up of two candles:
The first candle is big and shows strong momentum in one direction.
The second candle is small and sits entirely within the first candle’s body.
This small candle signals a pause. When this happens after a strong uptrend or downtrend, it could mean a reversal is expected in the near future.
How to Identify a Harami Pattern?
Spotting a Harami isn’t difficult once you understand the pattern.
Here is what to look out for while identifying;
Find a trend – an uptrend or downtrend, and not a sideways market.
Look for a large candle that moves strongly in the direction of the trend.
The next day, see if you can see a smaller candle inside the first one’s body.
The second candle shows doubt; traders are not sure, and the previous momentum is fading.
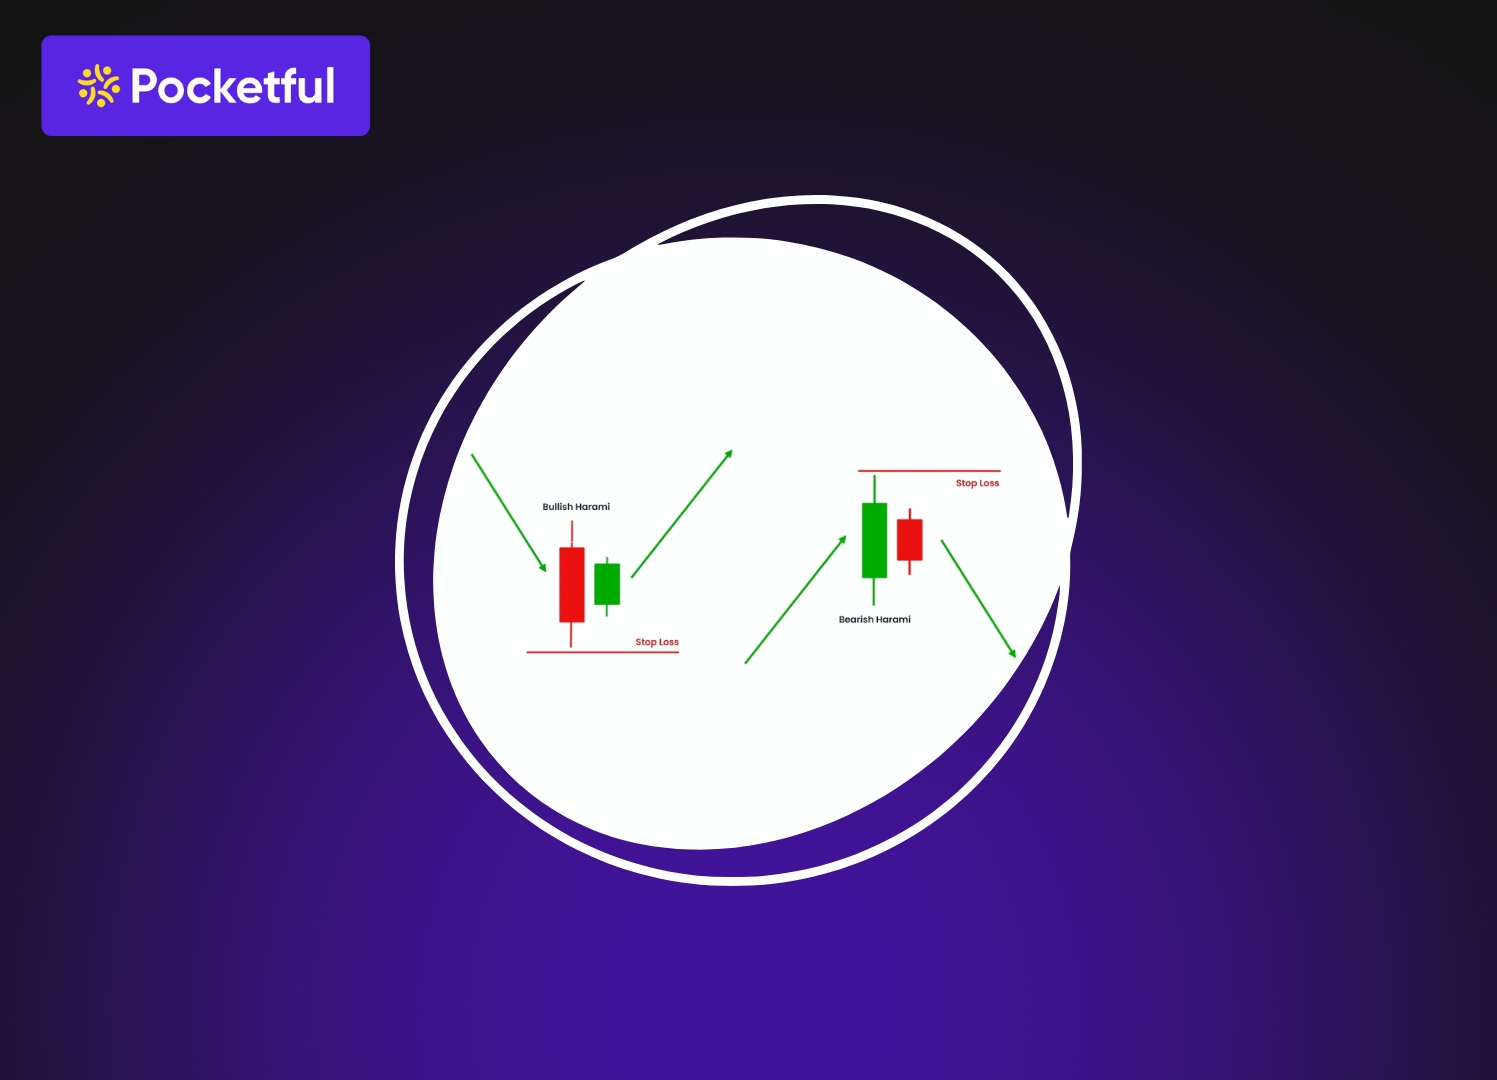
This appears during a downtrend and suggests prices might turn upward soon.
The first candle is bearish (red or black) with a long body, indicating that sellers are clearly in control.
The second candle is bullish (green or white) and small, fully contained within the previous candle.
This pattern hints that selling pressure is fading away and buyers are stepping in.
Example – A stock has been falling for a week. One day, there is a long red candle, followed by a small green candle inside it. The next day, if prices go above that green candle’s high, that is confirmation that the reversal is likely real.
Entry, Stop Loss & Target
Entry – After you see a Bullish Harami, wait for the next candle to close above the high of the smaller candle. This confirms the reversal.
Stop Loss – Put your stop loss just below the low of the first bearish candle that is bigger. If the price falls below that, it usually means the downtrend is not yet over.
Target – The next resistance level or a recent swing high can be your first target. You can also try for a 1:2 risk-reward ratio, which means you risk ₹1 to make ₹2.
2. BEARISH HARAMI (a digital image can be put)
This one forms during an uptrend and signals a possible move downward.
The first candle is bullish with a large green body.
The second is bearish and smaller, sitting inside the first green candle body.
This shows that buying strength is fading; sellers may be taking control.
Example – After several days of price gains, you find a big green candle followed by a small red candle inside it. If the next candle falls below the red one’s low, that is your sign of a possible weak trend.
3. Entry, Stop Loss & Target
Entry – After a Bearish Harami forms, wait for the next candle to close below the low of the smaller candle to make sure there is selling pressure.
Stop Loss – Place your stop loss just above the high of the first bullish candle. The trend may continue to rise if prices exceed it.
Target – Your first target should be the next support level or the most recent swing low. Again, a risk-reward ratio of 1:2 or better is good for safer trades.
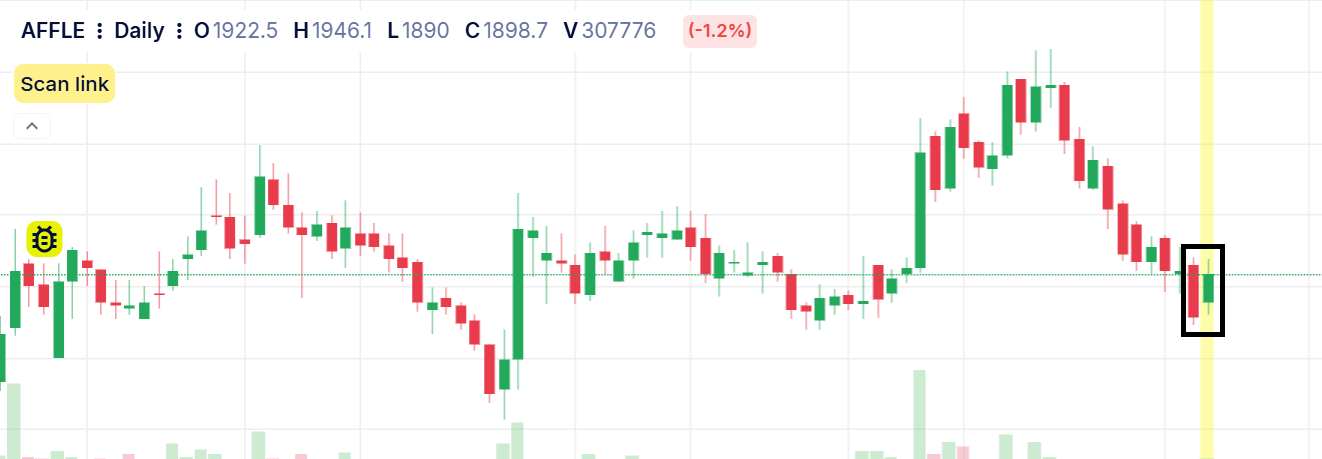
1. The example below shows the chart of AFFLE LIMITED on a daily timeframe. You can visibly see the formation of a Bullish Harami Pattern.
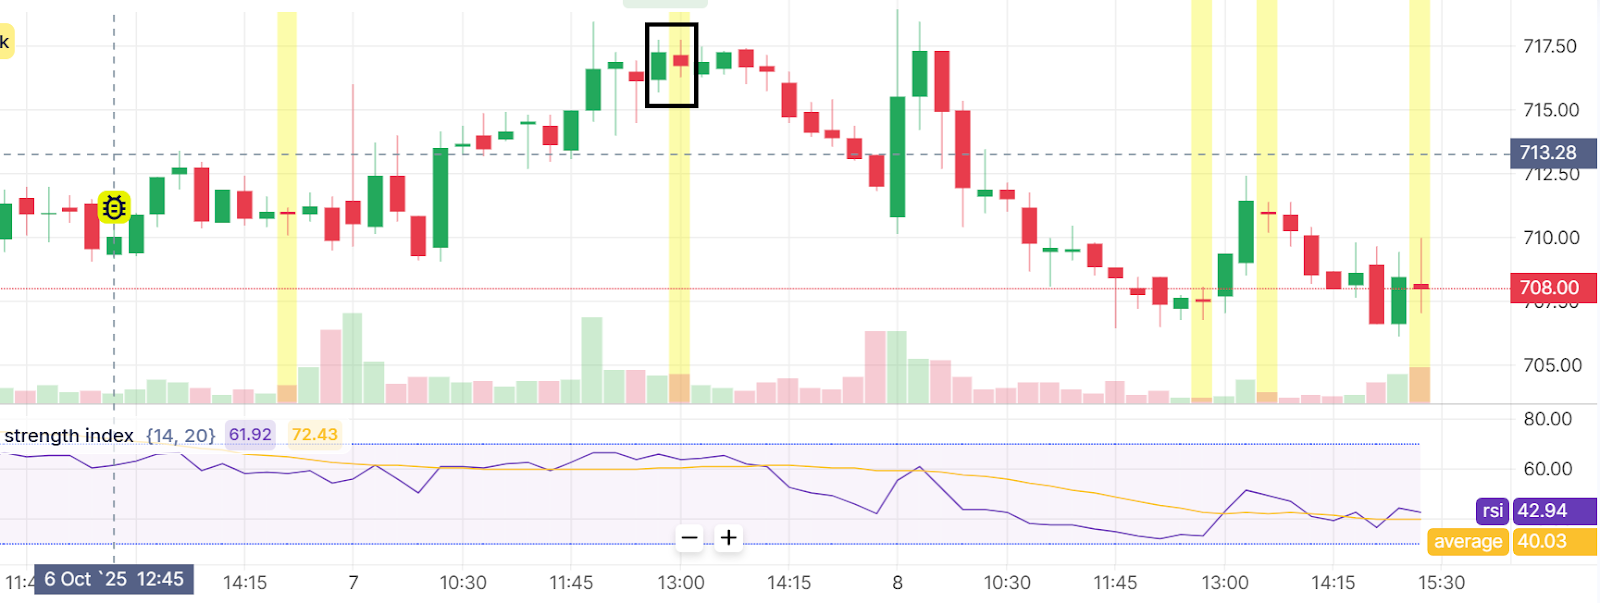
2. Below is the chart of TATA TECHNOLOGIES on a 15-minute timeframe where you can visibly the formation of a bearish harami pattern used in combination with RSI, which is also further followed by a downtrend.
Advantages
Super Easy to Spot – You do not need to be an expert to recognise this candle pattern. It is made up of two candles, one big and one small, almost inside it.
Works on Any Market or Timeframe – Whether you are into stocks or commodities, the Harami pattern forms across all kinds of charts. It also works on daily, weekly, or even hourly timeframes, which makes it flexible.
Early Reversal Signal – The pattern often appears before a big move happens. It is like a hint that the current trend might be slowing down, giving you a chance to prepare for a possible change in direction.
Limitations
Needs Confirmation – The Harami alone is not a “go” signal. You should always wait for a confirming candle or another indicator before entering a trade. Jumping in too early can land you in the wrong execution of trades.
Not Great in Choppy Markets – If prices are moving sideways without a proper trend, you will probably see so many Harami-like patterns, most of which will not mean much.
Can Give False Signals – In highly volatile markets, candles often overlap in ways that look like a Harami candle but do not indicate a reversal. That is why confirmation is so important.
The Harami Candlestick Pattern is simple to comprehend and can provide valuable insights into the inner workings of the market. For traders, this two-candle pattern can be a useful warning. But no candlestick pattern works like magic. Always use it in conjunction with other indicators, such as RSI or moving averages for double-checking, volume monitoring, or waiting for the next candle. When used properly, the Harami pattern can assist you in effectively managing risk and making better trading decisions.
S.NO.
Check Out These Interesting Posts You Might Enjoy!
It is moderately reliable and is not something you should use to trade blindly. When used in combination with other technical indicators, it can be helpful.
Can I use the Harami pattern for intra-day trading?
Yes, you can spot it on the charts of any time frame. However, you need to be careful with short timeframes like 5-minute or 15-minute charts, as false signals can pop up more often.
Can this pattern appear in a sideways or range-bound market?
Yes, they can, but they are less reliable in a sideways market because there is no clear trend to reverse.
What is the difference between Harami and an Engulfing pattern?
They are almost opposites. In an engulfing pattern, the second candle completely covers up or engulfs the first one, suggesting a strong shift in momentum.
Does the size of candles matter in Harami Pattern?
It does! A bigger first candle and a noticeably smaller second candle show that people are less sure of what they want to do.
What do you think, can a company make its bill payment on time? This is such a basic thing right, but it turns out to be the most important thing for an investor to know about.
A company can be profitable in paper but if there is not enough cash to meet the immediate debts then it could be a serious trouble for the company. And this power to pay short term bills is what is known as “Liquidity”.
You can relate it by thinking of it as your monthly budget, where you are earning a good salary but all your bills have a due date of 2nd of every month on the other hand your company releases the salary on every 7th this here is a liquidity problem. Now imagine this on a bigger scale where big companies also face this problem.
Some simple tools like liquidity ratios can be used to understand the company’s liquidity, as it helps in quick financial health check-up of the company. Here in this blog we will be learning about the two most popular ratios, the current ratio and quick ratio by looking at their key differences for our journey to be a smart investor.
What are Liquidity Ratios?
Liquidity ratios can turn out to be a company’s financial thermometer that gives you quick knowledge about how capable a company is in paying its bills that are due within the next year. They do this by comparing the things a company owns that can be quickly turned into cash (known as current assets) with the bills it has to pay soon (known as current liabilities).
These ratios are beneficial for the investors as they help in giving early warning signs if the company is struggling to pay its bills, or its risk and even if this could affect the stock price. Even financial institutions like banks look at these numbers before they lend money to these companies. So when you’re looking at a stock on a platform like Pocketful, these ratios give you an inside look into the company’s real financial health.
The Current Ratio
It is one of the most common and famous liquidity ratios, which gives you a broad, overall look at the company’s power to pay its bills on time. It helps investors with one simple thing, the company’s liquidation ability to pay its upcoming bills for the next 12 month period. It helps investors in checking if the company has a good safety net for the upcoming year ahead.
Formula
To calculate the current ration there is a simple formula:
Current Ratio = Current Liabilities / Current Assets.
Here to find out the current ratio, the current liabilities are divided by the current of the company.
Here Current Assets means all the things that a company owns and can turn it into cash within one year. This includes things like cash in the bank, money that the customers owe to the company, goods in their warehouse (inventory) and even the bills that are paid in advance. On the other hand Current liabilities are the bills and debts that the company has to pay within one year, this also includes money owed to the suppliers and any short term loans taken by the company.
What Does the Number Mean?
A ratio above 1 is usually a good sign as it shows that the company has more assets than bills. For instance, a ratio of 2 means the company has Rs.2 of assets for every Rs.1 of bills that the company needs to pay. A ratio below 1 can be a warning as it suggests the company might find it tough to pay all its bills on time. Generally experts say that a ratio between 1.5 and 2.0 is healthy for a company.
Let’s look at a simple example, say we have a company, “Bharat Gadgets Ltd” which has a current assets value of Rs.10,00,000 and its current liabilities are of Rs.5,00,000. So the Current Ratio of the company = Rs.10,00,000 / Rs.5,00,000 = 2.0. This means Bharat Gadgets has Rs.2 ready for every Rs.1 it owes.
Advantages of Current Ratio
Super Calculation You can find these numbers easily on a company’s financial statements and using the formula you can easily find out the current ratio.
Quick Health Check: It gives you a fast, simple snapshot of the company’s financial situation and its ability to pay the bills.
Disadvantages of Current Ratio
Inventory Problem: This is the main issue as the Current Ratio treats all assets the same. But what if some assets are old or outdated that are not saleable in the current market and cannot turn instantly into cash for the bill payments. This can help in looking the company healthier but in reality there is a different story.
This problem is exactly why we have another, stricter test.
The Quick Ratio that is also known as “Acid-Test Ratio,” which is a type of a financial fire drill. It was invented to fix the inventory problem that we have just seen in the current ratio. It helps in looking at the company’s health more clearly and strictly.
This ratio helps in telling the investors that if the company needs to pay all its bills tomorrow could it do it without having a fire sale to sell its inventory. In quick ratio the assets that can be turned quickly into cash within 90 days are only considered.
Formula
To find out the quick ration, you need to use the following formula:
Quick Ratio = Current Assets − Inventory − Prepaid Expenses / Current Liabilities
In this the inventory is subtracted as there is no guarantee if the inventory can be quickly sold or not and also the prepaid expenses are removed, because you can’t use the office rent you paid in advance to pay your suppliers. Here only the assets that can be quickly liquidated are considered.
What Does the Number Mean?
Here, the magic number is 1. A ratio of 1 or more is great. It means the company can pay all its current bills without touching its stock of goods. A ratio below 1 means the company really depends on selling its inventory to stay afloat. If sales suddenly stop, it could be in a tight spot.
Let’s look at the example of Bharat Gadgets once again where current assets are of Rs.10,00,000 and the current liabilities are of Rs.5,00,000, but here Rs.6,00,000 is just the inventory (asset) sitting in the warehouse. So to find out the quick ratio you need to:
Here the company is having the current ratio of a solid 2.0 but its quick ratio is only 0.8, which helps the investors to see and know that Bharat Gadgets needs to keep selling its products to pay the upcoming bills. A sudden dip in sales can create a big problem for them.
Advantages
Realistic Numbers: It gives the investors a real sense of how a company would deal in a real cash crunch situation.
Portrays Inventory Risk: This gives a clearer picture of how much a company is holding as an asset in its inventory.
Disadvantages
Stricter Checks: Quick Ratio might make a perfectly healthy business that is dependent on inventory look weak as the whole business is about moving inventory fast.
All current assets (Cash, Bills from customers, Inventory)
Only the fastest assets (Cash, Bills from customers)
Difference
It includes inventory.
It excludes inventory.
How Strict Is It?
More relaxed and general.
Much stricter, like a “worst-case scenario” test.
Scoring
Usually, 1.5 to 2.0 is seen as healthy.
1.0 or above is considered strong.
What It Tells You
The company’s general financial health for the year.
How well the company can survive a sudden crisis.
The key thing to remember is that the difference between the two ratios tells you a story about the company’s inventory. If there’s a big gap between the two numbers, it means the company’s safety depends a lot on selling its products.
Smart investors and banks look at both ratios together to get the full picture.
The Current Ratio is like a regular health check-up.
The Quick Ratio is like a stress test to see how the company would handle an emergency.
People lending money, like banks, often care more about the Quick Ratio because it’s the safer, more cautious number.When you’re checking out a company on the Pocketful app, try looking at both. It will tell you so much more than just the stock price.
In this blog you have learnt about two powerful new tools that help you to invest in a more smarter way. Here you have understood the major difference between the current ratio and quick ratio, and now you can now look past the stock price to see the company’s health.
These ratios work best when you use them together and compare the same industry companies. The ratios help the investors with a better understanding and right research for their crucial investments.
S.NO.
Check Out These Interesting Posts You Might Enjoy!
What is the main difference between the current ratio and the quick ratio?
The main difference is that the quick ratio is stricter because it removes inventory (a company’s stock of goods) from the calculation to test if a company can pay its bills right away.
Is a current ratio of 2 always a good thing?
Not always, though it is generally healthy but it could also mean the company has too much cash sitting around and isn’t using it to grow. It’s always best to compare it to other companies in the same industry.
Quick ratio also called the “acid-test” ratio. Why?
It is because here the investors get to know the real financial strength of the company, just like the old acid test used to find out if gold was real or not.
For a company that sells services, which ratio is more important?
The quick ratio is usually more important as these companies don’t have much inventory, their current and quick ratios will be very similar, and the quick ratio focuses on what matters most to them, cash and money owed by clients.
Can a company fully operate if the quick ratio is less than 1?
Yes, it’s possible for businesses that sell their inventory very quickly, like a supermarket. But for most companies, a ratio below 1 is a sign of higher risk.
India’s REIT market has grown rapidly over the past few years. The total AUM of all listed REITs is projected to reach approximately ₹2.35 lakh crore by 2025, and over ₹2,331 crore was distributed to investors in Q2 FY26 alone. This clearly demonstrates that REITs have become a reliable, transparent, and income-focused option for Indian investors. If you want stable “rental-like” income without purchasing a property, REITs offer a simple, low-capital, and professionally managed path. In this blog, we’ll explore the best REIT stocks in India for 2025 and what to consider when selecting them.
What Are REITs?
REITs, or Real Estate Investment Trusts, are investment vehicles that pool funds from multiple investors and invest in large commercial properties such as office parks, malls, or industrial spaces. They operate under SEBI regulations, ensuring transparent and well-monitored operations.
How do REITs work?
When you purchase REIT units, you essentially own a small portion of those properties. REITs collect the rental income generated by these properties and distribute it to investors. Regulations require REITs to distribute at least 90% of their earnings to investors—making them a stable, regular income generating option.
Differences between REITs, Property, and Real Estate Stocks
The biggest advantage of REITs is that you don’t need to purchase, manage, or find tenants for the properties.
Direct Property: More money and more responsibility
Real-Estate Stocks: Investing in a developer company, without the benefit of rentals
REITs: Low investment, professional management, and the potential for regular income
Therefore, REITs are ideal for those who want to get involved in real estate but don’t want the hassle.
Regulation and Reliability
REITs in India are governed by the SEBI REIT Regulations, 2014. This ensures that:
The portfolio invests only in quality, income-generating properties
Regular reporting and disclosures are in place
Strict regulations are followed to protect investors
Due to this strict framework, REITs are considered highly trustworthy among investors today.
A brief overview of the best REIT Stocks Companies in India is given below:
1. Knowledge Realty Trust
Knowledge Realty Trust is considered India’s newest REIT, launched in 2025. This REIT was formed in partnership with Sattva Group and Blackstone, and its focus is on providing modern office campuses and commercial space to investors. Knowledge Realty Trust aims to provide business parks tailored to the needs of large companies. Its entry adds another strong option to the Indian REIT market, bringing properties to locations where corporate demand is steadily growing.
2. Embassy Office Parks REIT
Embassy Office Parks REIT is India’s first REIT, launched in 2019. Its launch brought this entire model to prominence in India. This REIT operates office parks and business distributed complexes spread across major cities across the country—Bengaluru, Mumbai, Pune, and NCR. Its initial infrastructure was strengthened by a partnership with Embassy Group and Blackstone. Its campuses have been developed to meet modern office needs, making it a significant presence in areas with high corporate activity.
3. Mindspace Business Parks REIT
Mindspace Business Parks REIT was launched in 2020 and developed by K Raheja Corp. This REIT operates large office parks in four major business cities across the country Mumbai, Hyderabad, Pune, and Chennai. Mindspace is known for its well-organized business zones, spacious campuses, and corporate-friendly locations. Its projects are designed to provide companies with a complete suite of amenities within a single complex. It has established its distinct identity in a short time.
4. Nexus Select Trust
Nexus Select Trust is India’s first retail-focused REIT, launched in 2023. It operates several large malls and retail centers across the country. Its properties are located in major cities like Bengaluru, Chandigarh, Hyderabad, and Mumbai, which have a high level of foot traffic. Nexus focuses on shopping spaces developed with the needs of urban consumers in mind. Its presence is linked to India’s growing organized retail sector.
5. National Highways Infra Trust (NHIT)
The National Highways Infra Trust, launched by the NHAI in 2021, focuses on operating India’s toll road network and major highway corridors. The trust manages routes that are frequently used and connect traffic between states. The NHIT aims to manage long-term road projects in a structured manner to strengthen national connectivity. Its projects are primarily based on existing roads, allowing it to focus on operational management.
6. Brigade Enterprises Ltd
Brigade Enterprises Ltd is an established real estate company, founded in Bengaluru in 1986. The company is known for developing office parks, retail centers, and residential projects in South India. Over the years, Brigade has steadily expanded its presence in urban development areas, particularly in Bengaluru, Chennai, Kochi, and Hyderabad. Its construction style and project planning focus on systematic design and user convenience. This long-standing company maintains its presence in urban real estate.
7. Brookfield India Real Estate Trust
Brookfield India Real Estate Trust was incorporated in 2021 and is backed by the Brookfield Group’s global real estate heritage. This REIT operates office complexes spread across four major Indian business cities Mumbai, Noida, Gurugram, and Kolkata. Its properties have been developed as modern business campuses with amenities tailored to corporate needs. Brookfield’s international background and project management style make it unique in this field.
8. Vertis Infrastructure Trust
Vertis Infrastructure Trust is a new infrastructure-focused trust, established around 2024. The trust focuses on projects that provide direct-use public and logistics connectivity. Its portfolio primarily involves roads and regional transport routes. Vertis aims to execute projects that maintain the smooth functioning of important travel routes. It is gradually expanding its presence in various states, particularly focusing on road networks.
9. Sunteck Realty Ltd
Sunteck Realty Ltd, founded in 1981, is known for residential and mixed-use projects in Mumbai. The company has developed planned residential and urban projects in several key areas of the city BKC, Oshiwara District Centre, Naigaon, and Mira Road. Sunteck is renowned for its design style, location selection, and systematic construction. The company’s special focus is on developing projects keeping in mind the modern living needs in metro cities, due to which it has consistently maintained its identity.
10. Anantam Highways Trust
Anantam Highways Trust is a new and emerging infrastructure trust established in recent years. The trust primarily oversees projects related to regional and national highways. Its focus is on highways with high daily traffic volumes and long-term service life. The trust’s objective is to ensure the smooth operation and maintenance of such corridors to ensure ease of travel and freight movement.
The key performance metrics of REIT Stocks are mentioned below:
Company
Operating Margin (%)
Net Profit Margin (%)
ROE (%)
ROCE (%)
Debt to Equity
Knowledge Realty Trust
74.10
5.66
10.51
13.47
9.35
Embassy Office Parks REIT
78.59
38.64
2.78
4.61
0.36
Mindspace Business Parks REIT
0.00
0.00
3.55
4.57
0.28
Nexus Select Trust
97.81
83.58
5.28
6.02
0.15
National Highways Infra Trust
–
–
–
–
–
Brigade Enterprises Ltd
26.89
13.41
12.18
12.77
3.10
Brookfield India Real Estate Trust
130.36
113.20
4.63
5.15
0.04
Vertis Infrastructure Trust
99.96
52.83
8.19
11.31
0.44
Sunteck Realty Ltd
26.07
17.40
4.61
6.46
0.12
Anantam Highways Trust
–
–
–
–
–
How to Evaluate the Best REITs in India
Yield Quality : Steady and long-term cash flow is paramount when choosing a REIT. The average yield of Indian REITs in 2025 is around 6.5-7.5%, but a sustainable yield is achieved only when rents are regular and the property portfolio is strong.
Occupancy and Rental Health : High occupancy and a long WALE indicate a reliable REIT. Major REITs have occupancy between 88-93% in 2025, indicating the stability of their rental flow.
Tenant Mix : A diverse tenant base and the presence of strong multinational companies reduce risk. Excessive dependence on a single industry or large tenant can make a REIT unstable.
Balance Sheet Strength : The level and cost of debt directly impact the sustainability of a REIT. The average cost of debt for better REITs in 2025 is around 7.8-8.5%, reflecting their financial control capabilities.
NAV and Market Valuation : The trading price relative to NAV indicates whether a REIT is available at a discount or premium. REITs with strong portfolios often trade at a premium, while the reasons for discounted REITs need to be examined.
Sponsor and Management Quality : REITs with prominent sponsors, transparent reporting, and experienced management teams tend to perform better over the long term. Reliable sponsors ensure stability and trust for investors.
Step-By-Step Guide: How to Invest in REITs in India
Step 1: Open a Demat and Trading Account
First, you’ll need a demat and trading account. You can get started with a free account opening, free AMC, and free delivery investments at a stock broker like Pocketful. Pocketful also offers the lowest interest rate of just 5.99% for MTFs, making leveraged investing affordable.
Step 2: Select REIT Units and Place an Order
Search the tickers of REITs listed on the NSE/BSE (such as Embassy, Mindspace, Brookfield, etc.), check their basic data, yield, and occupancy, and place a buy order like you would a normal share.
Step 3: Understand Distributions and Dates
Revenue from REITs comes in the form of distributions. Pay attention to the ex-date and record date, as these dates determine who receives the distribution.
Step 4: Review 1-2 times a year
Check the REIT’s occupancy, debt level, yield, and management commentary at least 1-2 times a year. If fundamentals change or the allocation becomes too large, rebalance the portfolio.
Common Mistakes to Avoid While Choosing the Best REIT in India
Chasing High Yields : Many investors are attracted by the highest yields, but the true value of REITs in 2025 lies in their yield stability. REITs with volatile cash flows increase risk over the long term.
Ignoring Vacancy and Tenant Risk : Lower occupancy or the possibility of tenant change directly impacts a REIT’s income. A good REIT is one with strong occupancy and a diversified tenant base.
Overinvesting in Office REITs : The main REITs in India are in the office segment, but overreliance on a single sector can lead to an unbalanced portfolio. Balancing exposure is essential when investing.
Not Understanding the Tax Structure : REIT distributions in 2025 fall into three components interest, dividend, and repayment—all of which have different tax implications. Making decisions without understanding this can lead to miscalculated net returns.
Treating REITs like Fixed Deposits : REITs are market-linked and their prices can fluctuate in the short term. It’s not fair to consider them instruments with fixed returns like fixed deposits.
Conclusion
REITs in India have opened up an easy way for investors to get involved in commercial property. It’s now possible to become a part of large office parks, retail centers, or highway projects with even a small investment. Each REIT has its own model and focus, so when choosing, consider the type of properties that best suit your needs. If stability and a simple start are your goals, REITs can be a viable option.
S.NO.
Check Out These Interesting Posts You Might Enjoy!
Meesho, one of India’s fast-growing e-commerce platforms backed by prominent investors, is launching an initial public offering (IPO) to raise up to ₹5,421.20 crore. The issue opens for subscription on December 3, 2025, and will close on December 5, 2025, with a price band fixed at ₹105 to ₹111 per share. The IPO comprises a fresh share issuance of ₹4,250 crore and an offer-for-sale (OFS) of about ₹1,171.20 crore by existing shareholders. The shares are proposed to be listed on both the Bombay Stock Exchange (BSE) and the National Stock Exchange of India (NSE), with tentative listing scheduled for December 10, 2025, subject to allotment and regulatory approvals.
Meesho,IPO Day 3 Subscription Status
On Day 3, Meesho. IPO witnessed a strong investor turnout, closing with an overall subscription of 81.76 times. The Qualified Institutional Buyers (QIB) category with a robust 123.34 times subscription, indicating solid institutional participation. Among Non-Institutional Investors (NII), the bNII (above ₹10 lakh) portion was subscribed 43.64 times, while the sNII (less than ₹10 lakh) segment saw Robust Leading with 32.28 times subscription, resulting in an overall NII subscription of 39.85 times. The Retail Individual Investors (RII) category was subscribed 19.89 times, reflecting healthy retail interest. Overall, the issue garnered 62,75,381 applications, with total bids amounting to approximately ₹62,75,381 crore, showcasing strong confidence across investor categories in the company’s growth potential.
Investor Category
Subscription (x)
Qualified Institutional Buyers (QIB)
123.34
Non-Institutional Investors (NII)
39.85
bNII (above ₹10 lakh)
43.64
sNII (less than ₹10 lakh)
32.28
Retail Individual Investors (RII)
19.89
Total Subscriptions
81.76
Total Applications: 62,75,381
Total Bid Amount (₹ Crores): ₹62,75,381
How to Check Meesho IPO Allotment Status?
Meesho IPO allotment can be easily checked online in two ways: from the Registrar’s website and from the BSE or NSE website. This IPO will be listed on both the exchanges – BSE and NSE, so the allotment status will be available to all investors on both platforms.
Meesho plans to utilize the net proceeds from the fresh issue for the following purposes. The proceeds from the Offer for Sale (OFS) will be received by the selling shareholders and not by the company :
Use of IPO Proceeds
Amount (₹ Cr)
Investment in cloud infrastructure (via subsidiary)
1,390
Salaries for AI / ML and technology teams (tech development)
480
Marketing, brand-building and customer acquisition initiatives
1,020
Inorganic growth (acquisitions / strategic initiatives) & general corporate purposes / working capital
1,360
Meesho IPO GMP – Day 3 Update
The grey market premium (GMP) of the Meesho IPO stands at ₹₹48 as of December 05, 2025 (Day 3). Considering the upper end of the price band at ₹111 per share, the estimated listing price is around ₹159, reflecting a potential gain of approximately 43.24% per share in the grey market.
Date
GMP
Est. Listing Price
Gain
05-12-2025 (Day 3)
₹48
₹159
43.24%
Disclaimer: The above GMP (Grey Market Premium) is just unofficial market information, which is not officially confirmed. These figures are shared for informational purposes only and investment decisions based on these should be based on the investor’s own research and discretion. We do not conduct, recommend or support any kind of transaction in the grey market.
Meesho IPO – Key Details
Particulars
Details
IPO Opening Date
December 03, 2025
IPO Closing Date
December 05, 2025
Issue Price Band
₹105 to ₹111 per share
Total Issue Size
48,83,96,721 shares(aggregating up to ₹5,421.20 Cr)
Meesho is one of India’s fastest-growing e-commerce platforms, designed to make online shopping affordable and accessible while empowering small businesses and home-based entrepreneurs. Operating a zero-commission, asset-light marketplace, it uses advanced AI, analytics, and automation to optimize product discovery, pricing, and logistics. Meesho has built strong penetration across Tier 2 and Tier 3 cities, serving millions of value-seeking consumers and sellers. Its technology-driven model enables low customer acquisition costs, faster deliveries, and scalable operations. As the company continues to expand, it remains focused on sustainable growth, profitability, and strengthening its position in India’s digital commerce ecosystem.
Frequently Asked Questions (FAQs)
What is the opening and closing date of the MeeshoIPO?
Groww IPO is open on December 03, 2025 and will close on December 05, 2025.
What is the price band of the Meesho IPO?
Its price band is fixed from ₹105 to ₹111 per share.
What is the GMP (Grey Market Premium) of the Meesho IPO today?
The GMP on December 04, 2025 is ₹48, which leads to a possible listing price of ₹159.
What is the total issue size of the Meesho IPO?
The total issue size of the MeeshoIPO is ₹5,421.20 crore, structured as a combination of fresh issue and Offer for Sale (OFS) by existing shareholders.
What is the expected listing date of the Meesho IPO?
This IPO is expected to be listed on BSE and NSE on December 10, 2025.
Aequs Limited, a key player in the aerospace manufacturing ecosystem and operator of one of India’s largest dedicated aerospace SEZs, has opened its highly anticipated ₹400 crore IPO, comprising a fresh issue of ₹300 crore and an offer for sale of ₹100 crore. The public issue opened for subscription on December 2, 2025, with a price band of ₹397–₹420 per share, and will remain open until December 4, 2025. Once the allotment process is completed, Aequs Limited is scheduled to list its shares on both the BSE and NSE on December 9, 2025.
Aequs Ltd. IPO Day 3 Subscription Status
Aequs Ltd’s IPO concluded on Day 3 with an exceptionally strong overall subscription of 104.30 times, reflecting intense demand across all investor categories. Qualified Institutional Buyers (QIBs) led the frenzy with a massive 122.93 times subscription, followed closely by Non-Institutional Investors (NIIs), who subscribed 83.61 times overall. Within the NII segment, sNII (less than ₹10 lakh) bids came in at 91.13 times, while bNII (above ₹10 lakh) saw 79.86 times subscription. Retail Individual Investors (RII) also showed overwhelming interest, subscribing 81.03 times, and even the Employee quota—typically more moderate—was subscribed 37.86 times.
Investor Category
Subscription (x)
Qualified Institutional Buyers (QIB)
122.93
Non-Institutional Investors (NII)
83.61
bNII (above ₹10 lakh)
79.86
sNII (less than ₹10 lakh)
91.13
Retail Individual Investors (RII)
81.03
Employees
37.86
Total Subscriptions
104.30
Total Applications: 44,16,042
Total Bid Amount (₹ Crores): 52,972.46
How to Check Aequs Ltd. IPO Allotment Status
Aequs Ltd. IPO allotment can be easily checked online in two ways: from the Registrar’s website and from the BSE or NSE website. This IPO will be listed on both the exchanges – BSE and NSE, so the allotment status will be available to all investors on both platforms.
Aequs Ltd. plans to utilize the net proceeds from the fresh issue for the following purposes:
Use of IPO Proceeds
Amount (₹ Cr)
Repayment and/ or prepayment, in full or in part, of certain outstanding borrowings and prepayment penalties
433.17
Funding capital expenditure to be incurred on account of purchase of machinery and equipment by company
8.11
Funding capital expenditure to be incurred on account of purchase of machinery and equipment by one of the wholly-owned Subsidiaries, AeroStructures Manufacturing India Private Limited, through investment in such Subsidiary
55.89
Funding inorganic growth through unidentified acquisitions, other strategic initiatives and general corporate purposes
–
Aequs Ltd. IPO GMP – Day 3 Update
The grey market premium (GMP) of Aequs Ltd. IPO is ₹45, as on 5:00 PM December 05, 2025. The upper limit of the price band is ₹169 and the estimated listing price as per today’s GMP can be ₹45, giving a potential gain of around 36.29% per share.
Date
GMP
Est. Listing Price
Gain
07-10-2025 (DAY 3)
₹45
₹169
36.29%
Disclaimer: The above GMP (Grey Market Premium) is just unofficial market information, which is not officially confirmed. These figures are shared for informational purposes only and investment decisions based on these should be based on the investor’s own research and discretion. We do not conduct, recommend or support any kind of transaction in the grey market.
Aequs Ltd., incorporated in 2000, has evolved into a vertically integrated precision manufacturing company with a strong foundation in the aerospace segment. Operating a dedicated Special Economic Zone, the company delivers end-to-end manufacturing capabilities, producing components for engine systems, landing gear, cargo structures, interiors and complex assemblies. Over time, Aequs has diversified beyond aerospace to include consumer electronics, plastics and consumer durables, broadening its technological footprint. As of September 30, 2025, the company had produced over 5,000 aerospace products across major global aircraft programs such as the A220, A320, B737, A330, A350 and B787. Its product portfolio spans structures, interiors, landing systems and actuation systems, reflecting deep engineering expertise. With a workforce of more than 4,500 employees across various roles, Aequs benefits from an experienced talent pool. Its competitive strengths include advanced precision capabilities, a vertically integrated ecosystem, global manufacturing presence and long-standing partnerships with high-entry-barrier customers. Supported by a founder-led leadership team, Aequs is positioned as a significant player in global precision manufacturing.
Frequently Asked Questions (FAQs)
What is the opening and closing date of the Aequs Ltd. IPO?
Aequs Ltd. IPO is open on 03 December 2025 and will close on 05 December 2025.
What is the price band of the Aequs Ltd. IPO?
Its price band is fixed from ₹118 to ₹124 per share.
What is the GMP (Grey Market Premium) of Aequs Ltd. IPO today?
The GMP on 05 December 2025 is ₹45, which leads to a possible listing price of ₹169.
What is the total issue size of Aequs Ltd. IPO?
The total issue size of the Aequs Ltd. IPO is ₹921.81 crore, comprising of a fresh issue ₹670 crore and an offer for sale (OFS) of ₹251.81 crore.
What is the expected listing date of Aequs Ltd.?
This IPO is expected to be listed on BSE and NSE on 10 December 2025.
While trading through a mobile application, you must have seen different types of prices, including opening, closing, high, low, etc. But there is another number you must have seen, which is called “ATP” or “Average Traded Price”. This price is very useful for a trade, and they often use it as a key indicator.
In today’s blog post, we will give you an overview of Average Traded Price, how it is calculated, and its importance through an example.
What is the Average Trading Price?
An Average Trading Price of ATP is the price of a share at which a particular stock was traded in a single day or a specific duration. It is generally the average price at which stocks have been bought and sold by the various investors during a day. It provides a sentiment related to the stock price movement. The ATP indicates the demand and supply of stock during the day.
How is Average Trading Price Calculated?
The formula to calculate the Average Trading Price is as follows:
Average Trading Price = Total Traded Value/Total Traded Volume
Whereas:
Total Traded Value: The total traded value includes the value of all individual trades.
Total Traded Volume: This includes the total number of shares which were bought and sold during the specified period.
Example of Average Trading Price
Let’s understand the average trading price through an example.
Suppose 1,00,000 shares of a company named XYZ were traded at different prices throughout the day on 5th May 2025, and the total traded value is 50,00,000. Let’s calculate the average trading price using the formula below.
Average Trading Price = Total Traded Value/Total Traded Volume
Here, the Total Traded Value is 50,00,000. And the total traded volume is 1,00,000 shares.
Hence, 50,00,000/1,00,000
= 50
Therefore, the average trading price of XYZ Company Limited on 5th May 2025 is 50 INR.
The key importance of the average trading price is as follows:
Key Indicator: The average trading price is an important indicator as it shows the average market momentum. It is better than the last trading price.
Helpful in Intraday Trading: Traders often use the average trading price to set support and resistance levels.
Decision Making: If the stock price is trading above the average trading price, it helps a trader identify bullish momentum, and vice versa.
Market Sentiments: The Average trading price market sentiment of buyers and sellers agreed during the day.
Difference Between Average Trading Price and Volume Weighted Average Price
The difference between the average trading price and volume-weighted average price is as follows:
Particular
Average Trading Price
Volume-Weighted Average Price
Formula
Total Value of Share Traded/Total Volume of Shares Traded
Cumulative Price*Volume/Cumulative Volume of Every Trade
Time
It generally measures at the end of the day or the end of a specific session.
It measures intraday changes in real-time.
Usage
ATP makes it easy for a trader to access the general price level of stocks.
It is typically useful for institutional investors as it also considers the volume.
Where to Check the Average Traded Price
One can check the average trading price at the following places:
Trading Platforms: Almost all the brokers provide an average trading price on the trading platform provided by them. One can find ATP in the market depth section of the stock price.
Exchange Website: One can visit the website of the National Stock Exchange or Bombay Stock Exchange, both exchanges publish the average traded price data on a real-time basis. The ATP are available on the stock detail page.
Data Providers: There are various market data providers or financial websites which provide data on the average trading price along with the current market price.
Trading Terminals: The terminals through which one can trade, provided by your stock brokers such as Odin, NEST, etc., also show average trading price data on the quote window.
What is the Use of Average Traded Price for Traders?
The average traded price is a key indicator for traders to identify the price movement of a stock. It can be helpful for a trader in the following manner:
Identifying Market Trend: Generally, when a stock price is traded above the average traded price, it generally indicates a bullish trend or suggests that buyers are taking a position, and vice versa.
Entry Point: Intraday buyers take a buy position when the current market price sustains above the average trading price, as it provides them an opportunity to earn profit by going long in a trade.
Support and Resistance: The Average Traded Price acts as a psychological support or resistance for the traders. Hence, a trader can act based on the average traded price.
Conclusion
On a concluding note, Average Traded Price is a key factor for a trader while initiating a trade. Unlike the last traded price, the average traded price gives you an overview of the price at which most of the trade takes place during a particular trading session. However, it is not advisable to use the average trading price as a key tool for initiating trade; it should be combined with other indicators such as VWAP, moving average, etc. Along with this, it is advisable to consult your investment advisor before initiating any trade.
S.NO.
Check Out These Interesting Posts You Might Enjoy!
Is the Average Traded Price fixed for a particular day?
No, Average Trading Price changes throughout the day based on the executed trade quantity and volume.
Can a long-term investor use ATP as a key indicator?
Generally, Average Traded Price is used by intraday traders, and long-term investors execute their trades based on the fundamental analysis.
Is it good to buy stock below the average trading price?
No, it is generally not suggested to buy stocks below their average trading price, as it could be a sign of weakness or short build-ups in the stock.
Are the Average Traded Price and Last Traded Price are same?
No, the average traded price indicates the average price at which trades are executed on a particular trading session, whereas the last traded price shows the price at which the last trade was executed.
What is the use of Average Traded Price?
An average traded price is useful for a trader as it can help them identify the market sentiments, entry, exit points, and find the support and resistance of a stock.
Individuals often overlook the fact that rare earth elements are an important part of our lives. Rare earths are becoming more and more important as the world moves toward cleaner energy and more advanced gadgets. This domain is still in its nascent stage in India. There are not many companies that focus on rare earths yet, but demand is growing. The government is pushing for exploration, and some companies have started to experiment with minerals that have rare earth elements in them.
In today’s blog, we will explore some companies that are currently working in this sector and what opportunities and risks they pose.
Rare Earth Stocks – An Overview
The rare earth stocks are getting a lot of attention lately. These minerals power so many things we use every day, from electric vehicles to smartphones to wind turbines. So when a company is involved in mining or processing these elements, people start seeing it as a part of the future of technology. In India, the rare earth space is still pretty young. We do not have many pure rare earth companies yet, but a few companies are working with minerals like monazite and other heavy sands that contain rare earths.
Why are Rare Earths becoming important?
1. The Electric Vehicle Boom – Electric cars cannot function without rare earth magnets. EV motors use neodymium and praseodymium magnets, some of the strongest permanent magnets in the world. These magnets make the motors lighter, more efficient, and more powerful. This directly increases demand for rare earth elements, especially magnet materials.
2. Rare Earths Are Hidden Inside All Our Everyday Gadgets – You may not see them, but rare earths are inside almost every device you use, be it smartphones, laptops, smart TVs, earbuds and speakers, hard drives, and LED lights. They help make displays bright and colourful, create powerful yet tiny magnets for speakers, and improve battery performance.
3. China Dominates the Global Supply, Creating a Strategic Risk
China currently controls:
60–70% of rare earth mining
80–90% of global rare earth processing
Even if a country has rare earth deposits, China still controls most of the refining capacity, which creates a huge geopolitical risk because prices can be influenced by China’s export policies. Supply chain disruptions can slow down EV and electronics production. This is one of the biggest reasons rare earths have become a global priority.
IREL was established in 1950 and is an important company in India’s rare earth space. It started by working with beach sand minerals like monazite and ilmenite along the southern and eastern coasts. Over the years, it grew into India’s main supplier of rare earth materials used in defence, electronics, and clean energy.
2. GMDC (Gujarat Mineral Development Corporation)
GMDC was founded in 1963 under the Government of Gujarat to efficiently use the state’s mineral resources. The company began primarily in lignite, but expanded over the years to include bauxite, manganese, and other key minerals. It has most recently developed an interest in rare earths and critical minerals. The company holds decades of experience and enjoys strong government support.
3. Hindustan Copper Limited
HCL has been India’s main copper mining and processing company since 1967. Even though it is not a direct rare earth company, its mines contain associated minerals that could hold rare earth elements. As technology improves, extracting these materials may become easier. Because of its history and strong presence in mining, HCL is often mentioned as a company that could benefit from India’s growing focus on critical minerals.
4. MOIL Limited
MOIL is one of the oldest mining companies in India and origins back to 1896. It became a government-owned company in the 1960s and is now the country’s largest producer of manganese ore. While manganese is not a rare earth element, it is used in batteries and other new-age technologies. Its long experience in mining gives it room to explore opportunities in related mineral segments over time.
5. NLC India
NLC India has been around since 1956, originally set up to mine lignite and supply power to several states. Over the years, it grew into an important energy PSU with strong mining expertise. Recently, NLC has started looking beyond lignite and exploring areas like critical and strategic minerals, including rare earths.
6. Coal India Limited
Coal India, created in 1975, is the world’s biggest coal mining company and a major source of India’s energy needs. It was formed by bringing several coal mines together under one roof to make mining safer and more efficient. Today, Coal India is exploring new opportunities beyond coal, including rare earths found in coal ash and certain sediment-rich areas.
Growing Demand from Future Technologies – The needs for rare earth elements will continue to grow as the adoption of EVs, renewable energy systems, cellular phones and defence systems increases. This gives us a long runway for future growth.
Mineral Potential in India – India has coastal sands that are rich in monazite, the ore form of rare earths, and these resources are currently not effectively utilized, meaning there is strong potential for development.
Government Support – Policies to increase exploration, processing and local manufacturing will help drive momentum in the sector and attract new investment in the future.
Risks of Rare Earth Stocks
Difficult and Expensive Extraction – Mining and refining rare earths require advanced technology, heavy investment, and long project timelines.
Slow Development in India – Many Indian companies are still building the capabilities needed to process rare earths at scale, which may delay progress.
Regulatory and Environmental Challenges – Mining projects need multiple approvals, and strict environmental rules can slow down or halt development.
Rare earth stocks have suddenly become a very discussed topic. These minerals are used in so many things we use every single day, our phones, laptops, headphones, electric cars, and even wind turbines. Since they are such an essential part of modern technology, any company that mines or processes them naturally grabs attention.
In India, this space is still at an early stage. We do not have many companies focused only on rare earths yet. The key is to stay patient, understand the risks, and focus on companies that are genuinely building capabilities for the future.
S.NO.
Check Out These Interesting Posts You Might Enjoy!