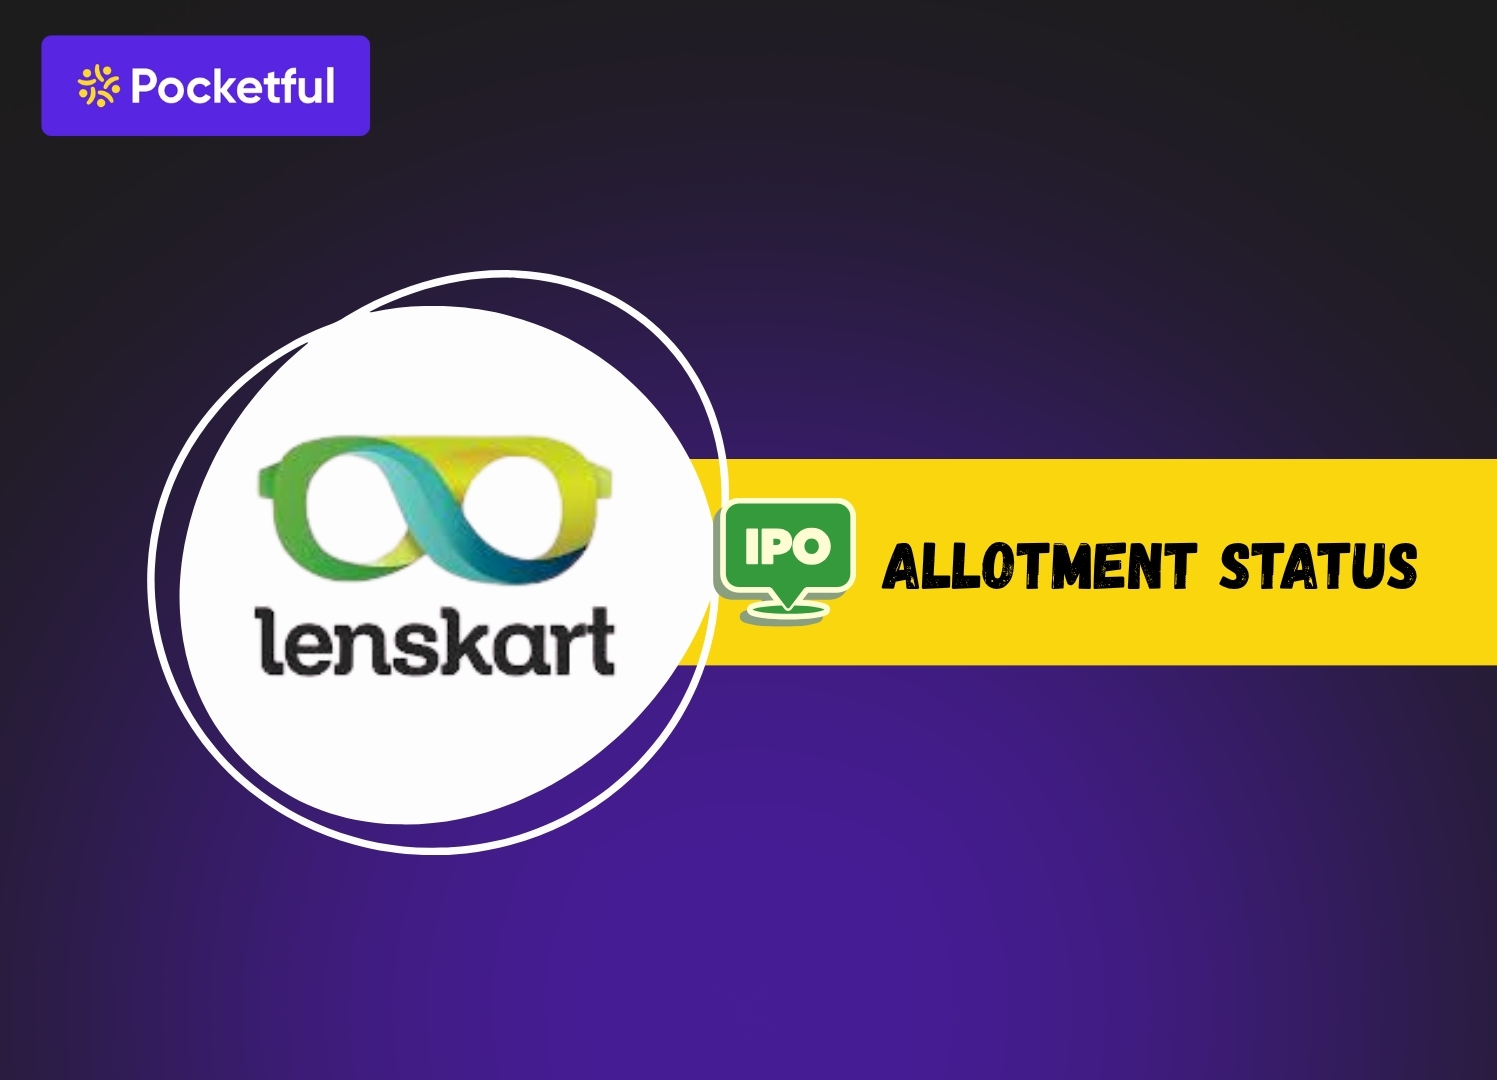
Blog

  • White Spinning Top Pattern

    White Spinning Top Pattern

    Candlestick patterns are important visual indicators that provide traders with a clear picture of market sentiment, helping them predict a future trend. Interestingly, among all the candlestick patterns, one of the best candlestick patterns is the white spinning top pattern— a sign that indicates market indecision and acts as a possible trend reversal, which makes it useful in both bearish and bullish markets. 

    In this blog, we will discuss the White Spinning Top candlestick pattern, its interpretation, advantages and limitations. Moreover, we will provide an example to better understand the trading setup.

    What is the White Spinning Top Pattern?

    The White Spinning Top is a single candlestick pattern often used in technical analysis for trading. It shows market indecision and often indicates a possible reversal or continuation, depending on the context of the previous trend. The characteristics of the pattern are:

    • Small Body: The body of the candle is quite small, suggesting that the closing prices were slightly higher than the opening price.
    • Long Wicks/Shadows: The long upper and lower shadows show substantial price movement throughout the session, yet neither the bulls nor the bears managed to seize complete control.
    • White/Green color: This pattern includes a white (or green) candlestick, showing a bullish trend.

    Interpretation

    The interpretation of the White Spinning Top candlestick pattern is largely determined by the previous trend and the broader market context in which it emerges. Let’s understand the White Spinning Top pattern in a downtrend and an uptrend:

    1. In a Downtrend: Indicates a Possible Bullish Reversal

    A White Spinning Top pattern emerging after a prolonged downtrend often shows a possible weakening of selling pressure. This suggests that while bears have maintained dominance, the appearance of the spinning top pattern shows a slowdown in bearish momentum, showing that buyers are beginning to enter the market. It is often interpreted as a possible trend reversal from bearish to bullish.

    2. In an Uptrend: Indicates a Possible Pause or a Bearish Reversal

    In a well-established uptrend, the emergence of a White Spinning Top signifies market indecision. This shows that while bulls have dominated, their strength might be fading, and the market lacks clear direction. Traders should be careful, as this may lead to a short consolidation before the uptrend continues. As the pattern suggests indecision, it can also signal a bearish reversal.

    Furthermore, the White Spinning Top pattern is not very useful for predicting future trends in a sideways or range-bound market. The situation likely highlights the persistent uncertainty in the market, as buyers and sellers appear to be evenly balanced.

    How to Determine Target and Stop-Loss?

    Setting a target depends on your profit goals based on market conditions. Some of the methods for determining target levels are listed below:

    • Support or Resistance Levels: If the pattern appears after an uptrend, identify the closest support level below the White Spinning Top candlestick to determine the target. In case of a downtrend, identify the nearest resistance level above the White Spinning Top pattern to set your target.
    • Risk-Reward Ratio: This method ensures that even if a small percentage of your trades are profitable, the profits from winning trades will exceed the losses. Traders often use risk-reward ratios of 1:2 or 1:3.

    A stop-loss is crucial to safeguard against huge losses if a trade goes bad. An individual can place a stop-loss based on the following information:

    • Low of the White Spinning Top Candle: If a bullish reversal is expected after a downtrend, then ensure that your stop-loss is placed beneath the low of the White Spinning Top candlestick.
    • High of the White Spinning Top Candle: In a bearish reversal scenario (after an uptrend), position your stop-loss above the high of the White Spinning Top candlestick. By doing so, you can minimize your risk and ensure that you are holding onto trades that align with the prevailing market sentiment.

    Example of White Spinning Top Pattern of Shipping Corp of India ltd.

    Example of White Spinning Top Pattern of Shipping Corp of India ltd.

    The above image shows the formation of a White Spinning Top pattern on the daily timeframe of the Shipping Corporation of India. The stock was in an uptrend, and then it made a White Spinning Top Pattern on 5 February 2024. As the previous trend was bullish, the occurrence of the pattern suggests market indecision and a potential pause in bullish momentum or a bearish reversal. The stock closed at INR 264, i.e., below the low of the White Spinning Top candlestick on 6 February 2024. The bearish candle after the pattern confirmed the bearish reversal, and the stock made a low of INR 210 on 12 February 2024.

    Read Also: Opening White Marubozu Pattern

    Advantages of White Spinning Top Pattern

    The advantages of the White Spinning Top pattern are:

    • Reversal Signal: The White Spinning Top indicates a possible shift in the prevailing trend, whether transitioning from bullish to bearish or vice versa.
    • Useful in Multiple Time Frames: This pattern is versatile and can be used across multiple timeframes, be it daily, weekly, or even long-term charts. It allows traders to easily spot trading opportunities across various time frames.
    • Can be used with Other Indicators: The White Spinning Top pattern works best alongside other technical indicators, such as RSI, MACD, or moving averages. Pattern signals are quite reliable, especially when used with support/resistance levels or other indicators.

    Limitations of White Spinning Top Pattern

    The limitations of the White Spinning Top pattern are:

    • Indecision: The pattern is indecisive in nature as it doesn’t indicate a clear direction, making it difficult to make quick decisions, and traders may miss trading opportunities while they wait for confirmation.
    • False Signals in Short Time Frames: Short-term traders using 5- or 15-minute time frames may see White Spinning Tops often due to market noise. Unfortunately, these patterns often give more false signals than trading opportunities.
    • Dependence on Market Context: The White Spinning Top pattern has limited use without considering overall market trends or conditions. For example, it may occur during periods of sideways consolidation, reducing its significance for traders seeking trend reversals or breakout signals.

    Read Also: What is Three Outside Up Pattern

    Conclusion

    The White Spinning Top candlestick pattern is a simple yet useful pattern in technical analysis, providing traders with valuable insights into market indecision and the likelihood of trend reversals or continuations. Understanding this pattern can enhance a trader’s ability to anticipate market movements, allowing for more informed decision-making. By monitoring the context in which the White Spinning Top appears, traders can better position themselves for potential opportunities. Even though the pattern lacks clear buy or sell signals, it is beneficial when combined with other technical indicators and patterns.

    Frequently Asked Questions (FAQs)

    1. Example of White Spinning Top Pattern of Shipping Corp of India ltd.

      It is neutral but can indicate a possible bullish reversal in a downtrend or a bearish reversal in an uptrend.

    2. Can the White Spinning Top pattern be used in any market?

      The White Spinning Top pattern can be used in stocks, forex, commodities, and other markets across different timeframes.

    3. What is the difference between a White Spinning Top and a Doji?

      A Doji has little to no body, indicating that the open and close prices of the trading session were approximately equal, while a White Spinning Top has a small body showing slight price movement.

    4. How do I confirm the signal validity of a White Spinning Top pattern?

      Individuals should wait for confirmation in the form of the next candlestick, which helps identify a clear directional move, either bullish or bearish.

    5. Is the White Spinning Top pattern useful in very short time frames?

      Unfortunately, price movements in a very short timeframe are affected by noise, due to which the pattern may generate false signals.

  • Two-Candle Shooting Star

    Two-Candle Shooting Star

    Every individual in the financial market constantly tries to identify investment opportunities and wishes to exit long positions before the bearish trend begins. What if we tell you there is a chart pattern that can help you predict downtrends? The Two-Candle Shooting Star pattern is one such pattern.

    The Two Candle Shooting Star is a popular candlestick pattern in technical analysis often used by traders to identify potential trend reversals. This formation suggests a weakening of bullish momentum, indicating a potential shift toward a bearish trend. In this blog, we will discuss the Two-Candle ShootingStar pattern, its interpretation, advantages and limitations. Moreover, we will provide you with a real-world example of a stock that made this pattern to help you understand the trading setup better.

    What is the Two-Candle Shooting Star pattern?

    TheTwo CandleShooting Star pattern is used by traders to predict the potential bearish reversals in thepriceof an asset. Generally, this pattern appears at thetop of an uptrend and indicates a bearish reversal, signaling that buyers are losing momentum and sellers may be gaining control.

    Thepattern consists of two candles, which are explained below:

    • First Candle: The first candleis a bullish (or green) shooting candlestick indicating that buyers have pushed thepricehigher. This candle should ideally close near its high and reflect the strong buying pressure.
    • Second Candle: The second candle, however, is a bearish (or red) candlestick that opens abovethehigh of thefirst candlebut closes the significantly lower and usually near thehigh of the first candle. This creates a “shooting star” appearance as the second candlehas a long upper shadow and a small body.

    Interpretation of the Two-Candle Shooting Star Pattern

    The Two-Candles Shooting Star pattern is interpreted as a bearish reversal signal, especially when it appears after an uptrend. It suggests that thebullish momentum which was driving the prices higher may be fading, and sellers could soon takecontrol of themarket. Traders use this pattern to anticipate a price drop, making it a useful tool for timing exits from long positions or entering the short positions.

    In this pattern, thefirst candleis a bullish (green) shooting star candlestick representing thecontinuation of the upward trend. It shows that buyers werestill in control and pushing thepricehigher. However, the second candlechanges the narrative. This bearish (red) candleopens abovethefirst candle’s high and indicates an initial push from buyers. Yet the strong selling pressure causes the price to fall sharply by the time thecandlecloses. 

    Thelong upper wick of thesecond candleis a key element in interpreting thepattern. It reflects the market rejection of higher prices and indicates a potential shift in sentiment from bullish to bearish. The small body of thesecond candle compared to its long upper shadow emphasizes theweakening of bullish sentiment in themarket.

    How to Determine entry, Target and Stop-Loss?

    In theTwo-Candle Shooting Star pattern, determining thetarget and stop-loss (SL) levels are crucial for effective risk management and maximizing the potential profits. This pattern signals a bearish reversal, and the traders should aim to set their entry, target and SL points in alignment with theanticipated downtrend. An individual can use the below-mentioned trading setup:

    1. entry Point: Theentry point for a short position is generally set below the low of thesecond (bearish) candle. Oncetheprice breaks below this level, it confirms thepattern’s validity and suggests that selling pressure is increasing. Traders often wait for a bearish candle after the pattern and for the price to close below the low of the second bearish candle to reduce the risk of a falsesignal.

    2. Stop-Loss (SL): Thestop-loss is placed just abovethehigh of thesecond candle. Thereason for placing the stop-loss here is that thelong upper shadow indicates thepricelevel wheresellers overpowered buyers. If the price moves above the high of the bearish candle, it signals that the market sentiment is still bullish, and thus, the trade should be closed to avoid further losses.

    3. Target Levels: We can set the target levels using different approaches given below:

    • Previous Support Levels: Identify the nearest support or previous swing low from thepricechart. This acts as a target price as the price declines after thebearish reversal.
    • Fibonacci Retracement: UsetheFibonacci retracement tool and draw it from the low to the high of the pattern. Popular target levels include the 38.2% and 61.8% retracement levels.
    • Risk Reward Ratio: Traders often aim for a 1:2 or higher risk-reward ratio, which means the target is at least doubletherisk set by thestop-loss.

    Read Also: Best Options Trading Chart Patterns

    Example: Two-Candle Shooting Star Pattern of HDFC Bank

    Example: Two-Candle Shooting Star Pattern of HDFC Bank

    The above image shows the price chart of HDFC Bank Ltd. on a daily time frame. The above image shows a generаl uptrend оver thepast two months, with a significant increase in price from 1 November 2023 to 26 December 2023. The stock made a Two-Candle Shooting Star pattern on 28 December 2023. The bearish candle of the pattern had a low of INR 1,702. The stock price closed at INR 1,699 on 2 January 2024, below the low of the second bearish candle, which confirms the bearish reversal signal of the pattern. The stock price decreased significantly and made a low of INR 1,528 on 17 January 2024. 

    Advantages of Two-Candle Shooting Star Pattern

    TheTwo-CandleShooting Star pattern offers the several advantages for traders, particularly in identifying the potential bearish reversals after an uptrend. Some of the key benefits include:

    1. early Reversal Signal: This pattern provides an early indication that theuptrend may be losing strength. By identifying the pattern at the top of an uptrend, the traders can position themselves to profit from the upcoming price decline or exit long positions to preserve profits.

    2. Simple and Clear Formation: This pattern is easy to recognizeand consists of just two candles—a bullish candlefollowed by a bearish candlewith a long upper shadow. Its simplicity makes it useful for even new traders.

    Limitations to the Two-Candle Shooting Star Pattern

    While the Two CandleShooting Star pattern is useful for identifying the potential bearish reversals, it also has some limitations that traders should consider:

    1. FalseSignals: Thepattern can sometimes generate false signals, particularly in volatilemarkets and the price may continue to rise.

    2. Context Dependent: The effectiveness of the Two-Candle Shooting Star pattern depends heavily on the context in which it appears. If it forms in a weak or short-lived uptrend, thepattern may not lead to a significant pricereversal. Thepattern works best when it appears after a strong and sustained uptrend, which makes it less reliablein choppy or sideways markets.

    Read Also: Introduction to Bearish Candlesticks Patterns: Implications and Price Movement Prediction

    Conclusion

    The Two-CandleShooting Star pattern is a reliable bearish reversal signal, particularly after a strong uptrend. It provides traders a clear visual representation of market sentiment shifting from bullish to bearish. The pattern consists of two candlesticks, i.e., a bullish candle is followed by a bearish candle. The long upper shadow of the bearish candle suggests that the buyers have lost control of the market, and a downtrend may begin. Traders should confirm thepattern’s signal with other technical indicators and market conditions for improved accuracy. It is advised to consult a financial advisor before making any trading decision.

    Frequently Asked Questions (FAQs)

    1. What is the Two-CandleShooting Star pattern?

      The Two-CandleShooting Star pattern is a bearish reversal formation that appears after an uptrend. It consists of a bullish candlefollowed by a bearish candlewith a long upper shadow, which indicates a potential market reversal from bullish to bearish.

    2. How is theTwo-CandleShooting Star pattern used in trading?

      Traders use this pattern to identify the potential entry points for short positions or to exit long positions. It’s most effective when combined with other technical indicators for confirmation, such as moving averages or RSI.

    3. How do I set a stop-loss for theTwo CandleShooting Star pattern?

      Thestop-loss can be placed just abovethehigh of thesecond candle’s high. If thepricerises back above this level, it indicates that thepattern gave a false signal and the trade should be closed to limit losses.

    4. How can Traders usetheTwo Candles Shooting Star Pattern for tradedecisions?

      Traders can enter short positions when the price moves below the low of the bearish candle and book profits near the closest support level. A stop-loss can be placed just above the high of the bearish candle. 

    5. What arethekey conditions required for a valid Two-CandleShooting Star pattern?

      For a Two-CandleShooting Star pattern to be considered valid, thepattern should appear after an uptrend indicating thepossibility of a reversal. Moreover, thebearish candlemust have a small real body with a long upper wick. 

  • List of Government Bank Stocks/Share in India 2025

    List of Government Bank Stocks/Share in India 2025

    When the question of safety arises, everyone chooses to store their hard-earned money in a government bank. The banking sector of any nation is crucial in its economic development, and in 1969, the Indian government decided to nationalize fourteen private banks and assume control of their operations.

    In this blog, we’ll provide an overview of India’s leading government banks.

    Overview of Government Banks

    The foundation of the Indian economy is Public Sector Banks, commonly referred to as Government Banks. The Indian government owns a majority stake in these banks, which is why government officials monitor them closely. The main goals of these banks are to put the government’s economic policies into practice and work for the public welfare. 

    The Government of India realized the strategic importance of the banking sector and decided to enter the banking business in 1969. It started with the nationalization of the Imperial Bank of India, which was renamed the State Bank of India. The government further nationalized 14 banks in India to expand its market share in the banking industry. As of 2024, the public sector holds around 59% of the public deposits and operates 63% of ATMs across the country.

    List of Top 10 Government Banks Stocks in India based on Market Capitalization

    The list of top 10 Government Bank stocks are:

    S.No.Government Bank Stocks
    1State Bank of India
    2Bank of Baroda
    3Punjab National Bank
    4Indian Overseas Bank
    5Canara Bank
    6Union Bank of India
    7Indian Bank
    8UCO Bank
    9Bank of India
    10Bank of Maharashtra
    (Data as of 9 October 2024)

    Market Information of the Top 10 Government Bank Stocks 

    The market information of the top 10 government bank stocks is given below:

    CompanyMarket Capitalization (In INR crores)Share Prices (In INR)52 Week High Price (In INR)52-Week Low Price (In INR)
    State Bank of India7,11,292797912543
    Bank of Baroda1,27,267246300188
    Punjab National Bank1,19,46910414367.3
    Indian Overseas Bank1,03,77454.983.836.6
    Canara Bank94,69810412968.4
    Union Bank of India87,74811517291.2
    Indian Bank71,059528633391
    UCO Bank54,74645.870.734.7
    Bank of India47,98510515886.4
    Bank of Maharashtra38,79954.873.538.6
    (Data as of 9 October 2024)

    Read Also: Why Do We Pay Taxes to the Government?

    Best Government Banks in India Based on Market Capitalization – An Overview

    A brief overview of the best government banks in India is given below:

    1. State Bank of India

    SBI is the largest public sector bank in India and a titan of the nation’s banking sector, with the largest market share. SBI was founded more than 200 years ago, and its main office is in Mumbai.

    SBI’s history dates back to when the Bank of Calcutta, the first joint stock bank in British India, was established in 1806. Three separate presidential banks (the Bank of Bengal, the Bank of Bombay, and the Bank of Madras) were established in a short while in British India. The Imperial Bank of India was founded in 1921 after the three presidential banks merged. 

    In 1955, the Indian government nationalized the Imperial Bank of India and renamed it the State Bank of India. In 2017, the State Bank of Bikaner, State Bank of Jaipur, State Bank of Hyderabad, State Bank of Mysore, State Bank of Patiala, State Bank of Travancore, and Bhartiya Mahila Bank, the six affiliate banks of SBI, merged with the State Bank of India. As a result, the banks operated more efficiently, and it was clear how much SBI has contributed to the growth of financial services in rural areas. At present, SBI has a strong distribution network consisting of 22,405 branches and 65,627 ATMs. 

    1Y Return (%)3Y Return (%)5Y Return (%)
    -3.42%43.85%125.00%
     (As of 16 February 2025)

    2. Bank of Baroda

    The ruler of Baroda, Maharaja Sayajirao Gaekwad III, established the bank in 1908. He established the bank to promote the growth of the regional economy. Later, in 1969, the Indian government nationalized the bank and other commercial banks. The bank expanded its operations between 1970 and 1990. The bank opened branches in many cities across the US during this period, as well as in London, Dubai, Hong Kong, New York, and other places. Dena Bank and Vijaya Bank merged with Bank of Baroda in 2019, which led to its becoming the third-largest public sector bank in India, increasing its market share in terms of assets and customers. The organization is currently operating in more than 17 nations, with more than 11,000 ATMs and 8,243 branches. Apart from offering retail banking services, the bank extends wealth management services. The bank’s headquarters are in Vadodara, Gujarat.  

    1Y Return (%)3Y Return (%)5Y Return (%)
    -23.99%92.46%140.52%
     (As of 16 February 2025)

    3. Punjab National Bank

    In 1894, Lala Lajpat Rai, the Indian liberation hero, founded the bank in Lahore, Pakistan. It was the country’s first Swadeshi bank. After obtaining independence, the bank moved its headquarters to New Delhi. Later, in 1969, it was nationalized along with thirteen other banks. In 2003, it acquired Nedungadi Bank, and in 2020, it merged with the United Bank of India and Oriental Bank of Commerce. These mergers made it the second-largest sector bank in the country. The bank has a network of more than 10,000 branches and 13,000 ATMs across India and has operations in the UK, Hong Kong, and Dubai.

    1Y Return (%)3Y Return (%)5Y Return (%)
    -26.14%146.66%70.52%
     (As of 16 February 2025)

    4. Indian Overseas Bank

    This bank was founded in 1937 by Mr. Chidambaram Chettyar, who was a famous businessman and a former Indian banker. The bank’s objective was to establish overseas banking and FOREX services. Along with other banks, Indian Overseas Bank was also nationalized in 1969. In 2000, the bank was listed on the Indian stock exchange. The bank has branches in different countries like Singapore, Hong Kong, and Thailand. The bank’s headquarters is situated in Chennai, Tamil Nadu.

    1Y Return (%)3Y Return (%)5Y Return (%)
    -30.84%141.35%406.30%
     (As of 16 February 2025)

    5. Canara Bank

    Canara Bank was initially named as the Canara Hindu Permanent Fund when it was founded in 1906 by well-known philanthropist Ammembal Subba Rao Pai. The bank’s primary goal is to promote saving behaviors among its clientele. In 1910, the bank was renamed as Canara Bank. The Government of India nationalized the bank in 1969. Banks introduced digital banking systems in the early 1980s. The Government of India announced the merger of Syndicate Bank and Canara Bank in 2020, which made Canara Bank one of the country’s biggest banks in terms of branches and personnel. The bank also opened branches in other locations, including Hong Kong and London. The organization’s headquarters is in Bengaluru. 

    1Y Return (%)3Y Return (%)5Y Return (%)
    -24.77%82.02%136.78%
     (As of 16 February 2025)

    6. Union Bank of India

    The Union Bank of India has historical significance because it was founded in 1919 by an Indian businessman named Seth Sitaram Poddar, and its corporate office was inaugurated by Mahatma Gandhi. The bank’s initial clientele consisted of small enterprises and farmers. The bank and other well-known Indian banks were nationalized in 1969. The Corporation Bank and Andhra Bank were amalgamated into Union Bank of India in 2020 as a result of the government’s efforts to unify the Indian banking sector. In addition to its numerous offices in other nations like Hong Kong, Sydney, Dubai, and so on, the bank has over 8,400 branches throughout India. The bank’s main office is located in Mumbai.

    1Y Return (%)3Y Return (%)5Y Return (%)
    -22.27%153.63%129.19%
     (As of 16 February 2025)

    7. Indian Bank

    Indian bank was established in 1907 during the height of the Swadeshi Movement. A businessman named Mr Ramaswami Chettiar founded the bank to give Indian businessmen access to financial services. The Indian government nationalized Indian Bank in 1969, along with thirteen other banks. Following this, the bank rapidly expanded and has overseas branches in Singapore and Sri Lanka. The Indian government announced the merger of Allahabad Bank and Indian Bank in April 2020 to improve the bank’s operational efficiency. The bank is now concentrating on offering its clients digital banking options. The company’s main office is in Chennai, Tamil Nadu. 

    1Y Return (%)3Y Return (%)5Y Return (%)
    -3.53%243.55%498.53%
     (As of 16 February 2025)

    8. UCO Bank

    Ghyanshyam Das Birla, a well-known Indian industrialist, established the UCO Bank in 1943. The bank was previously known as United Commercial Bank. The bank became the first Indian bank to open a branch outside India and opened its first overseas branch in London in 1946. The bank was nationalized in 1969. In 1985, the bank rebranded itself as UCO Bank, and today, it operates over 3000 branches throughout India in addition to a few overseas branches. Its main office is located in Kolkata. 

    1Y Return (%)3Y Return (%)5Y Return (%)
    -33.87%211.51%176.41%
     (As of 16 February 2025)

    9. Bank of India

    The bank was founded in 1906 by a group of Mumbai businessmen and was held privately before being nationalized in 1969. Following the nationalization of the Bank of India in 1969, the corporation concentrated on growing and opening branches throughout India as well as abroad in places like New York, Tokyo, and London. The bank was crucial to the growth of the economy after it was liberalized in 1991. Bank of India is the founding member of the SWIFT (Society for Worldwide InterBank Financial Telecommunications). The bank’s headquarters is in Mumbai. 

    1Y Return (%)3Y Return (%)5Y Return (%)
    -27.44%90.05%57.49%
     (As of 16 February 2025)

    10. Bank of Maharashtra

    V.G. Kale and D.K. Sathe founded the bank in 1935 to offer banking services to the local population. By 1940, the bank had spread throughout the state of Maharashtra and offered banking services to the state’s small business owners and farmers. After being nationalized in 1969, the bank expanded operations throughout India. The bank also implemented several government initiatives, including the Pradhan Mantri Jan Dhan Yojana, to give the nation’s rural residents access to basic financial services. The bank’s headquarters is in  Pune, Maharashtra. 

    1Y Return (%)3Y Return (%)5Y Return (%)
    -20.98%148.59%296.10%
     (As of 16 February 2025)

    Read Also: How has Budget 2025 impacted Bank Nifty?

    Key Performance Indicators (KPIs)

    CompanyNet Profit Margin (%)ROE (%)Return of Asset (%)P/E (x) P/B (x)
    State Bank of India15.5117.310.9910.301.84
    Bank of Baroda15.5515.671.136.691.07
    Punjab National Bank7.638.920.5610.161.18
    Indian Overseas Bank11.0710.730.7536.854.18
    Canara Bank13.3718.400.996.051.03
    Union Bank of India13.6515.020.986.190.9
    Indian Bank14.6015.511.058.121.36
    UCO Bank7.566.900.5114.532.27
    Bank of India10.4510.300.716.960.76
    Bank of Maharashtra19.7822.091.328.642.11
    (All the above data is of the year ended March 2024) 

    Benefit of Investing in Government Bank Stocks

    There are various benefits of investing in Government bank stocks, a few of which are mentioned below-

    • Dividend Income – For investors looking for dividends, government bank stocks are a good investment option, as most of them provide dividends. 
    • Diversification Benefit – You can lower the risk in your portfolio by investing in government bank stocks, as they are backed by the government.
    • Economic Growth – Investing in public sector banks allows you to contribute to the nation’s long-term development.  

    Factors to be considered before Investing in Government Bank Stocks

    Factors to be considered before Investing in Government Bank Stocks

    Before making any investment in the government bank stocks, there are various factors to be taken into consideration-

    • Non-Performing Assets – Before investing in PSBs, one should analyze the bank’s profitability and NPA ratio.
    • RBI Policies – If someone is considering a short-term investment in PSBs, they should take the RBI’s monetary policies into consideration as they have the potential to affect the bank’s profitability. 
    • Company’s Financial – One should carefully review the company’s financial data, particularly its income statement and balance sheet, before investing in any government banking stock.  

    Future of Government Bank Sector in India

    India’s banking sector has a bright future since these banks are backed by the Government of India, which ensures that public deposits with these banks remain safe. Government banks hold the majority of public deposits, which makes them a major player in the Indian banking sector. They are subject to the guidelines established by the RBI. Given its role in the nation’s banking sector, government banks are seen as an essential component of the Indian economy.  

    Read Also: Top 10 Sectors in the Indian Stock Market

    Conclusion

    To sum up, government banks provide an attractive investment opportunity because their expansion will automatically translate into the expansion of the Indian economy. Even though they face challenges due to non-performing assets and fierce competition from private banks, government banks are doing remarkably well because of government assistance. If you’re interested in investing in these banks, be sure to talk to your investment advisor and take your risk tolerance into account. 


    Frequently Asked Questions (FAQs)

    1. Which Government Bank Stocks are the biggest in terms of market capitalization in India?

      State Bank of India, Bank of Baroda, Punjab National Bank, Indian Overseas Bank, and Canara Bank are India’s top 5 government bank stocks based on market capitalization. 

    2. How can I identify the best government bank stocks to invest in?

      An investor can analyze a bank’s financial statements, which include its non-performing assets, profit margin, etc., to determine which government banking is the best from an investment standpoint. 

    3. Is it worth investing in government bank stocks?

      Yes, one can invest in government bank stocks due to their bright growth prospects, but only after considering their risk tolerance. 

    4. Who is the current chairman of SBI?

      Mr Challa Sreenivasulu Setty is the chairman of SBI as of 9 October 2024.

    5. What are the major risks associated with investing in government bank stocks?

      RBI policies and non-performing assets are the main risks associated with government bank stocks.  


  • Reliance Power Case Study: Business Model, Financial Statements, And SWOT Analysis

    Reliance Power Case Study: Business Model, Financial Statements, And SWOT Analysis

    When summertime rolls around, all you have to do is turn on the air conditioner when you get home from work to enjoy the cool air. But have you ever wondered how electricity reaches your homes and which companies are involved in generation and distribution? Reliance Power is one such company that undertakes power projects in India and abroad.

    In this blog, we will provide an overview of Reliance Power, its business model, financial information and a SWOT analysis.

    Reliance Power Limited Overview

    Reliance Power Limited

    The company was first established in 1995 under the name Bawana Power Private Limited, a subsidiary of the Reliance Group, as a means of diversifying into the energy sector. Later, in 2006, when the Reliance Group split, Anil Ambani gained control of the company and renamed it Reliance Power Ltd. The corporation operates power projects both in India and abroad. They chose to raise more than INR 11,000 crore in 2008 to fund their continued expansion, and the offering was oversubscribed by the public, making it the largest initial public offering (IPO) in Indian history at that time. From 2009 to 2015, the corporation worked on several projects. The Sasan Ultra Mega Power Project, a 3,960 MW coal-based power project, was one of those projects. Following their early success, the company encountered several regulatory obstacles, which caused their financial situation to deteriorate and their debt load to rise over time. Since 2020, the company has been focusing on debt restructuring, and now it has shifted its focus to renewable energy. The organization’s headquarters is in Mumbai. 

    Business Model of Reliance Power Limited

    With a focus on energy infrastructure development, the company develops and operates several power projects throughout the nation. The following lists the specifics of the company’s business model:

    • Power Purchase Agreements – The business signs long-term contracts with central and state governments that last for 20 to 25 years, giving them a steady income stream. 
    • Subsidies – The government provides numerous incentives for this industry, so the company benefits from various subsidies and tax breaks. 
    • International Expansion – In an attempt to increase its market share and earnings, the company is exploring the potential of the global renewable energy sector. 

    The company provides end-to-end solutions for power development projects, which can be mentioned in the following steps-

    • Planning – The company identifies the location and sets up the power plant in areas with abundant natural resources.
    • Commissioning – After identifying the location, the company will get the project commissioned by the government and get the required license.
    • Construction of Plants – After obtaining permission from the government, the construction of the plant begins.
    • Operations – Finally, after the completion of the construction process, the company starts operations by managing fuel supplies and power transmission, as well as maintaining plant efficiencies.

    Source of Revenue of Reliance Power Limited

    The company receives revenue from various sources, which are mentioned below-

    • Power Generation – The company’s primary source of income is the distribution and sale of power. The business accomplished this through several PPA agreements with the government. 
    • Open Market Distribution – The business offers the surplus power produced by its operations for sale in the open market. 
    • Renewable Energy – Reliance Power receives credits for using different renewable energy sources, such as solar and wind. The company earns Renewable Energy Certificates (RECs), which are bought by other firms that are not eco-friendly, thereby increasing the revenues of Reliance Power.

    Product Portfolio of Reliance Power Limited

    The Reliance Power company has a diversified product portfolio-

    Energy Portfolio – The company has diversified electricity generation facilities capable of using different energy sources, such as:

    • Thermal Power – The company generates a major portion of its total power from coal-based power plants.
    • Renewable Energy – Reliance Power has significant investments in the renewable energy sector, such as solar and wind projects.
    • Hydro Electric Projects – The company is also involved in hydro-electric power generation projects.

    Market Details of Reliance Power Ltd.

    Current Market PriceINR 43.5
    Market Capitalization (In INR Crores)INR 17,518
    52 Week HighINR 54.2
    52 Week LowINR 15.5
    Book ValueINR 28.9
    Face Value of ShareINR 10
    P/E Ratio (x)-9.34
    (Above data as of 14 October 2024)

    Financial Statements of Reliance Power Limited

    Income Statement

    ParticularsFY 2024FY 2023FY 2022
    Sales7,8927,5427,503
    Total Income8,2607,8827,686
    Total Expenditure7,8375,6535,859
    Net Profit-2,242-361-565
    (The figures mentioned above are in INR crores unless mentioned otherwise)

    Balance Sheet

    ParticularsFY 2024FY 2023FY 2022
    Non-Current Assets39,01343,51244,002
    Current Assets4,7475,0245,810
    Total Shareholder Funds11,61411,59512,463
    Non-Current Liabilities14,25216,87418,502
    Current Liabilities17,89418,37417,225
    (The figures mentioned above are in INR crores unless mentioned otherwise)
    Balance sheet of Reliance Power Limited

    Cash Flow Statement

    ParticularsFY 2024FY 2023FY 2022
    Cash Flow from Operating Activities3,1734,0233,613
    Cash Flow from Investing Activities-192-354256
    Cash Flow from Financing Activities-2,734-3,623-3,848
    (The figures mentioned above are in INR crores unless mentioned otherwise)
    Cash Flow Statement of Reliance Power Limited

    Key Performance Indicators 

    ParticularsFY 2024FY 2023FY 2022
    Operating Profit Margin (%)5.8615.824.35
    Net Profit Margin (%)-26.20-5.34-7.41
    ROE (%)-17.80-4.05-4.86
    ROCE (%)1.793.955.60
    Current Ratio0.270.270.34
    Debt to Equity Ratio1.621.831.85

    Read Also: Reliance Industries Case Study: Marketing Strategy and SWOT Analysis

    SWOT Analysis of Reliance Power Limited

    Strength

    • Company’s Image – The Reliance Group of Companies, formed by Mr Dhirubhai Ambani, has built a global brand image for its products and services, which helps the company build trust among investors.
    • Long-Term Contracts – The company has long-term power purchase agreements with state and central governments, thereby providing a steady flow of income.
    • Renewable Energy Portfolio – Reliance Power utilizes several energy sources, such as solar, wind, hydro, etc. to generate electricity.

    Weakness

    • High Debt – The company’s high debt is a significant problem. 
    • Delay in Projects – The corporation is encountering regulatory obstacles that are causing delays in its projects. 
    • Losses – Reliance Power has struggled to be profitable in recent years, which makes it difficult for the business to address shareholder concerns. 

    Opportunities

    • Renewable Energy – With several incentive programs, the government is encouraging the usage of renewable energy sources, which may eventually help the enterprise. 
    • Growing Industry – India’s growing energy consumption offers the business a substantial possibility for expansion. 
    • Export Opportunities– In the long run, the company’s revenue may rise if it boosts its energy output and begins exporting power to other nations. 

    Threat

    • Financial Challenges – The company is not performing well in terms of financial performance; its debt levels are very high, and it has been incurring losses for the past few years.
    • Fuel Supply – Power prices are vulnerable to fluctuations in fuel prices, especially coal and gas. Any drastic price changes could adversely impact the margins of the company.
    • Shift Towards Renewable Energy – A shift towards renewable energy sources could impact the company’s performance in the short term.

    Read Also: Jio Financial Services: Business Model And SWOT Analysis

    Conclusion

    To sum up, Reliance Power is a prominent player in the Indian energy market, having inked multiple long-term contracts with the government to produce and supply electricity to various regions of the nation. However, because of its large debt load, which is also negatively impacting the company’s financial performance, it is also dealing with several other operational issues. Make sure you speak with your investment advisor before making any investments in this company. 

    S.NO.Check Out These Interesting Posts You Might Enjoy!
    1TCS Case Study: Business Model, Financial Statement, SWOT Analysis
    2Vedanta Case Study: Business Model, Financial Statement, SWOT Analysis
    3Nestle India Case Study: Business Model, Financial Statement, SWOT Analysis
    4BPCL Case Study: Business Model, Product Portfolio and SWOT Analysis
    5Apollo Hospitals Case Study : Business Model, Financial Statements, And SWOT Analysis

    Frequently Asked Questions (FAQs)

    1. Where is the headquarters of Reliance Power Limited?

      The headquarters of Reliance Power Limited is situated in Mumbai.

    2. Is Reliance Power a large-cap or mid-cap Company?

      Reliance Power Limited is classified as a mid-cap company with a market capitalization of INR 17,518 crores as of 14 October 2024. 

    3. Who is the CEO of Reliance Power Limited?

      Mr Raja Gopal Krotthapalli is the current CEO of Reliance Power Limited as of 14 October 2024.

    4. Is Reliance Power Ltd. a profitable company?

      No, Reliance Power Limited is not profitable as it has reported a net loss of INR 2,242 crores for FY 2024 and INR 361 crores in FY 2023.Q5. Who are Reliance Power Ltd.’s major competitors?Ans. The major competitors of Reliance Power are Adani Power Ltd., Tata Power Ltd., NTPC Ltd., and Power Grid Corporation Ltd.

  • Dragonfly Doji Pattern

    Dragonfly Doji Pattern

    Dragonfly Doji represents a situation where bearish momentum fades out, and bulls take control. It is one of the most common and simple candlestick patterns in technical analysis. The pattern is a good indicator of market reversals and can signal a price reversal in either a bullish or bearish direction. However, the pattern gives more accurate results if it appears after the end of a downtrend and indicates a bullish reversal.

    In this blog, we will discuss the Dragonfly Doji pattern, its interpretation, advantages and limitations. Furthermore, we will look at an example to understand the trading setup better.

    What is the Dragonfly Doji Pattern?

    The Dragonfly Doji is a type of chart pattern that consists of a single candlestick, characterized by a long lower wick with little or no upper shadow and a small to no real body. The real body is negligible as open and close prices of the candlestick are at or near the same level. The pattern signals a potential reversal in price direction. 

    The Dragonfly Doji pattern is a technical analysis candlestick chart that signals possible reversals in market direction. If the pattern appears after a downturn and near key support levels, it signals a bullish reversal, and if it appears after an uptrend, then it signals a potential bearish reversal. However, the pattern is more effective in predicting uptrends and is thus considered a bullish reversal pattern by many traders.

    Dragonfly Doji Pattern

    Characteristics of the Dragonfly Doji Pattern

    The characteristics of the Dragonfly Doji pattern are:

    • Formation: The pattern can occur after a downtrend or an uptrend. The pattern consists of only one candle as it has a long lower shadow, resembling the shape of a Dragonfly. 
    • Location: Generally found near key support levels at the bottom of a downtrend.   
    • Appearance: It looks like an English alphabet ‘T’ with a smaller body and a longer lower wick.
    • Psychology: The pattern has a long lower shadow, which means the sellers tried to push the price lower, but near the end of the trading session, the buyers pushed the price back up near the opening price, which indicates a potential shift in sentiment from bearish to bullish.
    • Risk Management: As the pattern appears after a downtrend, a confirmation is required. Using proper stop-loss and risk-management strategies is crucial for success in the financial markets.

    Trading Setup  

    Traders can use the below-mentioned setup to trade the Dragonfly Doji pattern:

    • Entry Point: The trader can enter the trade when the asset price gives a breakout above the high of the Doji candle, meaning the next candle should be a bullish candle. A trader should wait for a bullish candle and take confirmation from an increase in volume for a strong reversal signal.
    • Stop-Loss: A stop-loss should be placed below the lowest point of the Dragonfly Doji candlestick to have meaningful stop-loss and manage risk.
    • Target: The target can be determined as the nearest resistance level or Fibonacci levels, or a risk-to-reward ratio can be used to calculate targets.

    Read Also: Bullish Doji Star Pattern

    Example: Dragonfly Doji pattern of HDFC Bank Ltd.

    Dragonfly Doji pattern of HDFC Bank Ltd.

    The above image shows the daily price chart of HDFC Bank Ltd. The stock made a Dragonfly Doji pattern on 13 December 2023. The low of the candle was INR 1,615, and the high was INR 1,636. The price level of INR 1,609 was a major support level previously, which was broken on 5 December 2023, thus making it a support level for future price actions. On 14 December 2023, the stock closed at INR INR 1,650, i.e. above the high of the Dragonfly Doji pattern. We can also notice a sharp increase in volumes on the next day, thereby confirming the expected bullish movement. The low of the Dragonfly Doji candle will serve as a stop-loss, and the target could be the nearest resistance zone. The stock price moved upwards and made a high of INR 1,721 on 28 December 2023.

    Advantages of Dragonfly Doji Pattern

    The advantages of the Dragonfly Doji pattern are:

    • The pattern works in any market, such as equity, currency, commodity markets, etc.
    • The pattern works in any time frame, but its appearance in a bigger time frame means strong trend reversal is expected.
    • The pattern is a good reversal signal indicator.
    • It is an effective tool in identifying support levels.
    • It’s a very simple pattern to identify.
    • This pattern gives a complete setup for stop-loss and target.
    • The pattern allows effective risk management as it gives clear stop-loss levels.
    • This pattern gives quite accurate results if the breakout above the high of the Dragonfly Doji candlestick occurs with strong volumes.

    Limitations of Dragonfly Doji Pattern

    The limitations of the Dragonfly Doji pattern are:

    • The pattern cannot be used as a standalone indicator as it requires confirmation in the form of a bullish candle or an increase in volume.
    • The pattern is of limited use in a strong downtrend.
    • The pattern could give a false breakout, which can result in losses.
    • This pattern could be affected by various market factors like volatility, news, policy change, political instability or any other factor.

    Read Also: Long-Legged Doji Candlestick Pattern

    Conclusion

    Dragonfly Doji chart pattern is a powerful technical tool for investors and traders, though it requires confirmation as it occurs after a downtrend and indicates a potential change in trend. Generally, the Dragonfly Doji pattern works as a bullish reversal pattern if it appears after a downtrend and a bearish reversal pattern if it appears after an uptrend. However, the pattern generally signals a bullish reversal. It is characterized by a single candlestick with a long wick and a small or no real body, as at the end of the trading session, the price closes near open. It is important to understand the pattern’s characteristics, trade setup, risk management, and strategies before trading to make informed decisions and improve the chances of success in the markets.

    Frequently Asked Questions (FAQs)

    1. What Does the Dragonfly Doji pattern indicate?

      It suggests a potential reversal of the prevailing trend. If it appears after a downtrend, it suggests a potential bullish reversal; if it appears after an uptrend, it suggests a potential bearish reversal.

    2. What is the success rate of the Dragonfly Doji pattern?

      The success rate or accuracy of the Dragonfly Doji pattern depends upon the market conditions and time frames. In a short-term time frame, it generates a weak reversal signal if not confirmed by volume or any other indicators and in a longer time frame (weeks, months, or years), the success rate is higher once confirmed by volume and other studies.

    3. Can the Dragonfly Doji pattern fail?

      Like any other chart pattern, this pattern also can fail, particularly if the breakout above the high of the pattern candlestick is not supported by a bullish candle or increase in volumes or if market conditions and news are against the pattern.

    4. Is it easy to identify the Dragonfly Doji pattern?

      Yes, it’s easy to identify this pattern, and it is one of the simplest patterns to trade. 

    5. Does the position of the Dragonfly Doji in the chart matter?

      Yes, the location of the Dragonfly Doji pattern is important. If a Dragonfly Doji pattern appears after a downtrend near a key support level, it suggests a potential bullish reversal. If it appears after an uptrend near resistance, it may signal weakening upward momentum or a possible bearish reversal.

  • What Happened to Micromax? Rise, Fall, and Future Story!

    What Happened to Micromax? Rise, Fall, and Future Story!

    Micromax was once India’s largest smartphone brand as it experienced a rapid rise during the early 2010s by offering affordable feature packed smartphones to the mass market. Micromax was known for competing with global giants like Samsung. However, by the mid-2010s, Micromax faced a sharp decline. 

    The entry of Chinese smartphone manufacturers, rapid technological advancements and internal challenges disrupted its dominance. Once celebrated for its innovation and value driven offerings. Micromax struggled to maintain its market position, which resulted in one of the most dramatic rise and fall stories in the Indian technology industry. 

    In this blog, we will explore the rise and fall of Micromax, its achievements and the company’s future prospects.

    What Happened to Micromax_ Rise, Fall, and Future Story

    The Story of the Rise of Micromax

    Micromax was founded in 2000 as a software company operating in the field of embedded systems, before entering the mobile handset market in 2008. Micromax’s country of origin is India, and its rise began with the introduction of affordable and budget friendly smartphones that cater to the India’s price sensitive consumers. This strategy allowed it to compete with global giants, and by 2014, Micromax sales exceeded those of Samsung, and it became one of the lаrgest smartphone brands in the world.

    micromax logo

    You might be wondering, products of Micromax were manufactured in which country? Its phones were largely manufactured in China like many other companies in the industry, although it later emphasized local manufacturing under the “Make in India” initiative. However, the brand’s inability to innovate and adapt to changing market dynamics in the fast evolving electronics sector led to its fall.

    What Height Did Micromax Reach?

    At the height of its success between 2014 and 2015, Micromax became the second largest smartphone manufacturer in India and ranked among the top 10 global smartphone brands. Its success was due to affordable smartphones with competitive features that appealed to the Indian middle class. By 2014, it had captured nearly 17% of the Indian smartphone market and surpassed global giants like Samsung and Nokia.

    Micromax’s success wasn’t limited to smartphones. The company also ventured into other electronics such as televisions and tablets. Its focus on “Made in India” devices and localization with an understanding of the consumer preferences played a significant role in its rise. The brand was synonymous with value for money products with a wide range of models at different price points.

    However, its dominance was short-lived as Chinese smartphone manufacturers like Xiaomi, Oppo, and Vivo offered better smartphones at competitive prices and gradually eroded Micromax’s market share. By 2016, the company struggled to compete with the innovation and aggressive marketing strategies of its Chinese rivals.

    Other Products by Micromax

    Micromax, once a dominant player in the Indian smartphone market, launched several other electronic products to regain its market position, particularly in the consumer electronics sector. The company tried to adapt to changing consumer demands and expand its focus beyond smartphones. Notable innovations include:

    • One of Micromax’s significant innovations is the affordable smart TVs that served a growing demand for high-quality and feature-rich devices. These smart TVs offer Android-based interfaces, seamless streaming options, and an integration with popular apps. This made Micromax a major player in the Indian TV market back in 2016.
    • One of the most popular devices launched by the company was the Micromax Funbook. It was an affordable tablet as compared to its competitors.
    • Micromax also offered ovens, air conditioners, refrigerators and other smart wearables to its customer base in the past.

    What Happened to Micromax – Factors That Led to the Fall?

    Micromax was a dominant force in India’s smartphone market and witnessed a sharp decline after reaching its peak around 2014-2015. Several factors contributed to the fall of the company, which was once celebrated for offering affordable smartphones to a massive consumer base.

    • Competition from Chinese Brands: One of the most significant factors that led to Micromax’s decline was the entry of Chinese smartphone manufacturers like Xiaomi, Oppo, Vivo and Huawei. These brands flooded the Indian market with phones that offered superior features, advanced technology and sleek designs at competitive prices. 
    • Entry of Reliance Jio: Reliance launched Jio in 2016 and offered 4G services to its customers. Unfortunately, the entire smartphone lineup of Micromax didn’t support 4G, which made their huge inventory of 3G phones obsolete. Moreover, the company didn’t have enough financial resources to order a new batch of 4G mobile phones, as the Chinese manufacturers offered customizations only if the orders were large enough.
    • Lack of Innovation: Micromax’s initial success was driven by providing the budget friendly smartphones that most consumers demanded. However, the company failed to innovate and evolve in line with changing consumer expectations. 
    • Poor After Sales Service: Customer service is a critical aspect of sustaining brand loyalty. Micromax struggled to provide quality after sales support, which led to customer dissatisfaction. In contrast, Chinese brand’s focus on building stronger network to provide after sales services enhanced their reputation and trust among consumers.
    • Demonetization: The Government of India demonetized INR 500 and INR 1,000 notes in 2016, which had a severe impact on the sales of Micromax. The majority of the smartphones manufactured by Micromax were priced below INR 10,000. Most of its customers paid in cash and were not very familiar with online payments, which caused the revenues of the company to decline significantly.

    Many wonder, “Is Micromax dead?” Today, Micromax continues to exist, though its presence has diminished considerably. It still tries to rebuild by focusing on manufacturing smartphones and other electronics but faces stiff competition in a market dominated by global players. Whether it will rise again remains to be seen.

    Read Also: Top Power Companies in India

    Future Plans of Micromax

    Micromax has been struggling for quite some time and now aims to regain its position in the Indian market. The future plans of Micromax are:

    • Micromax has announced its plans to venture into the AI and Internet of Things (IoT) sector in 2024-25. The company plans to manufacture AI-integrated home appliances, such as smart air conditioners, smart lighting systems, etc., that can be controlled via mobile apps, offering customers convenience, energy efficiency and control through smartphones. 
    • Micromax placed a significant emphasis on “Make in India” by increasing its local manufacturing capacity. This strategic move not only supports the Indian government’s initiative but also reduces reliance on imports and enhances the profitability of Micromax. Localized manufacturing allows Micromax to offer competitive pricing, giving it an edge in the competitive electronics sector.

    Micromax’s diversification strategy can be seen as a positive signal in its turnaround story, and its focus on growth industries such as AI, IoT, and smart consumer devices can help it regain its dominant market position. 

    The Rise Again?

    The company, which had lost ground to Chinese manufacturers like Xiaomi, Oppo and Vivo, is ready to enter the Indian electronics market once again by capitalizing on the rising wave of nationalism and the “Made in India” sentiment. Amid the geopolitical tensions between India and China, Micromax has positioned itself as a local alternative and is ready to challenge the dominance of Chinese brands once again.

    In November 2020, The Micromax announced “IN” serіes of smartphones designed to offer solid features at competitive prices. The “IN” serіes was launched with the promise of delivering powerful hardware, stock Android and 4G capabilities, all the while keeping products affordable for Indian consumers. The company’s re-entry also saw significant investments in R&D, manufacturing with a pledge to bring in innovative products built for Indian needs.

    Read Also: Best Trading Apps in India

    Conclusion

    Micromax’s journey reflects both the rise and fall of a homegrown brand in India’s competitive smartphone market. After achieving significant success in the early 2010s, the company struggled to keep up with technological advancements and aggressive pricing of Chinese competitors. However, in 2020, the company made a comeback with the “IN” serіes to reclaim market share and take advantage of favorable local manufacturing policies and national sentiment. While challenges remain, Micromax’s strategic focus on budget smartphones could help it gain a foothold in the Indian consumer electronics industry. 

    Frequently Asked Questions (FAQs)

    1. What is Micromax known for?

      Micromax is primarily known for manufacturing affordable smartphones, tablets, and other electronic devices. 

    2. Who owns Micromax?

      Micromax is owned by its founders Rahul Sharma, Vikas Jain, Sumeet Kumar, and Rajesh Agarwal. Rahul Sharma is the most prominent face of the brand and serves as one of its key leaders.

    3. How much is Micromax worth?

      As of recent estimates, Micromax’s valuation is significantly lower than its peak in 2015 when it was worth approximately $3-5 billion. Its current worth depends on its business revival and market presence, which have seen a decline.

    4. Is Micromax profit or loss?

      Micromax has been struggling financially and operating at a loss for several years due to reduced market share and stiff competition. However, its recent efforts, like the “IN” series of smartphones and focus on local manufacturing, aim to improve profitability.

    5. Where can I purchase Micromax products?

      Micromax products can be purchased through e-commerce platforms such as Amazon, Flipkart, etc., as well as in physical retail stores across India. Check Micromax’s website for updates on new launches and authorized sellers. 

  • Upside Tasuki Gap Pattern

    Upside Tasuki Gap Pattern

    Do you want to know how traders accurately predict an upcoming bullish trend? Knowledge about bullish continuation patterns is essential to capture these movements. The Upside Tasuki Gap pattern is one such pattern. 

    The Upside Tasuki Gap is a bullish continuation candlestick pattern that signals the strength of an upward trend, and the gap denotes the price gap between two bullish candles. In this blog, we will discuss the Upside Tasuki Gap pattern, its interpretation, advantages, and limitations. We will understand the trading setup with the help of an example.

    What is the Upside Tasuki Gap pattern?

    The Tasuki Gap pattern is a candlestick pattern commonly used in technical analysis to identify the continuation of a price trend. It has two variations named Upside Tasuki Gap and Downside Tasuki Gap. The Upside Tasuki Gap is a candlestick pattern commonly used in technical analysis to identify the continuation of a bullish trend. Traders use this pattern to confirm the strength of a prevailing bullish trend and anticipate further upward momentum in the market.

    The Upside Tasuki gap candlestick pattern consists of three key candles. 

    • The first candle is a bullish (green) candle that signifies the prevailing bullish trend. 
    • The second candle opens higher than the close of the first candle and creates a gap. The stock price continues to move upward and helps in reinforcing the bullish momentum. 
    • The third candle is bearish (red), but it does not completely close the gap created between the first two bullish candles. 

    The Upside Tasuki Gap candlestick pattern means that the market sentiment is bullish, and the asset price will continue to increase. When a Upside Tasuki Gap candlestick pattern forms, it shows that the buyers are in control, even though the brief bearish move suggests a minor pullback. The pattern signals that the upward trend is likely to continue, providing the traders with a potential buying opportunity.

    Interpretation of Upside Tasuki Gap pattern

    The Upside Tasuki Gap is a bullish continuation pattern that traders use to confirm the strength of an ongoing uptrend. The Upside Tasuki gap candlestick pattern helps traders make informed decisions when identifying the potential entry points for long positions.

    The gap between the first two candles shows a sudden increase in buying interest, while the failure of the third candle to fill that gap indicates a brief pause or pullback rather than a reversal. 

    In practice, traders use the Upside Tasuki Gap candlestick pattern as confirmation to either hold their long positions or enter new trades in anticipation of further upward movement. It is especially useful in trend markets where continuation patterns lіke the Tasuki Gap are most effective. Overall, the Upside Tasuki Gap candlestick pattern signals an opportunity for traders to capitalize on bullish market conditions, reinforcing their belief in the ongoing trend. 

    How to Determine entry, Target and Stop-loss?

    When trading using the Upside Tasuki Gap candlestick pattern, it is essential to determine precise entry, target, and stop-loss (SL) levels to minimize risk and to maximize the potential profits. Understanding the below-mentioned trading setup can help traders strategically manage their positions.

    • entry Point: The Upside Tasuki Gap candlestick pattern provides a clear signal for traders to enter the market after confirming the bullish momentum. Typically, the ideal entry point is after the third candle (the bearish candle), i.e., when it fails to close the gap created between the first two bullish candles. This failure signals that the sellers are weak, and an uptrend is likely to continue. 
    • Stop-Loss (SL): A commonly used approach is setting the stop-loss slightly below the low of the third (bearish) candle or below the gap created between the first and second bullish candles. This ensures that if the price gives a breakdown and closes the gap, the trade is closed before further losses. 
    • Target: The target for the Upside Tasuki Gap candlestick pattern can be determined by using the technical indicators like Fibonacci extensions or by measuring the size of the gap between the first two bullish candles and projecting that upward. Traders can also aim for previous resistance levels or psychological price points (round numbers), which are often used as profit taking areas in uptrends.

    Example of Tasuki Gap candlestick pattern of Tata steel ltd.

    Example of Tasuki Gap candlestick pattern of Tata steel ltd.

    The above image shows the weekly price chart of Tata Steel Ltd., which is listed on the National Stock exchange (NSe) of India. Key observations are:

    • Uptrend: The stock increased from INR 102 on 20 March 2023 to INR 151.8 on 18 March 2024, suggesting a bullish sentiment among investors.
    • Upside Tasuki Gap: A significant gap appears on the chart between the two bullish candles, as shown in the highlighted circle. The first candle closes at INR 155.85, and the second candle opens at INR 156.80, indicating a gap of INR 0.95 between them. A bearish candle appears after the bullish candles and doesn’t close the gap between them, thereby completing the pattern. After the formation of the pattern, the price increased and reached a high of INR 183.15 on 10 June 2024.
    • Volume: The volume bars below the price chart show fluctuations in trading activity. Higher volume generally indicates increased interest and a high probability of price movement.

    Read Also: Downside Tasuki Gap Candlestick Pattern

    Advantages of Upside Tasuki Gap pattern

    The advantages of the Upside Tasuki Gap pattern are:

    1. Clear Continuation Signal: One of the main advantages of the Upside Tasuki Gap candlestick pattern is its ability to provide a clear continuation signal. It indicates that after a period of strong upward movement, the bulls remain in control of the mаrket and the trend is likely to continue. This allows traders to create long positions with confidence, knowing that the pattern supports the continuation of the upward momentum.

    2. easy Identification: The Upside Tasuki gap candlestick pattern is relatively easy to spot on a chart even for the novice traders. It consists of just three candles with the first two being bullish, separated by a gap, and the third being a small bearish candle that fails to close the gap. This simplicity makes it useful for new traders and enables quick decision-making without the need for complex analysis.

    Limitations of Upside Tasuki Gap pattern

    The limitations of the Upside Tasuki Gap pattern are:

    1. Works Best in Trending Markets: One of the major limitations of the Upside Tasuki Gap is that it is most effective in well-established uptrends. In sideways or choppy markets, this pattern may not provide reliable signals. In such market conditions, the pattern signal can generate false signals that can lead to losses. Traders must confirm the presence of a strong trend before relying on the pattern for decision-making.

    2. Limited Use in Predicting Reversals: The Upside Tasuki gap candlestick pattern is primarily a continuation pattern and does not signal trend reversals. Traders looking for signs of a market turning point may not benefit from this pattern as it only provides insight into the continuation of an existing bullish trend. This limits its utility for traders who focus on identifying the reversals or shifts in market direction.

    Read Also: Bullish Tasuki Line Pattern

    Conclusion

    The Upside Tasuki Gap is a bullish continuation candlestick pattern that helps the traders to confirm the strength of an ongoing uptrend. Its formation consists of two bullish candles followed by a small bearish one that fails to close the gap and signals that the market is likely to continue its upward momentum. While effective in trending markets, this pattern has limitations, including the risk of false signals in sideways markets and its dependence on other technical indicators for confirmation. Traders can use the Upside Tasuki Gap candlestick pattern to identify potential buying opportunities. 

    Frequently Asked Questions (FAQs)

    1. How is the Upside Tasuki Gap pattern used in trading?

      Traders use the Upside Tasuki Gap pattern to confirm the strength of an ongoing uptrend and create or hold long positions.

    2. How reliable is the Upside Tasuki Gap pattern?

      The Upside Tasuki Gap candlestick pattern is most reliable in strong and established uptrends. However, it can produce false signals in weaker or sideways markets.

    3. What are the limitations of the Upside Tasuki Gap pattern?

      The pattern’s limitations include its false signals in sideways markets and the need for confirmation from other indicators. It also doesn’t signal reversals, which limits its use to continuation trading strategies.

    4. Where should target levels be placed in the Upside Tasuki Gap pattern?

      Target levels can be set near the previous resistance areas, Fibonacci levels, or by measuring the gap size and projecting it upward from the third candle close.

    5. Where should stop-loss be placed in the Upside Tasuki Gap pattern?

      Traders can place the stop-loss below the third (bearish) candle or below the gap between the first two bullish candles.

  • Bearish Doji Star Pattern

    Bearish Doji Star Pattern

    Candlestick patterns in technical analysis provide important insights into market sentiment and possible price changes. Every trader wants to exit long positions and book profits before the bears arrive. The Bearish Doji Star is one such pattern that may indicate an impending bearish reversal. 

    In this blog, we will examine the Bearish Doji Star candlestick pattern, its key features, advantages and limitations. Moreover, we will look at an example to better understand the trading setup for this pattern.

    What is the Bearish Doji Star Pattern?

    The Bearish Doji star is a candlestick pattern used in technical analysis to signal a possible shift from bullish to bearish momentum. This candlestick pattern usually appears after a bullish trend, signaling that buyers may be losing control and sellers are gaining power. 

    The Bearish Doji Star pattern consists of two candlesticks:

    • The first candle is bullish and indicates that buyers are trying to push the market prices higher.
    • The second candle is a Doji candle, which indicates indecision in the market.

    A bearish candle, often a long red one, follows the Doji candle, confirming the bearish reversal signal. This bearish candle should close below the low of the Doji candle. The pattern interpretation is given below.

    • Interpretation: This pattern shows a change in market sentiment. A Doji candle after a bullish trend shows uncertainty, while a following bearish candle indicates aggressive selling. Traders view this pattern as a warning that upward momentum might be fading, signaling a possible downward trend.   

    How to Determine Entry, Target & Stop-Loss Levels?

    An individual can follow the below-mentioned trading setup to determine entry, target and stop-loss levels:

    • Entry: You can wait for a big bearish candle after the formation of the pattern and then create a short position in the market. 
    • Target: Traders can find swing lows or significant support zones on the chart and use them as target levels to book profits.
    • Stop-Loss: One of the most effective strategies is to place the stop-loss just above the high of the Doji candle. Since the Doji represents indecision and a possible reversal, the market is unlikely to climb above this level if the bearish reversal signal is genuine. 

    You should at least have a risk-to-reward ratio of 2:1, which means if the potential loss is, say, INR 500, then you should put your target up at INR 1000. So, even if half of the trades do not pay off, every winning trade will still be more than compensating for any losses.

    Read Also: Morning Doji Star Candlestick Pattern

    Example of Bearish Doji Star Pattern for Bank of India

    Example of Bearish Doji Star Pattern for Bank of India

    The image above shows the Bearish Doji Star pattern on the price chart of the Bank of India. We can see that the stock was in an uptrend, after which the stock price formed a Bearish Doji Star pattern. Furthermore, the pattern appears near a major support level of INR 310. After the confirmation from the big bearish candle after the pattern, traders can create a short position, and from the chart, it is clear that the sellers were in control, and the stock price made a low of INR 230 in the coming days.

    Advantages of the Bearish Doji Star Pattern

    The advantages of the Bearish Doji Star pattern are:

    • This pattern signals a possible shift from a bullish to a bearish trend. This allows traders to prepare for a downturn and make better trading decisions.
    • The Doji candle in this pattern indicates a state of indecision, followed by a bearish candle that confirms a definitive shift in momentum from buyers to sellers. This simplifies the understanding of changes in market sentiment.
    • The pattern is easy to spot on a chart, making it useful for both beginner and experienced traders.
    • The pattern works efficiently across different time frames, such as daily, weekly, and monthly. This makes it useful for short-term traders, swing traders and long-term investors.

    Limitations of the Bearish Doji Star Pattern

    The limitations of the Bearish Doji Star pattern are:

    • Bearish Doji Star pattern can generate false signals in sideways or choppy markets.
    • Traders must use a little bit of judgment when it comes to a Doji Candle. Determining a candle as Doji requires a little subjectivity to decide if the open and close prices are the same or not.
    • A Bearish Doji Star pattern can be followed by a minor pullback or consolidation instead of a quick bearish trend. Traders should carefully analyze the overall market landscape to prevent exiting short positions too early.
    • A Bearish Doji Star pattern may not lead to significant price movements in markets with low liquidity, making trading opportunities less appealing.

    Read Also: Bullish Doji Star Pattern

    Conclusion

    The Bearish Doji Star is an essential candlestick pattern for traders aiming to spot possible reversal from bullish to bearish. This indicates a change in the market sentiment, starting with a Doji candle that shows uncertainty, followed by a bearish confirmation candle that confirms the reversal. The main insight here is that the pattern suggests a potential waning of bullish momentum and the emergence of seller dominance. This presents a valuable opportunity to consider creating short positions or closing out long ones. It is advisable to consult a financial advisor before trading.


    Frequently Asked Questions (FAQs)

    1. When should I create a short position immediately after the Doji candle forms?

      One should wait for the bearish candle to close below the low of the Doji candle before creating a short position.

    2. Does the Bearish Doji Star pattern always give a strong trend reversal signal?

      The Bearish Doji Star pattern can fail like any other pattern, and it may signal a minor pullback in strong uptrends, so other indicators should be used to confirm the strength of the reversal signal.

    3. What timeframe is best for using the Bearish Doji Star pattern?

      The Bearish Doji star can appear in any timeframe but is more reliable in longer timeframes, such as daily or weekly charts.

    4. Should I use the Bearish Doji star alone?

      Combining the Bearish Doji Star pattern with other technical analysis tools, like support/resistance levels, RSI, MACD, or moving averages, is recommended for better accuracy.

    5. What is the difference between a Bearish Doji Star and a Shooting Star pattern?

      Both patterns have Doji candles with small bodies and long shadows, but the Doji candle in Shooting Star has a longer upper shadow than the Doji candle in the Bearish Doji Star pattern.

  • White Marubozu Pattern 

    White Marubozu Pattern 

    Do you want to know how to spot a bull run in the market or a particular stock before it happens? The White Marubozu candlestick pattern might just be the perfect solution. A WhiteMarubozu is a bullish candlestick pattern which is commonly observed in technical analysis of the stock charts. It has no shadows, indicating a strong buying pressure as the price steadily rises during the trading session. 

    In this blog, we will discuss the White Marubozu pattern, its interpretation, advantages and limitations. We will also discuss a real-world example to help you understand the trading setup better.

    What is the White Marubozu pattern?

    A White Marubozu is a powerful bullish candlestick pattern that signals the strong buying momentum in themarket. It is characterized by a long whiteor green candlestick with no upper or lower shadows, meaning the opening price is the lowest point of the session and theclosing priceis thehighest. This pattern occurs when buyers dominate the entire trading session and push prices higher consistently without any significant selling pressure.

    The White Marubozu candlestick pattern indicates bullish market sentiment, and it is often interpreted as a sign of a potential continuation of a bullish trend or a reversal of a prior downtrend. When this WhiteMarubozu candleappears after a downtrend, it will suggest a bullish reversal, whereas, in an uptrend, it confirms the strength of the bullish momentum.

    Interpretation of White Marubozu pattern

    The WhiteMarubozu candlestick pattern can be used to get a reliable bullish signal in technical analysis. The pattern is easily identified due to its distinct appearance: a long, whiteor green candlestick with no shadows. This pattern forms when buyers dominates thetrading session, leaving no room for sellers to push thepricelower.

    TheWhiteMarubozu candlestick pattern suggests that market sentiment is extremely bullish. It represents a strong surge in demand as the buyers control the ‘entire trading’ session. The absence of upper and lower wicks in theWhiteMarubozu candlestick implies that the price never dipped below the opening and is making new highs throughout the trading session, reinforcing thestrength of theuptrend.

    When theWhiteMarubozu candleappears after a downtrend and it can indicatea potential reversal as the buyers are now stepping in to drive prices higher. In such cases, it is viewed as a bullish reversal pattern and suggests that the prior bearish trend is losing momentum, and a new uptrend might be around the corner. 

    How to determine Target and Stop-Loss?

    Target and stop-loss (SL) are key components of a trading strategy. An individual can use the below-mentioned trading setup to effectively trade the White Marubozu pattern:

    1. Target: Thetarget priceis usually based on the length of the White Marubozu candle. An individual can determine the target by measuring the length of the White Marubozu candle and projecting this length upwards from the closing price. The greater the length of the candle translates into greater target levels. Moreover, you can use the nearest resistance levels, Fibonacci levels, etc., to determine the target.

    2. Stop-Loss (SL): The stop-loss for a WhiteMarubozu pattern should be placed slightly below the low of the candle. Setting thestop-loss a few points below the low of the candle helps protect against unexpected market reversals. 

    3. Risk-Reward Ratio: Traders often maintain a risk-reward ratio of 1:2 or 1:3 to remain consistently profitable. Traders generally combinetheWhite Marubozu pattern signal with other indicators (e.g. the support levels or moving averages) for better tradeconfirmation. 

    Read Also: Opening White Marubozu Pattern

    Example of White Marubozu Pattern for Tata Motors

    Example of White Marubozu Pattern for Tata Motors

    The above chart depicts the stock price performance of Tata Motors Ltd. on a daily time frame. Here, the stock was in an uptrend and on 29 January 2024, the stock made a White Marubozu candlestick pattern. The stock’s opening price and low of the candle were similar and approximately equal to INR 811, whereas the stock’s closing and high of the candle were approximately equal to INR 841. The length of the candle was around INR 29, which gives us a target price of INR 870 and a stop-loss level of INR 808. The target was achieved on the next trading day as the stock made a high of INR 885. 

    Advantages of the White Marubozu pattern

    The WhiteMarubozu candlestick pattern offers several advantages for investors and traders using technical analysis to predict market trends. 

    1. Clear Bullish Momentum: One of themain advantages of thewhitemarubozu candlestick pattern is that it clearly indicates the strong bullish momentum. The absence of upper and lower shadows in theWhiteMarubozu pattern shows that buyers werein control throughout the session and pushed theprice from opening to closing without any significant selling pressure. This makes this pattern reliable in identifying the bullish market sentiment.

    2. Trend Reversal Signal: The WhiteMarubozu candlestick is often used as an effective trend reversal signal, especially when it appears after a downtrend. It suggests that the bearish momentum is weakening and buyers are taking over, which makes it invaluable for traders looking to capitalize on potential trend reversals.

    Disadvantages of the White Marubozu pattern

    While the WhiteMarubozu candlestick pattern is widely used, it also has several disadvantages that traders should be aware of, some of which are listed below: 

    1. Lack of Context: Onekey disadvantageof theWhiteMarubozu candlestick pattern is that it doesn’t provide enough information about thebroader market context. While the WhiteMarubozu candle signals strong buying of the momentum, it doesn’t indicate how long this momentum will last.

    2. FalseSignals: In a sideways market or consolidation, the White Marubozu may generate false signals. The appearance of a Marubozu candle might seem to indicate a potential bullish trend, but other factors, such as negative economic events, volatility, etc, can cause prices to reversequickly after the White Marubozu pattern forms. 

    Read Also: Closing White Marubozu Pattern

    Conclusion

    TheWhiteMarubozu candlestick pattern generates a strong bullish signal that reflects powerful buying momentum, making it valuablefor identifying the potential trend reversals or confirming the ongoing uptrends. Its simplicity and reliability allow traders to easily recognize the market sentiment and use it effectively while making trading decisions. 

    However, relying solely on theWhіteMarubozu pattern can lead to losses as it sometimes can generate falsesignals, especially in volatile or sideways markets. Overall, the WhiteMarubozu pattern is reliable, but an individual requires a more comprehensive approach to increase the accuracy of trading decisions. 

    Frequently Asked Questions (FAQs)

    1. What is a WhiteMarubozu candlestick pattern?

      TheWhiteMarubozu candlestick pattern is characterized by a long whiteor green candlewith no upper or lower shadows, reflecting strong buying pressure throughout the trading period.

    2. What does a WhiteMarubozu candlesignify?

      A WhiteMarubozu candlesignifies strong bullish sentiment and suggests that the buyers had complete control during the trading session. It works as a bullish reversal pattern at the bottom of a downtrend or a continuation pattern in an uptrend.

    3. How is a WhiteMarubozu different from other candlestick patterns?

      WhiteMarubozu candlestick lacks shadows, which represents uninterrupted buying pressure, while other candlestick patterns that haveupper or lower wicks.

    4. How do traders usetheWhiteMarubozu pattern in their strategies?

      Traders may use theWhiteMarubozu to create long positions or add to the existing ones in anticipation of further price increases.

    5. Can theWhiteMarubozu pattern beused as a standaloneindicator for trading?

      WhiteMarubozu generates a strong bullish signal, but relying only on a single pattern for trading decisions can lead to losses due to falsesignals. For example, in overbought conditions or near resistancelevels, a WhiteMarubozu might not indicate the sustained bullish momentum. It is important to use other technical indicators along with the White Marubozu pattern for better accuracy.

  • Bullish Tasuki Line Pattern

    Bullish Tasuki Line Pattern

    The Bullish Tasuki Line pattern is a bullish reversal pattern that is valuable for traders trying to predict future uptrends. The pattern consists of two candles that indicate the weakening of the downtrend and expected bullish movement. Therefore, it is necessary to know how this particular pattern works so that traders can find just the right entry and exit points for trading.

    In this blog, we will explore the Bullish Tasuki Line pattern, its interpretation, advantages, and limitations. Moreover, we will discuss how to trade using this pattern with the help of an example.

    What is the Bullish Tasuki Line Pattern?

    The Bullish Tasuki line is a bullish reversal pattern that forms when the market momentum changes from a downtrend to an uptrend. It is a two-candle pattern, and it looks as explained below:

    • The First Candle: A bearish candle appears in a downtrend. This candle’s high is above the previous candle’s low, and its long body shows great selling pressure.
    • The Second Candle: It is a bullish candle that opens above or equal to the previous candle’s closing price and closes above the previous candle’s opening price. The candle has a long body, which shows that bulls are regaining control and driving the price higher.

    Bullish Tasuki Line Interpretation

    The Bullish Tasuki Line pattern indicates that even though there has been an established downtrend, the bulls are about to gain control of the markets. Even if the first candle is bearish, the second big bullish candle denotes that the selling pressure may be weakening, and the market will most probably move upwards. Some of the main points to be remembered are as follows:

    Key Features of the Bullish Tasuki Line

    • Reversal Signal: The pattern shows that the markets were in a downtrend, which would reverse shortly, and an uptrend would begin.
    • Volume Confirmation: A high trading volume accompanying the bullish candle usually validates the strength of the trend and confirms the reliability of the pattern.

    Read Also: Downside Tasuki Gap Candlestick Pattern

    How to Determine Target and Stop-Loss?

    For traders utilizing the Bullish Tasuki Line candlestick pattern, setting appropriate targets and stop-loss levels is important. Below is a guide on how to determine these key factors:

    • Entry Point: After the second candle closes above the high of the previous bearish candle, one usually places a buy order, anticipating the price will continue moving upwards.
    • Target Price: The target price can be determined using the nearest major resistance levels, Fibonacci levels, or as per risk-reward ratio.
    • Stop-Loss (SL): A stop-loss is usually placed below the low of the bullish candle to reduce losses in case the pattern gives a false breakout.

    Example of Bullish Tasuki Line Pattern for Reliance Industries

    Example of Bullish Tasuki Line Pattern for Reliance Industries

    The above image shows the daily chart of Reliance Industries Ltd., 

    • First Candle: A bearish candle in a downtrend closing at ₹2,226. The high of this candle is above the previous low price, which indicates the weakening of the selling pressure.
    • Second candle: A bullish candle opening at INR 2,240, which is slightly above the previous candle’s closing price of INR 2,226. This bullish candle closes at INR 2,265, i.e., higher than the high of the previous candle of INR 2,258.

    In this scenario, the closing price of the second candle above the high price of the first candle signals a bullish reversal.

    Trading Strategy Using This Pattern:

    • Entry: An individual can create a long position at INR 2,312 after the formation of another bullish candle after the pattern.
    • Stop Loss: A stop-loss can be set just below the low of the second bullish candle, that is, around ₹2,235, to manage the risk.
    • Target Price: A target price can be set at the nearest major resistance level, i.e. INR 2,485, which was achieved.

    The Bullish Tasuki Line signals the end of the bearish momentum and the beginning of a bullish reversal. A trader can look for additional confirmation from volume data and additional indicators before creating a long position.

    Bullish Tasuki Line Advantages 

    The Bullish Tasuki Line candlestick pattern is advantageous to traders in the following aspects:

    • Clear entry and exit points: You know exactly when to enter into the trade and at what point to exit the trade.
    • Reliable Signal: It is a reliable bullish reversal signal and can be used to predict an uptrend.
    • Risk Management: The Bullish Tasuki Line pattern provides stop-loss levels to protect against a possible bearish movement.
    • Simplicity: This pattern is easy to recognize and can be used by novice traders.

    Limitations of Bullish Tasuki Line 

    Though the Bullish Tasuki Line is a very important technical indicator, it has some limitations listed below:

    • False Signals: Like other technical indicators, it may provide false signals at times, particularly in highly volatile markets.
    • Needs Confirmation: Very often, the pattern needs to be confirmed with other technical indicators to avoid entering into a wrong trade.
    • Infrequent Occurrence: This pattern doesn’t occur frequently.
    • Non-reliable in Sideways Markets: It is reliable in trending markets and will probably not work well in sideways or choppy markets.

    Read Also: Upside Tasuki Gap Pattern

    Conclusion

    An extremely useful pattern at the end of a downtrend, the Bullish Tasuki Line candlestick pattern can give clear entry points and risk management strategies. Although it gives a very strong bullish signal, the trader needs to combine this with other technical tools to avoid false signals and to enhance trading decisions in various market conditions. It is advised to consult a financial advisor before trading.

    FAQs(Frequently Asked Questions)

    1. Is the Bullish Tasuki Line candlestick pattern reliable?

      Yes, it is reliable, especially when it forms after a downtrend. However, confirmation from other indicators can increase the reliability of the pattern.

    2. Can a Bullish Tasuki Line be applied to all time frames?

      It can be applied to any time frame but works best for higher time frames like daily charts.

    3. What’s a good additional indicator to use with the Bullish Tasuki Line?

      Most traders rely on moving averages or volume data to confirm the pattern’s validity.

    4. What should be the stop-loss for a Bullish Tasuki Line pattern?

      A stop-loss can be placed just below the low of the bullish candle to protect against false signals.

    5. How frequently does the Bullish Tasuki Line candlestick pattern appear?

      The pattern is rather rare because the conditions wherein it forms are somehow scarce.

  • Open Free Demat Account

    Join Pocketful Now

    You have successfully subscribed to the newsletter

    There was an error while trying to send your request. Please try again.

    Pocketful blog will use the information you provide on this form to be in touch with you and to provide updates and marketing.