Every investor looks to build a safety nest when investing. But when you are planning to invest in the stock market, you need a margin of safety as a protection net. Though it is a very simple concept, understanding this can make a whole lot of difference.
So, let us understand what is a margin of safety. Also, let us explore why you should be using this when investing in the stock market.
Exploring Margin of Safety Meaning
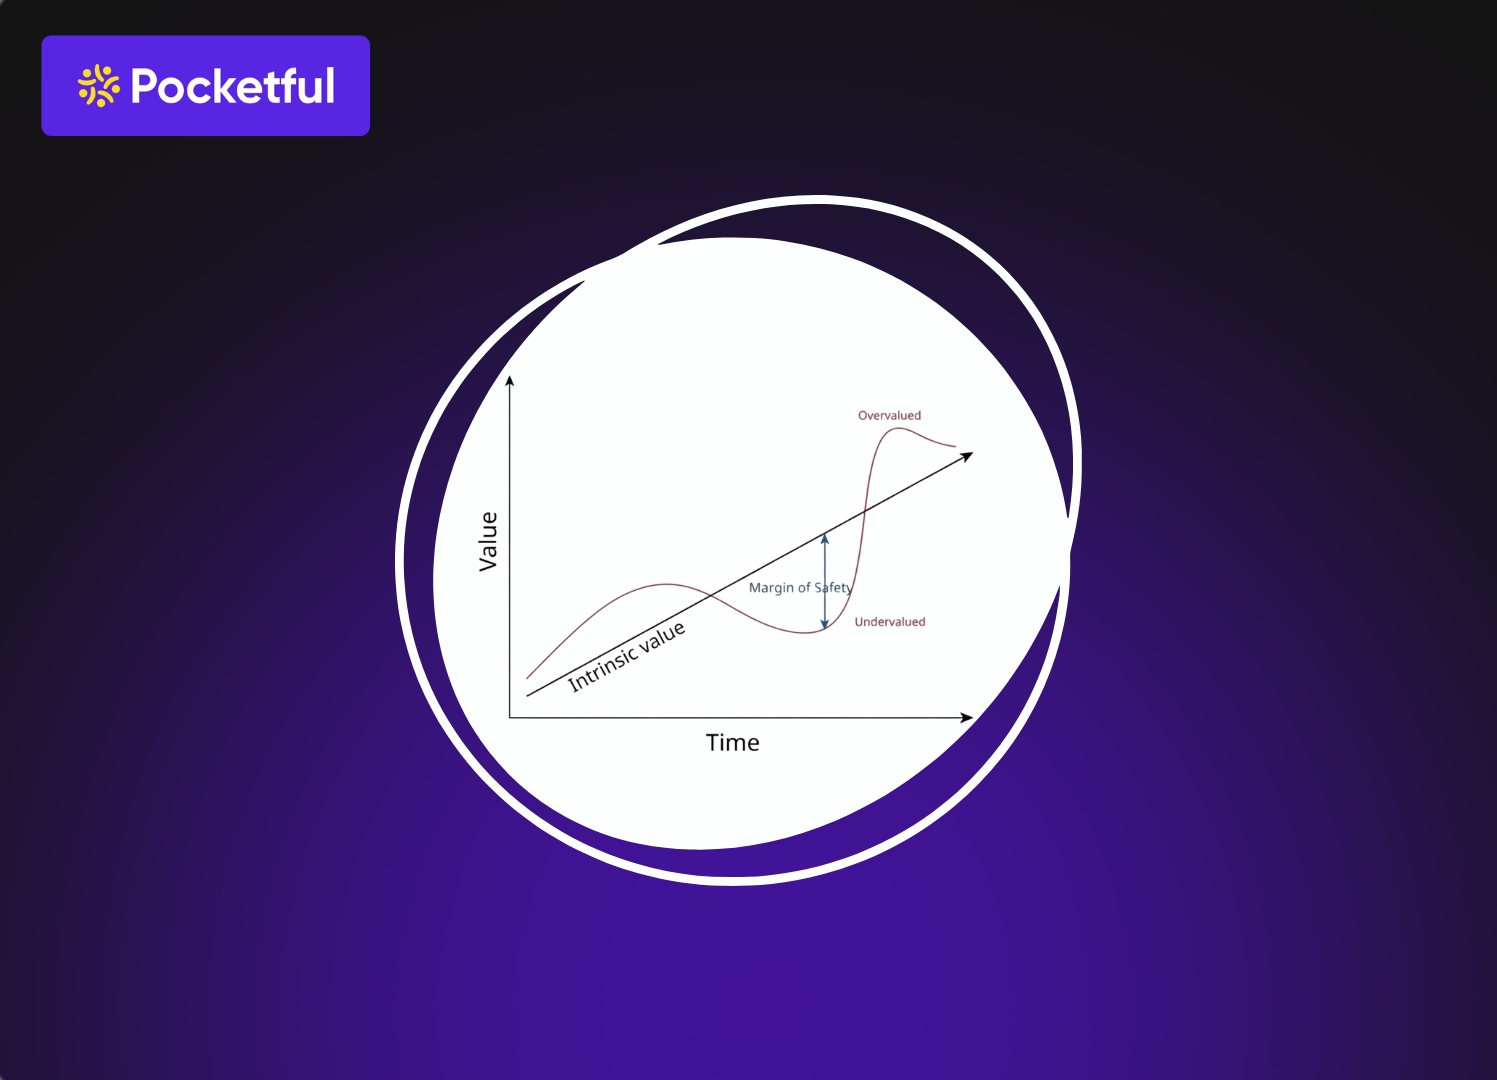
The margin of safety meaning is simple yet powerful while investing. It refers to the difference between the intrinsic value of a stock and its current market price. To understand this, you must first understand the two concepts as follows:
- Intrinsic value is what you believe a stock is truly worth. It is based on the financials, growth, and business fundamentals. It can be less or more than the actual value of the stock.
- The current market price is the price at which the stock is currently trading in the market. It shows the amount that buyers are willing to pay sellers to buy the stock.
To understand this, let us take a simple example here.
Consider a company X. The company’s true value is ₹500 per share. Its market value is ₹350.
Now, let’s calculate the margin of safety. Here, you would need to apply the following formula:
Margin of Safety = Intrinsic value – Actual value.
So, your margin of safety is ₹150, or 30%. This gap protects you against errors in your analysis and market downturns.
So, in simpler terms, the margin of safety is a protective buffer for your investment. It helps you avoid losses and ensures that your money is safe.
What is Margin of Safety in Accounting
Now, when you need to understand the margin of safety in terms of accounting, you need to first understand the concept of sales. According to this, the margin of safety is the point at which the company will see a fall in sales before it starts making losses. Simply put, it tells you how safe your current sales levels are.
The basic idea is to reach the break-even point. This is why it is used for break-even analysis and planning to measure the risk level. It gives you two outcomes for proper analysis, which include:
- A higher margin of safety means the company is performing well. There is confidence in management and safety.
- A lower margin of safety means the company needs to be cautious of its sales. The management needs to plan its actions again to avoid losses.
Read Also: What is Stock Margin?
How Margin of Safety Works
Understanding how the margin of safety works is very important. To understand this, here are the simple steps that you would need to follow:
Step 1: Find your break-even sales
Calculate the sales amount that you must attain. This will be the amount that will help you cover all your expenses. This is what your break-even sales point is.
Step 2: Check your actual or forecasted sales
Check what your current sales figures are. If you do not have this data, check what sales you are expecting in the coming period.
Step 3: Calculate the margin of safety amount
Now, you would need to find the margin of safety by using the formula below:
Margin of Safety = Actual Sales – Break-even Sales.
This will provide you with the value or buffer that you have in hand now.
Step 4: Convert it into a percentage (optional)
If you need the amount in the percentage format, you can also do that. For this, you would need to apply the formula given below:
(Margin of Safety / Actual Sales) × 100.
Step 5: Evaluate the result
Now you would need to evaluate the answers that you have received. So, here is the interpretation that you can get as follows:
- A higher percentage means there is a better buffer to handle the negative situations.
- A lower percentage means the company needs to work on its cushion for a better solution.
Using these steps regularly helps you know how secure your business is and plan confidently, even during uncertain times.
Advantages of Margin of Safety
The margin of safety comes with several benefits, whether you use it in investing or accounting.
- Reduces risk: It acts as a cushion. It helps you to protect yourself from losses if your calculations aren’t perfect.
- Boosts confidence: When you have a safety net, you will have better confidence. This will help you trade in a better manner.
- Handles uncertainties: Whether in sales or stock prices, market conditions change unexpectedly. Margin of safety ensures you’re better prepared for them.
Overall, it’s a practical way to invest or run a business with peace of mind and lower stress.
Read Also: What is SPAN & Exposure Margin?
Limitations of Margin of Safety
While the margin of safety is useful, it has its limitations, too.
- Accuracy matters: The result you get is based on your calculation. If there is any mistake in your calculation, there is a chance that your margin of safety value will be wrong.
- Too conservative: Staying cautious is great. But this should never mean that you avoid good opportunities. Hence, you must understand when and how much to invest. This will ensure you get reduced risks with good returns.
- Market realities differ: Not every time the value is correct. This is why you should understand that better analysis and proper evaluation are important.
Understanding these limitations helps you use this concept wisely without becoming overdependent on it.
Conclusion
The margin of safety isn’t just a financial formula. But it’s a mindset that encourages cautious and smart decision-making. It is not just linked to investing in stocks or managing a business, but it is a key part of your financial planning.
With proper planning and evaluation, you can not only increase the chances of your profit but also reduce losses. Also, when you are ready and prepared, you will not stay in fear of investing. This will help you make better decisions.
But one thing is important to remember here. Success is based on analysis and market understanding. While you can build this cushion, this planning is still important. This is where you must use Pocketful. This is a perfect platform that offers you complete guidance on investing.
Frequently Asked Questions (FAQs)
Does the margin of safety apply only to investing?
No, the margin of safety is used both in investing and business. In investing, it helps you buy stocks below their real value, while in business, it shows how much sales can drop before losses occur.
Can the margin of safety be negative?
Yes, a negative margin of safety means your actual or forecasted sales are below the break-even point. This indicates your business is already operating at a loss.
What is a good margin of safety percentage in business?
A higher percentage is always better, as it shows stronger financial stability. Businesses usually prefer at least a 20-30% margin to handle unexpected drops in sales comfortably.
Is the margin of safety always accurate?
Not always. Its accuracy depends on how well you calculate intrinsic value or break-even sales. Wrong estimations can affect the real safety it provides.
How does the margin of safety support decision-making?
It gives you a clear idea of your risk buffer. This helps you to make confident decisions in investing and business planning without the fear of sudden losses.