PhysicsWallah is an Indian EdTech company started by Alakh Pandey in 2016 with a YouTube channel. Over the years, it has grown into a unicorn startup by combining strong content, a student-first approach, and an innovative hybrid learning model. The company has thrived in a competitive market through its innovative business model and marketing strategies.
In this blog, we will understand its business model, marketing strategy, financials performance and SWOT analysis of PhysicsWallah Company in detail.
Company Overview & Journey
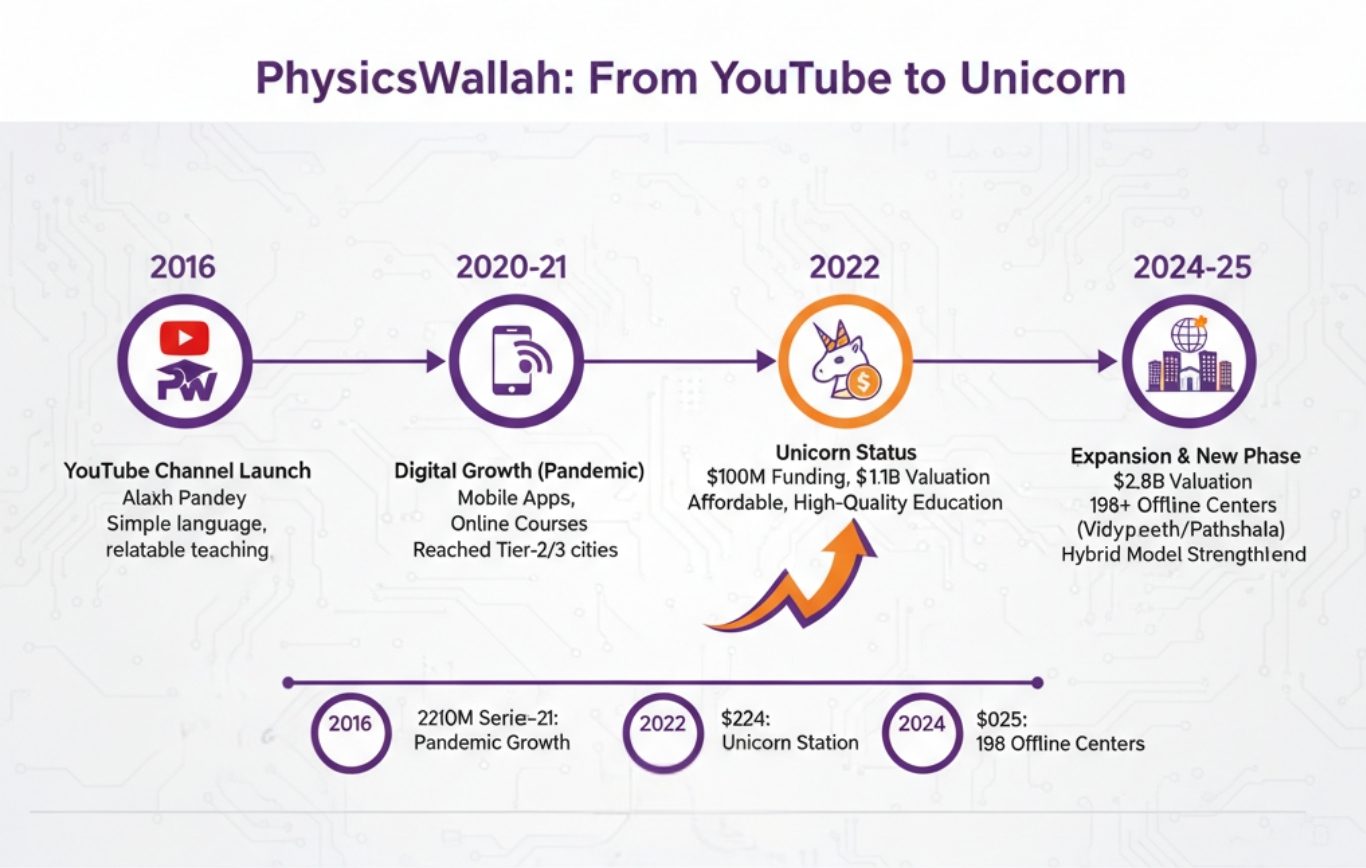
PhysicsWallah was founded in 2016 by Alakh Pandey on a YouTube channel. The simple language and relatable teaching style soon attracted millions of students. For students who did not have the option of expensive coaching, it became an affordable and reliable option.
1. Digital Growth (2020–21)
When traditional coaching was shut down during the pandemic, PW launched mobile apps and structured online courses. With comprehensive batches and doubt solving sessions at low prices. It quickly reached Tier-2 and Tier-3 cities and gained millions of paid users.
2. Journey to become a Unicorn (2022)
In 2022, PhysicsWallah raised $100 million in funding and joined the Unicorn Club with a $1.1 billion valuation.This milestone showcased the success of its sustainable, student-first approach, focusing on affordable, high-quality education and rapid growth
3. Expansion and new phase (2024–25)
In 2024, the company raised $210 million Series-B funding and the valuation rose to $2.8 billion. By January 2025, PW opened over 198 Vidyapeeth and Pathshala centers in 109 cities. These also include residential programmes for JEE and NEET, further strengthening the hybrid learning model.
Read Also: Zepto Case Study
Major achievements of PhysicsWallah
| Year | Achievement | Key Impact |
|---|---|---|
| 2016 | YouTube channel launched | Free and easy access to Physics education |
| 2020–21 | Pandemic growth | Expanded reach into Tier-2 and Tier-3 cities |
| 2022 | Unicorn status ($1.1B) | Secured major funding in the very first round |
| 2024 | $210M Series B | Valuation rose to $2.8B with accelerated expansion |
| 2025 | 198 Offline Centers | Made education more accessible through hybrid model |
Vision, Mission & Core Philosophy
Vision
PhysicsWallah’s main goal is to democratize education in India at a large scale, i.e. every child, irrespective of their city or pin code, can get high quality education at an extremely affordable rate. Additionally, PW wants every student to fulfill their dreams and reach their full potential, and the company becomes a “Lifelong Learning Partner”.
Mission
- To promote equity and inclusivity in education, so that no child is left behind due to lack of resources or economic status.
- To reach every corner of the country including Tier-2/3 cities and rural areas.
- To run the business in a way that is long-term and sustainable, not just a fast-growing but loss-making model.
Core Philosophy
- Student-first approach: PW always thinks about what students want, where they get stuck, what their needs are. By understanding their real pain points and simplifying learning instead of adding unnecessary expenses or technology budgets, PW builds trust.
- Affordability & Accessibility: The course material, live and recorded classes, offline-online hybrid model, everything is designed to benefit as many students as possible.
- Transparency & Credibility: PW wants to provide content and experience that is clear be it fees, courses, teaching, everything is clear. Students know what they are buying and what to expect.
PhysicsWallah Company Business Model
PhysicsWallah is an EdTech platform that has given a new dimension to affordable education in India. Its business model is based on a hybrid education system, where on one side there are millions of students (learners) and on the other side experienced teachers (educators) who teach both online and offline.
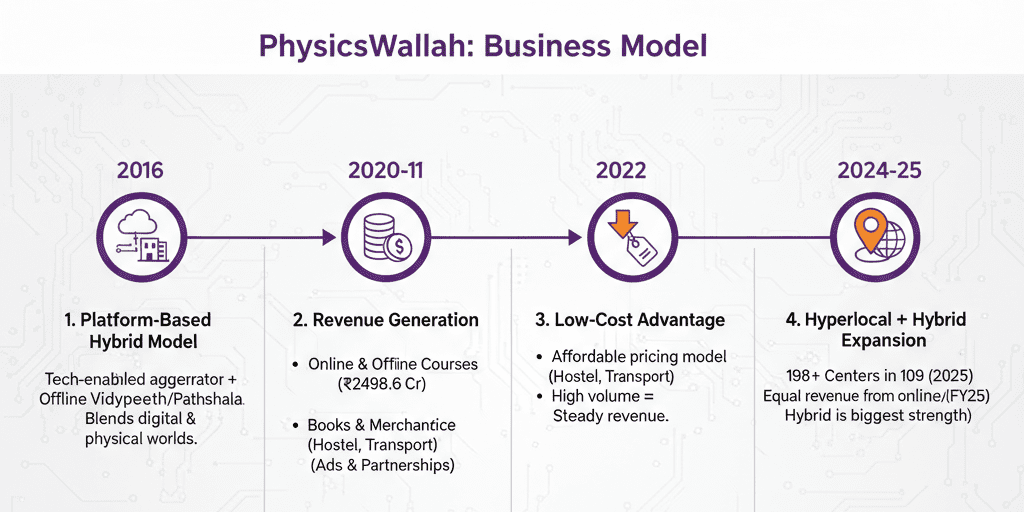
1. Platform-Based Hybrid Model
PW, despite being the owner of the coaching center itself, acts as a tech-enabled aggregator. Millions of students study on the online app and website, while teachers take classes directly in offline Vidyapeeth and Pathshala centers. In this way, the company has created a reliable model by combining both the digital and physical worlds.
2. Revenue Generation
PhysicsWallah has multiple sources of revenues:
- Online & Offline Courses : In FY25, ₹2,498.6 crore was earned from coaching services alone.
- Books & Merchandise Sales : Income of about ₹259.2 crores was generated by selling books, stationery and study material.
- Value-Added Services : Income is also generated from hostel, transport and content access.
- Ads & Partnerships : Additional income also comes from YouTube ads and small brand promotions.
3. Low-Cost Advantage
The biggest plus point of PW is its affordable pricing model. Where other EdTech companies charge thousands and lakhs of rupees, PW provides the same content at very low prices. Due to high volume, revenue remains steady.
4. Hyperlocal + Hybrid Expansion Strategy
In 2024–25, PW rapidly expanded its offline network. By March 2025, more than 198 centers have been opened in 109 cities. Almost equal revenue came from both online and offline channels in FY25, which makes it clear that the hybrid model is PW’s biggest strength.
PhysicsWallah’s Key Student & Platform Metrics
| Metric | Data |
|---|---|
| Offline Centres | 198 centres in 109 cities |
| Offline Revenue Contribution | About 45% of total revenue comes from offline operations. |
| Students | Around 10 million students have purchased paid courses, while approximately 36 million students learn through PhysicsWallah’s 80 YouTube channels, available in eight vernacular languages. |
| Languages Offered | Hindi, English, Telugu, Kannada, Bengali, Malayalam, Gujarati etc. |
Read Also: Blinkit Case Study
Marketing Strategy of PhysicsWallah Company

- Target Audience : PhysicsWallah’s main focus is on students in the age group of 14 to 22 years who are preparing for JEE, NEET and other competitive exams. Most of these students are from small cities and towns and find it difficult to access big coaching institutes. PW has created an affordable option for these students.
- Free Content & Freemium Approach : PW’s identity started with its YouTube channel. It provides free video lectures, doubt sessions and basic content. This strategy wins the trust of students and later leads them to premium batches, test series and personalised courses.
- Digital & Social Media Presence : PhysicsWallah uses social media smartly. Exam tips, motivational posts and success stories are shared on Instagram, Telegram and YouTube. This creates continuous engagement and motivates students to stay connected with the brand.
- Localized & Vernacular Strategy : PW has made content available in many Indian languages, not just English or Hindi. Along with this, the trust of students has been strengthened by opening offline centers like Pathshala and Vidyapeeth in small towns.
- Cost-Optimized Campaigns : Unlike big ad spenders like Byju’s and Unacademy, PW has relied more on targeted digital ads, SEO and student testimonials. The advantage of this is that the cost of acquiring new students (CAC) has been very low.
- Community Building & Word of Mouth : PW has built a strong student community on its platforms. WhatsApp and Telegram groups, doubt forums and peer learning deepen the engagement. When students share their success stories, it becomes the most effective way of word of mouth marketing.
Financials Metrics of PhysicsWallah
| Category | FY24 | FY25 | Change / Highlights |
|---|---|---|---|
| Revenue from Operations | ₹1,940.7 Cr | ₹2,886.6 Cr | 49% growth |
| Net Loss | ₹1,131.1 Cr | ₹243.3 Cr | Loss reduced by 78% |
| Online Revenue | ₹968 Cr | ₹1,404 Cr | Steady growth |
| Offline Revenue | ₹925 Cr | ₹1,351.9 Cr | Strong growth from hybrid model |
SWOT Analysis of PhysicsWallah Company
Strengths
- Affordable education model: The biggest plus point of PhysicsWallah is its low-cost course structure. This has made it easy to reach millions of students from tier-2 and tier-3 cities.
- Hybrid presence: Online classes as well as offline centers like Vidyapeeth and Pathshala have given the company a double strength.
- Strong student trust: Alakh Pandey’s identity and teaching style have created a loyal and trusted community among students.
Weaknesses
- Founder dependence: The brand identity is still largely based on Alakh Pandey, which increases dependency risk.
- Limited diversification: The company’s focus is mainly limited to test prep segments like JEE, NEET and UPSC.
- Thin margins: Profit margins are limited due to offering courses at very low prices.
- Scalability pressure in offline: Expanding offline rapidly increases expenses, which can make it difficult to maintain balance.
Opportunities
- Rising demand in smaller cities: The demand for affordable and quality education is constantly increasing in tier-2 and tier-3 cities of India.
- Global expansion: PW can take its model to emerging markets like South Asia and Africa.
- Diversification into new verticals: The company can expand into K-12 education, skilling and job-oriented courses.
- Tech adoption: PW can further strengthen its student experience by adopting AI-based learning and personalized education tools.
Threats
- Intense competition: There is tough competition from players like Byju’s, Unacademy and Vedantu.
- Operational costs of offline centres: Running offline centres on a large scale can prove to be expensive for PW.
- Regulatory challenges: Increasing government policies and regulations on the education sector can affect the company’s business model.
- Market saturation in test-prep: Segments like JEE and NEET are already very competitive, where there may be limits to growth.
Read Also: Ather Energy Case Study
Conclusion
PhysicsWallah’s story shows that with the right idea and perfect execution, education can truly be transformed. Starting from a small YouTube channel, this company has today become a trusted name for millions of students. FY25 figures show that its hybrid model is working and there are more possibilities open in the future. In the coming times, PW can give a new direction to the Indian EdTech sector by adopting diversification and technology.
| S.NO. | Check Out These Interesting Posts You Might Enjoy! |
|---|---|
| 1 | Zara Case Study |
| 2 | Reliance Power Case Study |
| 3 | McDonald’s Marketing Strategy – Case Study |
| 4 | Zepto Case Study |
| 5 | Meesho Case Study |
| 6 | Kalyan Jewellers Case Study |
| 7 | Urban Company Case Study |
| 8 | Rapido Case Study |
| 9 | Lenskart Case Study |
| 10 | Parle Case Study |
| 11 | Haldiram’s Case Study |
Frequently Asked Questions (FAQs)
What is PhysicsWallah Company known for?
It is famous among JEE-NEET students for its affordable courses and trusted teaching style.
How does PhysicsWallah earn revenue?
Revenue is earned through online-offline courses, books and test series.
Is PhysicsWallah profitable?
In FY25, PhysicsWallah’s total revenue from operations reached ₹2,886.6 Cr, with net loss shrinking to ₹243.3 crore. Coaching services drove revenue, while online and offline channels grew nearly equally.
How many students use PhysicsWallah?
Lakhs of students are connected to the app, YouTube and offline centers.
What makes PhysicsWallah different from its competitors?
PhysicsWallah differentiates itself by providing high-quality, affordable courses, making premium education accessible to students in small towns and tier-2 or tier-3 cities.