Most people are familiar with investing in stocks, but the world of finance offers many other options, such as mutual funds, commodities, ETFs, and derivatives. Among these, derivatives often remain a mystery for many investors and traders.
In simple terms, a derivative is a financial contract and its value is based on an underlying asset. This asset could be a stock, currency, commodity, interest rate, or even an index. Because of this link to other assets, derivatives are considered a powerful trading instrument.
But if you are planning to trade in derivatives, it is important to understand them properly. In this guide, we’ll take a closer look at derivatives and explain everything you need to know.
What are Derivatives?
Derivatives are financial instruments whose value is derived from another asset. This underlying asset can be a stock, bond, commodity, currency, interest rate, or even a market index.
To understand this, here is a simple example.
Suppose you believe the price of crude oil will rise in the next month. Instead of purchasing crude oil physically, you can invest in a derivative contract linked to crude oil prices. This way, you’re speculating on market trends and potentially profiting from the price movement without owning the actual commodity.
Derivatives allow investors to gain exposure to underlying assets at a lower upfront cost. Because of this, they are commonly used by both institutional and retail investors as part of advanced trading and hedging strategies.
Features of Derivatives
Derivatives offer various features that make them unique and profitable to use. These include:
1. Value Based on Underlying Asset
A derivative does not have value on its own. Its price is directly linked to the value of another asset. This makes derivatives dependent instruments. This means they fluctuate only when the price of the underlying asset changes.
2. Future Settlement Date
Derivatives are contracts that involve a future date for execution. When you enter a derivative trade, you agree on a price today, but the actual transaction happens later. This allows investors to speculate on future price movements or lock in prices in advance.
3. No Ownership of Asset
In derivative trading, you do not own the actual underlying asset. You are only agreeing to buy or sell it in the future or profit from its price changes. This makes it easier to access markets. Also, you do not need the full capital for the asset itself.
4. Leverage
Derivatives offer the advantage of leverage. This allows you to control large market positions with even smaller investments. This increases the potential for return, but the risk is also high. This is because even small movements can impact your position.
5. Risk Management and Hedging
This is one of the primary features of the derivatives. It helps you hedge against the potential losses by safeguarding your position. If you lock the prices today and then there is a fluctuation, the profits from the future price fluctuations stay safe.
6. High Market Liquidity
Many derivatives enjoy high liquidity. This means they can be easily bought or sold in the market. This allows the investors to enter or exit positions quickly without significant price impact.
Read Also: What is Derivative Trading? Types, Examples, Pros & Cons Explained
Types of Derivatives
Derivatives meaning in finance is simple. These are the financial tools that help you earn with hedging and speculation. Based on structure, here are the types to know.
1. Forward Contracts
A forward contract is a private agreement. It is drafted between two parties to buy or sell an asset at a fixed price on a specific future date. These contracts are customized. You can trade them over-the-counter only. These are not traded on formal exchanges. These types of contracts offer flexibility. But they do carry a higher risk due to the lack of regulation and standardization.
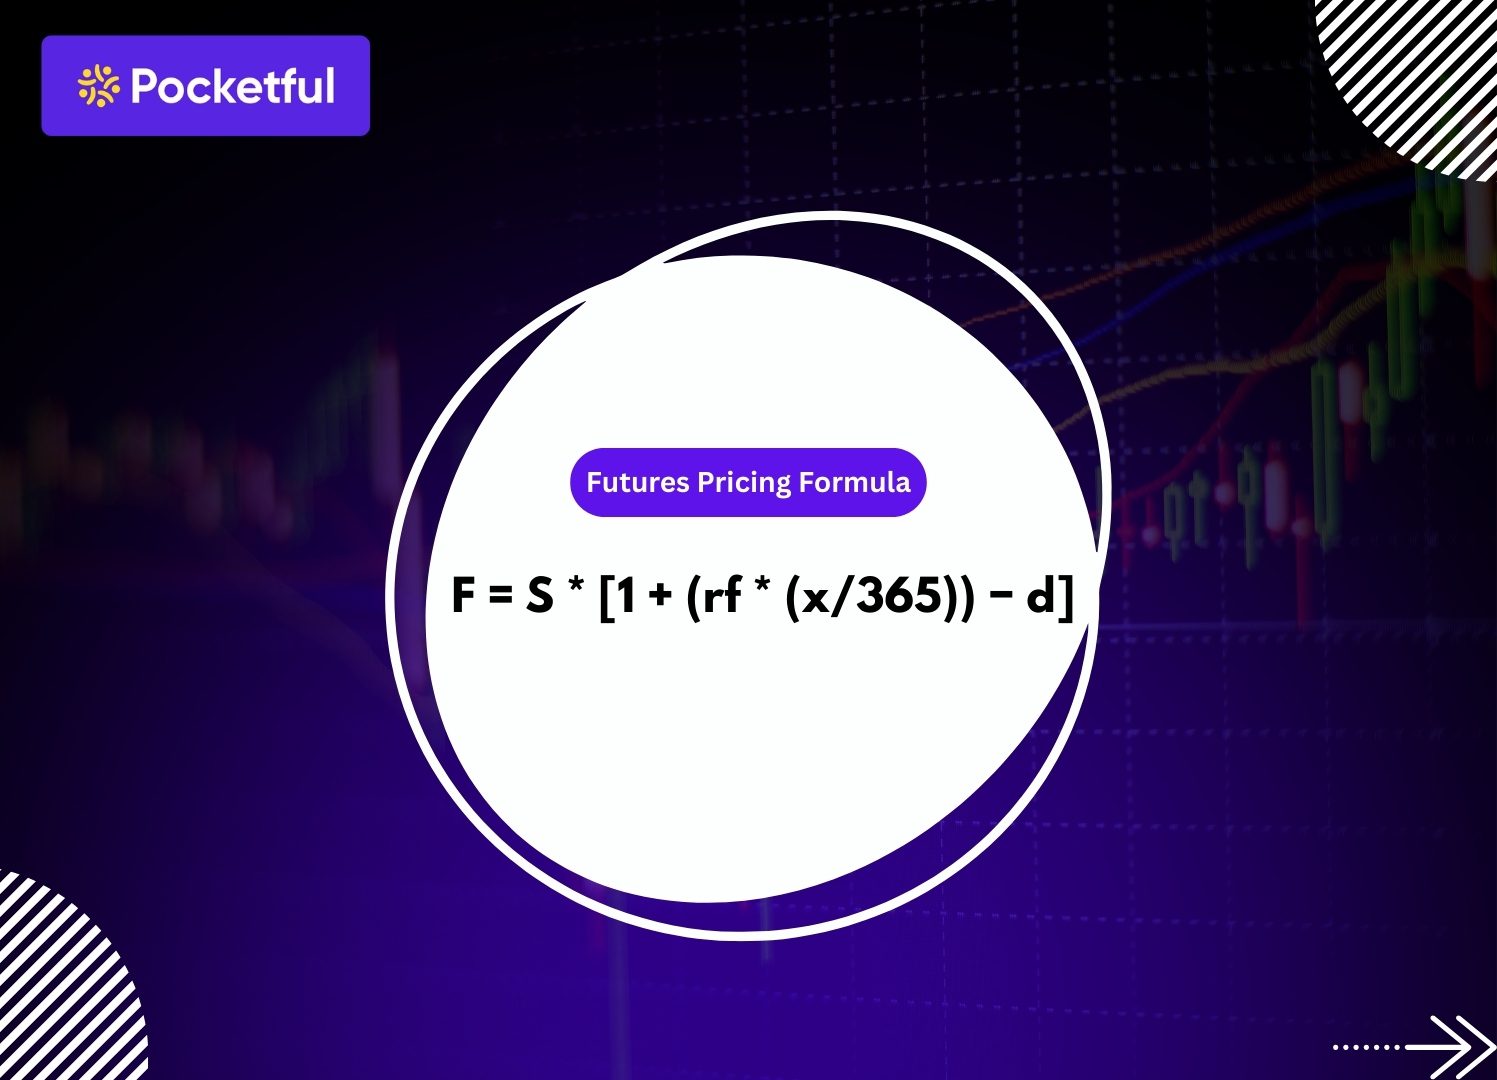
2. Futures Contracts
Futures are similar to forwards. The main difference is that these are standardized and traded on recognized exchanges. They involve an obligation to buy or sell. This means the underlying asset is traded at a predetermined price on a set future date. This makes them more transparent and less risky in nature.
3. Options Contracts
Options provide the holder with the right. In these, there is no obligation to perform the underlying act at a specific price within a defined time frame. There are two types of contracts here, which are:
- Call option – to buy
- Put option – to sell
These are widely used for hedging and speculative purposes. The options offer more flexibility than forwards or futures.
4. Swaps
Swaps are contracts. Under these, the two parties exchange financial obligations or cash flows. Common types include interest rate swaps and currency swaps. For instance, a company might swap a fixed interest rate for a floating one to better manage its loan repayments. Swaps are customized contracts and are typically used by institutions.
How to Trade Derivatives
Getting started with derivatives involves a few key steps. While the instruments might sound complicated to you, investing in them is not. So here are the steps to follow:
1. Open a Trading and Demat Account
Choose a SEBI-registered broker that offers derivatives. You’ll need both a trading and a Demat account to begin.
2. Complete KYC and Enable Derivatives Segment
Submit your KYC documents and request activation for the derivatives segment. Some brokers may assess your income or experience before approval.
3. Understand Margin Requirements
Derivatives need only a margin payment, which is a fraction of the full contract value. Check the margin terms with your broker before placing trades.
4. Select Your Contract
Pick a futures or options contract based on the asset you want to trade. It can be stocks, indices, or commodities. Once done, choose your expiry.
5. Place and Monitor Your Trade
Use your broker’s platform to place buy or sell orders. Keep track of your position and exit before expiry, or let it settle automatically.
Read Also: Index Derivatives in India
Pros and Cons of Derivatives
Derivatives are a great option, but these do have their own pros and cons. Knowing them will help you make the right investment decision without delay. So, here are the ones to know:
Pros of Derivatives
1. Risk Management
Every investor looks for an option that can reduce risk. This is where derivatives are great. They help with hedging and help manage risks better. This is mainly because of the flexible nature.
2. Leverage
You can take large positions with a smaller amount of capital, thanks to margin trading. This makes derivatives cost-effective. This is impactful for traders seeking higher exposure.
3. Portfolio Diversification
Derivatives allow you to gain access to assets or markets. These are the ones that might be difficult to invest in directly. These help you spread your investment risks.
4. Price Discovery
The prices are based on the future value expectations. This helps in finding the fair market value as well. This improves transparency and helps in determining fair market value.
Cons of Derivatives
1. High Risk
Even small price movements can impact your profit and losses greatly. This means the leverage that offers benefits can be risky, too. Hence, managing it accurately is very crucial.
2. Complexity
Derivatives are not beginner-friendly. These come with complex terms and a pricing mechanism. This is why you would need better strategies to invest in them. Hence, if market understanding is lacking, your investment will be impacted.
3. Time-Bound Contracts
Most derivatives have an expiry date. If the market doesn’t move in your favor within that time, you may lose your entire investment.
4. Counterparty Risk
In over-the-counter derivatives like forwards or swaps, there’s always a chance the other party may default on their agreement, especially in volatile market conditions.
Read Also: What is Swaps Derivatives?
Conclusion
For many investors, derivatives may seem complex and intimidating. Their very nature often creates uncertainty. However, with the right knowledge, careful evaluation, and proper strategy, derivatives can be a valuable way to generate positive returns.
At the same time, it is essential to align every trade with your financial goals. Doing so ensures that your investments serve a clear purpose and work toward the results you seek. So, are you ready to explore derivative trading with the right platform and advanced technical features?
Start your journey on Pocketful, a platform designed to make trading smarter, simpler, and more accessible.
| S.NO. | Check Out These Interesting Posts You Might Enjoy! |
|---|---|
| 1 | What Is the National Commodity and Derivatives Exchange (NCDEX)? |
| 2 | MCX Trading: What is it? MCX Meaning, Features & More |
| 3 | Top Tips for Successful Margin Trading in India |
| 4 | What is Commodity Market in India? |
| 5 | What is Intraday Trading? |
Frequently Asked Questions (FAQs)
What makes derivatives riskier than regular stocks?
Derivatives are time-bound and often involve leverage. Even small price changes can cause large losses, unlike stocks, which you can hold indefinitely. Timing and margin requirements make them more volatile and complex.
Can I trade derivatives without prior experience?
Technically, yes, but it’s not advised. Derivatives require a deeper understanding of markets, pricing, and risk. Beginners should first learn through demo accounts or low-risk strategies. Once done, you can go ahead with the real money.
Are derivatives only for short-term trading?
Mostly yes. Since they come with expiry dates, derivatives are best suited for short- to medium-term strategies. Long-term investors typically prefer cash market instruments like stocks or mutual funds.
How do I know if I’m eligible for derivative trading?
You must complete full KYC and request activation of the derivatives segment with your broker. Some platforms may also check your income, trading experience, or risk profile before enabling access.
Can derivatives be used during volatile markets?
Yes, and that’s where they shine. Derivatives are often used during volatility to hedge risks or take advantage of sharp price movements. However, higher volatility also increases the chances of loss if not managed carefully.