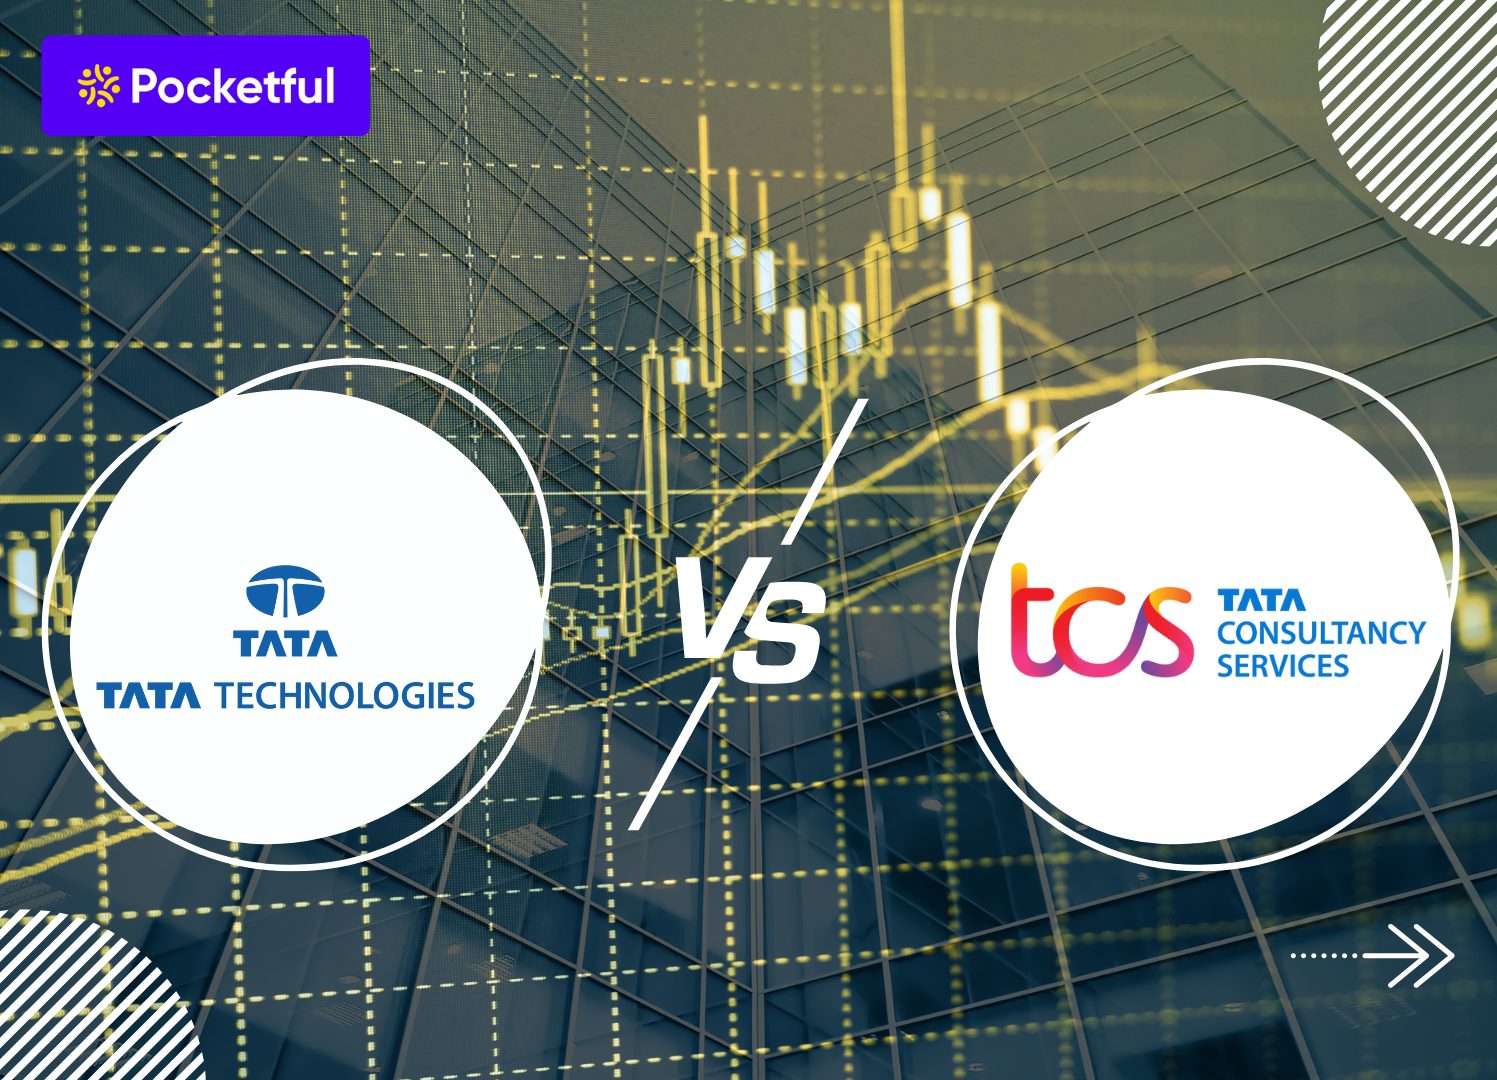
Tata Technologies and TCS are both IT companies under the Tata Group, but their business focus is quite different. On one hand, there is TCS, one of the largest IT companies in the world, offering custom IT solutions to its clients. On the other hand, Tata Technologies is a key player in the field of manufacturing and engineering innovative solutions through extensive R&D.
In this blog, we will discuss how these two companies are different, what their business model is, and their future business plans. If you want to understand what these companies do in detail, then this blog is for you.
Company Overview: Tata Technologies
Tata Technologies was established in 1989 as an engineering division of Tata Motors. Later, in 1994, it started operating as an independent company. Headquartered in Pune (Maharashtra), today the company is known for its presence worldwide, including the US, Europe, China, Japan, Singapore and South-East Asia.
The company’s main focus is on engineering and product development services, especially for the automobile, aerospace, and industrial machinery sectors. Tata Technologies’ mission is – “Engineering a better world” i.e. creating a better world through technology.
Today, the company has more than 12,000 employees globally and is led by Warren Harris, who has been associated with Tata Technologies since 2005. Tata Technologies is considered a leading company providing innovation-driven solutions due to in-depth R&D, furthering the legacy of the Tata Group in shaping the future of various industries.
Business Model – Tata Technologies
Tata Technologies’ business model is divided into two major parts:
- Engineering Services : The company provides services such as design, product development, virtual simulation and embedded systems. Its main focus is on the automotive and manufacturing industry.
- Technology Solutions : The company works on digital technology, product lifecycle management (PLM) software, smart factory solutions and EV technology platforms. Its key digital tools include in-house developed platforms such as eVMP, TRACE and FactoryMagix.
Tata Technologies helps clients get to market faster by providing end-to-end engineering and digital innovation solutions.
Read Also: Tata Technologies Case Study
Company Overview: TCS
TCS i.e. Tata Consultancy Services was founded in 1968, and today it is considered one of the largest IT service companies not only in India but in the world. It is one of the most valuable companies of the Tata Group, headquartered in Mumbai. TCS started as a simple data processing unit, but over time it has become a leader in providing services like digital transformation, cloud computing, artificial intelligence and consulting. The company is today led by CEO K. Krithivasan, who assumed the role in 2023. TCS has a client base spread across more than 50 countries, and its offices are located in US, Europe and Asia. The company serves almost every major sector such as banking, finance (BFSI), healthcare, retail, telecom and energy.
Business Model – TCS
TCS’ business model is entirely based on IT services and digital solutions:
- Core Services : The company offers services such as application development, IT consulting, infrastructure services, and cloud migration.
- Digital & Innovation : TCS’ focus on innovation in AI, data analytics, cybersecurity, and IoT keeps it at the forefront of technological changes.
- Long-Term Engagements : The company’s revenue model is mostly based on long-term projects and managed services contracts.
TCS enables end-to-end digital transformation for its global clients, making it a trusted technology partner.
Read Also: TCS Case Study
Comparative Analysis: Tata Technologies Vs Tcs
| Particulars | Tata Technologies | TCS |
|---|---|---|
| Current Price (₹) | 700 | 3,439 |
| Market Cap (₹ Crores) | 28,413 | 12,44,206 |
| 52-W High (₹) | 1,136 | 4,592 |
| 52-W Low (₹) | 595 | 3,056 |
| FII Holdings as of March 2025 | 3.10% | 12.04% |
| DII Holdings (as of March 2025) | 2.48% | 11.56% |
| Book Value (₹) | 88.2 | 262 |
| PE Ratio | 41.9 | 25.6 |
Financial Statements Analysis
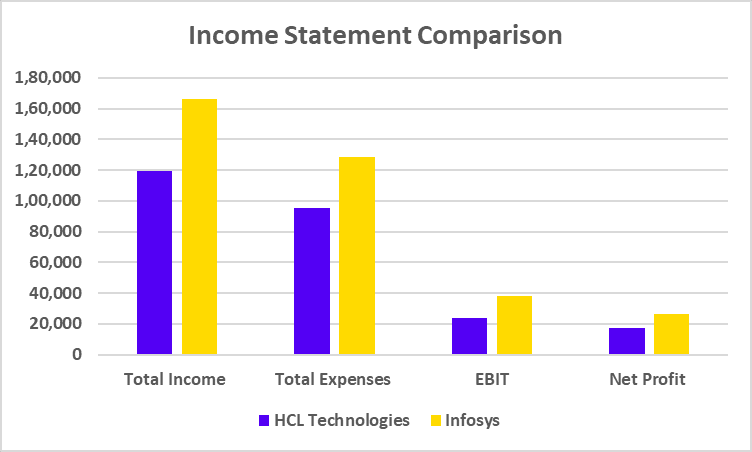
Income Statement Comparison
| Particulars | Tata Technologies | TCS |
|---|---|---|
| Total Income | 5,292 | 2,59,286 |
| Total Expenses | 4,355 | 1,93,159 |
| EBIT | 936 | 66,127 |
| Net Profit | 672 | 48,797 |
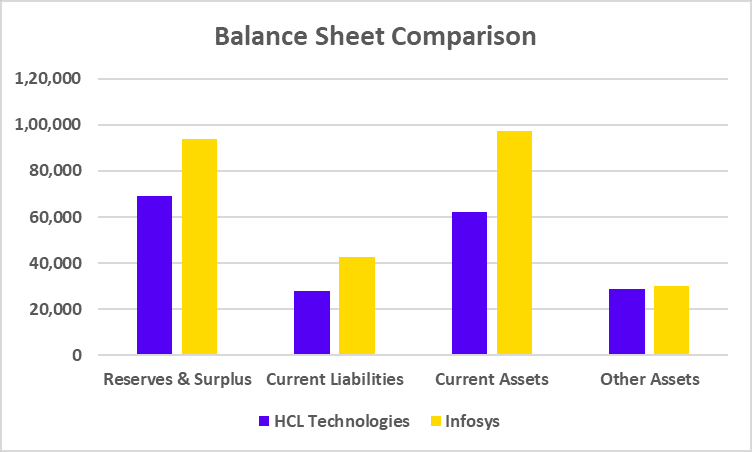
Balance Sheet Comparison
| Particulars | Tata Technologies | TCS |
|---|---|---|
| Reserves & Surplus | 3,498 | 94,394 |
| Current Liabilities | 2,683 | 53,001 |
| Current Assets | 4,672 | 1,23,012 |
| Other Assets | 1,679 | 13,878 |
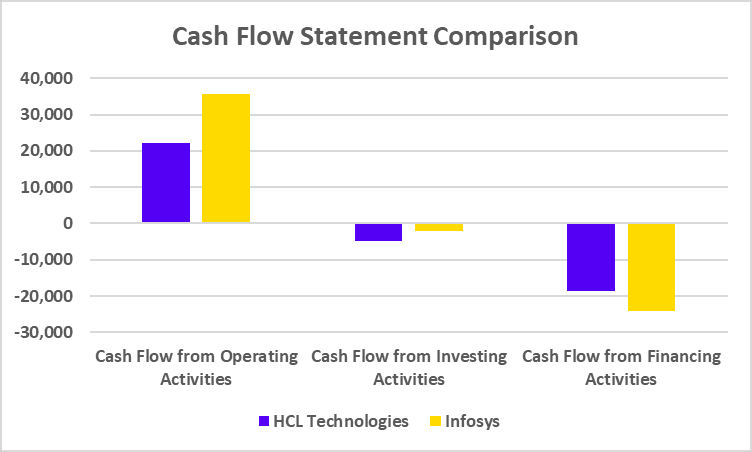
Cash Flow Statement Comparison
| Particulars | Tata Technologies | TCS |
|---|---|---|
| Cash Flow from Operating Activities | 699 | 48,908 |
| Cash Flow from Investing Activities | -88 | -2,318 |
| Cash Flow from Financing Activities | -486 | -47,438 |
Read Also: Infosys vs TCS: A Comparative Analysis of IT Giants
Key Performance Ratios (KPIs)
| Particulars | Tata Technologies | TCS |
|---|---|---|
| Operating Profit Margin (%) | 18.12 | 25.89 |
| Net Profit Margin (%) | 13.01 | 19.11 |
| ROE (%) | 18.91 | 51.24 |
| ROCE (%) | 23.53 | 62.01 |
| Debt to Equity (x) | 0.00 | 0.00 |
Who is better : Tata Technologies or TCS?
Tata Technologies and TCS, the companies may seem similar, but their focus is different. Tata Technologies focuses on where machines need detailed understanding like cars, airplanes or large factory machines. The company specializes in designing, testing and running things virtually.
On the other hand, TCS is a company that provides IT solutions to companies operating in various industries. Be it banks or hospitals, schools or government offices TCS makes work easier everywhere with its software and technology. Both are strong in their respective fields. Tata Technologies focuses on a few industries but designs customized solutions due to its expertise. On the other hand, TCS touches every sector and is spread across the world.
So it is difficult to say which one is “better”. It completely depends on the future financial performance of these firms, the growth potential of the sectors they are involved in and your risk tolerance.
Read Also: Tata Power Vs Adani Power: Comparison Of Two Energy Giants
Future Plans of Tata Technologies
Tata Technologies has sharpened its vision for 2025. The company has strengthened its vision with the tagline “Engineering a Software‑Defined Future” by focusing on client-centric strategies, embedded systems and next-gen vehicle solutions.
- Mentoring client-centric teams : For Jaguar Land Rover, Tata Motors and other global automakers, the company has created dedicated leadership teams that will be aligned with each client’s needs.
- Focus on Embedded Systems and SDV (Software-Defined Vehicles): The crucial component of their business strategy is SDV i.e. vehicles that operate through software. Tata Technologies aims to deliver customized and comprehensive solutions– that is, everything from architecture to implementation. Innovations like ADAS, automated parking, and smart cockpit design are now part of the company’s core offerings.
- Growth in Aerospace and Heavy Machinery : The company is no longer just dependent on the automobile sector; innovation hubs are being created for aerospace and industrial machinery to accelerate design and virtual prototyping.
- The power of digital platforms : In-house platforms such as eVMP, TRACE and FactoryMagix are being further strengthened to enable smart factories and digital twins.
- Global R&D expansion : New R&D networks are being created in Asia, the US and Europe to provide direct support to local clients. There is also a strong focus on ESG, quality of electric vehicles and sustainable manufacturing.
Future Plans of TCS
In 2025, TCS has accelerated growth by keeping its overall approach digital-first and creating separate directions in AI and cloud.
- Launching AI and Cloud as independent verticals : TCS has recently split its AI.Cloud unit into two separate verticals—AI and Cloud—with the aim of focusing more deeply and strategically on each technology area.
- “Human + AI” model : Chairman N. Chandrasekaran said that TCS is now training AI agents and humans to work together. This will lead to increased automation, productivity and decision-making without losing the human touch.
- Global innovation hubs : TCS has created facilities for AI, IoT and cybersecurity trials by opening new innovation centers in Cincinnati, USA and Paris, France to accelerate cross-border experiments.
- BFSI and industry-specific digitalisation : The company is rapidly expanding into new markets especially the UK and India—with SaaS, cloud, AI solutions in the banking and insurance sectors.
- Partnerships and skill development : TCS has forged collaborations with major tech partners like AWS, Google Cloud and Xerox. Also, they have provided generative AI training to 3.5 lakh employees.
Read Also: SAIL Vs Tata Steel: Which is Better?
Conclusion
Tata Technologies and TCS were established for different purposes. One made its mark in developing innovative designing and manufacturing solutions, while the other consolidated its position as a key global IT player. Both have different visions, ways of working and customer base. So instead of comparing, it is more important to understand how each company is adapting to the changing IT landscape. You are advised to consult a financial advisor before investing in any of the companies.
| S.NO. | Check Out These Interesting Posts You Might Enjoy! |
|---|---|
| 1 | JK Tyre Vs CEAT: Which is Better? |
| 2 | Apollo Hospitals vs Fortis Healthcare |
| 3 | ITC vs HUL: Comparison of India’s FMCG Giants |
| 4 | IndiGo vs SpiceJet: Which is Better? |
| 5 | Tata Motors Vs Ashok Leyland: Which is Better? |
Frequently Asked Questions (FAQs)
Are Tata Technologies and TCS part of the same group?
Yes, both are Tata Group companies but their areas of work are different.
What is the main difference between Tata Technologies and TCS?
Tata Technologies specializes in engineering and design solutions, while TCS provides IT services and digital solutions.
Which company is larger in terms of global presence?
TCS’s global network and client base is much larger than Tata Technologies.
Do both companies serve the same industries?
No, Tata Technologies mainly provides innovative solutions for the automobile and manufacturing sector, whereas TCS develops IT solutions for almost every industry.
Is one company better than the other?
Both companies are strong players in their respective fields, who is better depends on the future financial performance and your risk tolerance.