We all know that it is mandatory to complete the KYC (Know Your Customer) process before you can invest in financial assets such as mutual funds. To make this process easy and control it from a single place, SEBI implemented the KRA (KYC Registration Agency) system, one of which is CAMS KRA. This agency stores and manages the KYC details of investors on a central platform.
In this blog, we will discuss the CAMS KRA in detail and how to check the KYC status.
What is CAMS KRA?
The full form of CAMS KRA is Computer Age Management Services – KYC Registration Agency. It is a leading KRA (KYC Registration Agency) of India, which got approval from SEBI in mid-2012. CAMS started in 1988 as an RTA (Registrar & Transfer Agent), but later it also started providing KYC verification services. The main work of CAMS KRA is to collect the KYC information of investors, verify it, and store it in a central database and share it with all financial intermediaries like mutual fund houses, brokers, and other SEBI-registered institutions.
The advantage of this is that once KYC is done, there is no need to submit documents on different platforms again and again. CAMS KRA has developed a trusted and regulated system, which makes the investment process fast, easy and secure.
How many KRAs are there in India?
There are 5 SEBI-registered KRAs in India that handle the KYC process of investors. The work of every KRA is almost the same, but there may be some difference in technical interface, speed and user experience.
Names of main KRAs :
- CAMS KRA (CISPL)
- CVL KRA (CDSL Ventures Limited)
- Karvy KRA
- NSDL KRA
- NSE KRA (DotEx International)
KYC done with any of the KRAs is valid and once it is done, then the same process does not have to be done again in other intermediaries.
Read Also: KYC Regulations Update: Comprehensive Guide
Types of CAMS KRA KYC Forms
Every individual has a different financial profile, and accordingly, different types of KYC forms have been created on CAMS KRA. Choosing the right form makes the KYC process easier and faster. Below are some of the main form types:
- Individual KYC Form : This form is for those who wish to invest in their individual name. It is required to be filled before starting investing in mutual funds, stocks or other financial products. Documents required: PAN card, Aadhaar card, address proof, and photo.
- Non-Individual KYC Form : This form is for companies, trusts, partnership firms, HUFs (Hindu Undivided Families), etc. The format of the form and documents is different as there can be more than one authorized signatory. Documents required: Registration certificate, board resolution, PAN card, ID proofs of authorized representatives, etc., depending upon the applicant.
- Minor KYC Form : This form is to be filled if an investment is being made in the name of a minor. It includes the child’s information as well as the guardian’s details and documents. Documents required are the child’s birth certificate, guardian’s PAN and Aadhaar.
Since the purpose of each form is different, it is very important to understand the type of form correctly while submitting the documents. This ensures that the KYC process is completed without any hindrance.
Advantages of CAMS KRA
CAMS KRA is a platform that not only makes the KYC process easy, but also completes it with confidence and regulations. Here are some of its key benefits:
- Fast processing : The verification process usually takes between 2 to 10 working days, depending on the accuracy of submitted documents and completion of IPV.
- Simple and clean interface : The website is designed in such a way that anyone can easily fill the form and upload documents, even if they do not have much technical knowledge.
- Facility to check status anytime : If you want to know how far the KYC has progressed, you can login to CAMS KRA and check the status anytime and update the information if needed.
- Compliance with SEBI rules : This platform works completely as per the regulations made by SEBI, which ensures that the process is being done in a transparent and correct manner.
- No compromise on data security : User information like PAN, Aadhaar and other details are completely encrypted and stored on secure servers to ensure no data is leaked or misused.
- Valid everywhere: Once KYC is completed on CAMS KRA, it is accepted by most mutual funds, stock brokers and other financial platforms. There is no need to re-do KYC.
CAMS KRA KYC Process: Step‑by‑Step
It is important to complete KYC before you start investing. Completing KYC through CAMS KRA is a simple process that can be completed both online and offline.
Step 1: Fill the correct form
First, choose the KYC form as per your profile (Individual, Non-Individual or Minor). The form requires basic information like name, date of birth, mobile number and address.
Step 2: Submit documents
PAN card, Aadhaar card (or other address proof), passport size photo and active mobile number are required. In online KYC, these have to be scanned and uploaded, while offline, a physical copy is given.
Step 3: In-Person Verification (IPV)
IPV is mandatory, which can be done through a video call or by visiting the nearest centre. Its purpose is to confirm the identity.
Step 4: Verification and Status Update
After verification of all the documents and details, the KYC status becomes “Verified” which can be checked online.
The entire process is regulated by SEBI and UIDAI, keeping investor data secure.
How to Check Your CAMS KRA KYC Status
Knowing whether KYC is complete or not is as important as submitting the documents. Many times, due to lack of information about the process, people assume that their KYC is completed, while it is stuck in the process. Therefore, it is wise to check the KYC status in time.
Online method
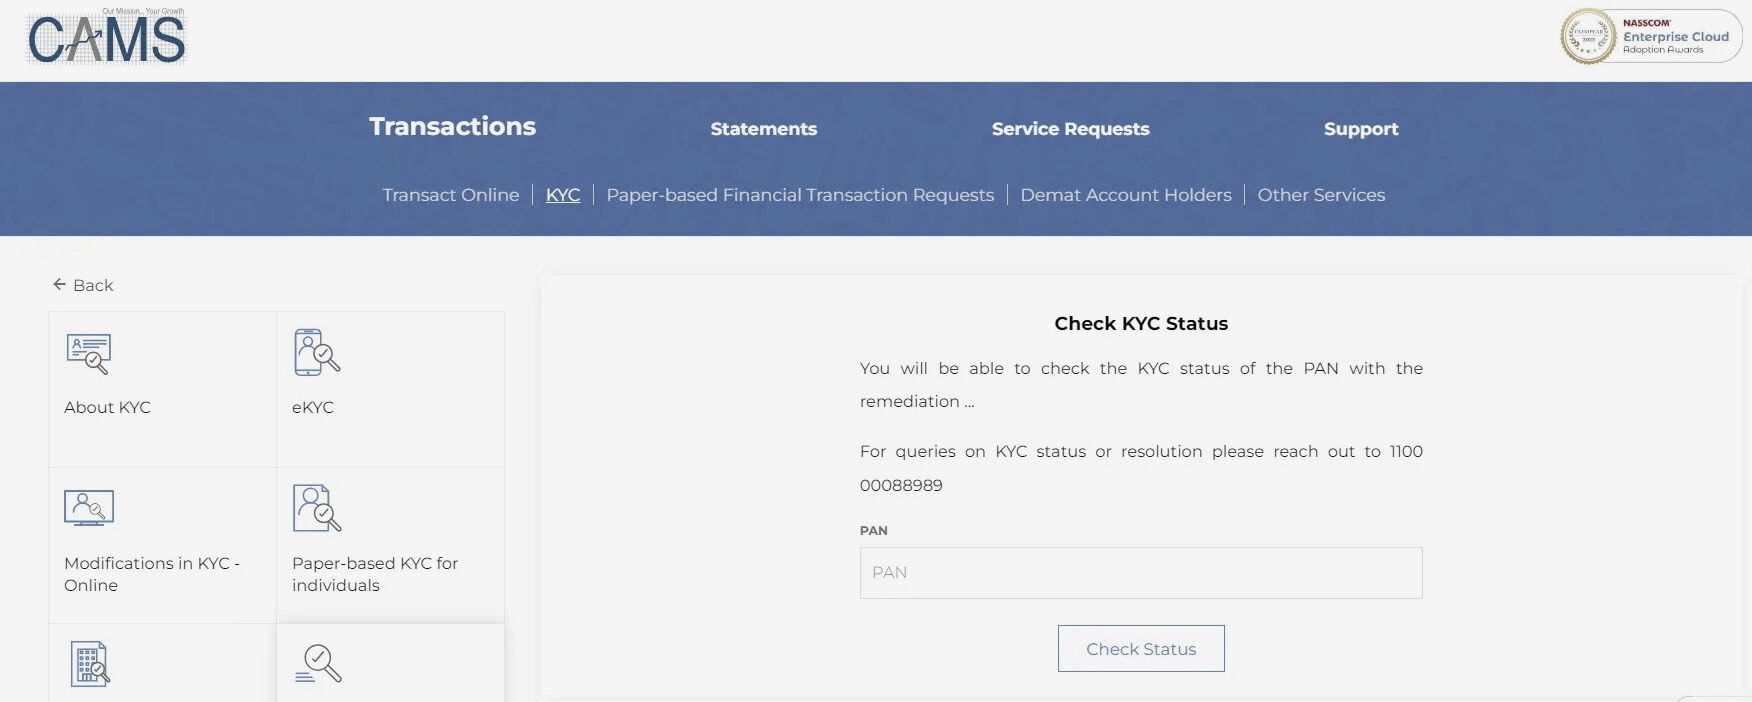
You can check your CAMS KRA KYC status by following the below steps:
- First of all, go to camskra website.
- Select “KYC Status” option.
- Enter your PAN number there.
- As soon as you submit, your KYC status may show as Registered, Validated, On Hold, or Rejected, depending on the progress and verification of your documents..
Offline method : For those who are not comfortable doing it online, they can visit the nearest CAMS centre and check the status by providing PAN details. The team at the centre helps with the process and informs the status immediately.
It is important to keep your KYC status updated to avoid investment disruptions, especially when the documents have been submitted recently.
Different CAMS KRA KYC Status
KYC status indicates the stage of identity and document verification in the investment process. Each status has a specific reason and the next step needs to be decided accordingly:
- KYC Registered / Verified : This means that the entire process has been completed successfully. The documents have been verified and now there will be no hindrance in investing.
- Under Process : This status means that the verification of documents or in-person verification (IPV) is still going on. The process may take some time to complete.
- On Hold / Rejected : This means that some discrepancy has been found in the submitted documents such as difference in name, wrong address, incomplete form, etc.
CAMS KRA vs Other KRAs
- There are five registered KRAs authorised by SEBI to regulate and record the KYC process in India CAMS KRA, CVL KRA, Karvy KRA, NSDL KRA and NSE KRA. All these agencies have the same objective: to keep a record of investors’ KYC information in a standardised and secure system.
- Each KRA works as an independent entity but has interoperability. This means that if KYC is done on one KRA, the same information is considered valid on the platform of another KRA as well. This eliminates the need for investors to get a new KYC done every time.
- Each KRA has its own system, data security model and technology structure. However, all KRAs are required to follow the rules and standards set by SEBI – to keep the process transparent and reliable.
- Different financial institutions (such as mutual funds, stock brokers, etc.) are registered with these KRAs, but all have to follow the same KYC rules. The only difference is in which KRA the process is being done through.
Common problems related to CAMS KRA KYC and their solutions
Some of the common problems related to CAMS KRA KYC and their solutions are:
1. PAN details not showing: Sometimes errors like “PAN not found” can come up. In such a case, first check whether the correct PAN number has been entered or not, and whether it is linked in the government records or not.
2. Name or address not matching : If the name or address given in the KYC form is different from the document, then verification gets hindered. It is important that the information is filled exactly as per the documents.
3. Status is showing Rejected or On Hold : In such cases, often some documents are incomplete or some mistake is left. Read the remarks carefully and correct the mentioned deficiency and upload it again.
4. Technical issue : If the website is not loading properly, then clear the browser cache, try another browser or try from mobile.
Conclusion
CAMS KRA is an easy, secure and reliable way to complete the KYC process. Its interface and service are very useful for everyone, whether a new investor or an already registered one. Operating as per SEBI guidelines, this platform provides a strong foundation to start investing. With the right documents and a little time, anyone can easily check their KYC status and complete the process.
Frequently Asked Questions (FAQs)
What is CAMS KRA?
CAMS KRA is a SEBI-registered agency that registers and verifies KYC details of investors.
How can I check my CAMS KRA KYC status?
KYC status can be checked by entering PAN number on CAMS KRA website.
Is CAMS KRA KYC valid for all platforms?
Yes, once KYC is completed it is valid across platforms.
What documents are required for KYC with CAMS KRA?
PAN card, Aadhaar card and a photo are usually required.
Can I update my KYC details online?
Yes, details can be updated by filling the online form and uploading new documents.