Sometimes, while trading, you must have observed that a particular stock gets stuck in a range. Not going up, not crashing down, just hovering in range, making it nearly impossible for traders with either bullish or bearish positions to generate meaningful profits. However, there is a strategy that can be used in such a scenario to make profits, i.e., Iron Butterfly strategy. This options strategy is useful when you expect the asset price to move sideways.
In this blog, we will break down the Iron Butterfly strategy in simple language, how it works, when to use it, how much you can gain (or lose), and whether it makes sense for your trading style. Whether you are new to options or looking to sharpen your trading edge, after understanding the Iron Butterfly strategy, you’ll walk away with a clear understanding of what to do in a range-bound market.
Iron Butterfly Strategy: An Overview
The Iron Butterfly is a type of options strategy that traders use when they believe that a stock (or any other asset) is not going to show much movement in the near future. It is what you’d use if you think the price is going to stay right around where it is now, neither moving up nor crashing down significantly.
You visualize a zone, a price range, and hope the stock ends up near the middle of it. If it does, you realise profits. If it moves too far outside the zone, you lose money. However, both the maximum profits and maximum loss are limited.
To set this up, you use four options contracts, which are as follows;
- You sell one at-the-money call
- You sell one at-the-money put
- You buy a call with a higher strike than the call sold to protect the upside
- You buy a put with a lower strike than the put sold to protect the downside
When to Use the Iron Butterfly Strategy?
So, when should you use the Iron Butterfly? When you think the stock or index is going to stay range bound. No big moves, only moving slightly above or slightly below the current price. If you spot a stock that is expected to stay close to its current price until the options expire, the Iron Butterfly can be a good option. It is perfect for range-bound situations where the price seems stuck. The strategy also works well when volatility is high as most of the time volatility is mean-reverting and as the volatility cools off, the option premiums decline yielding profits.
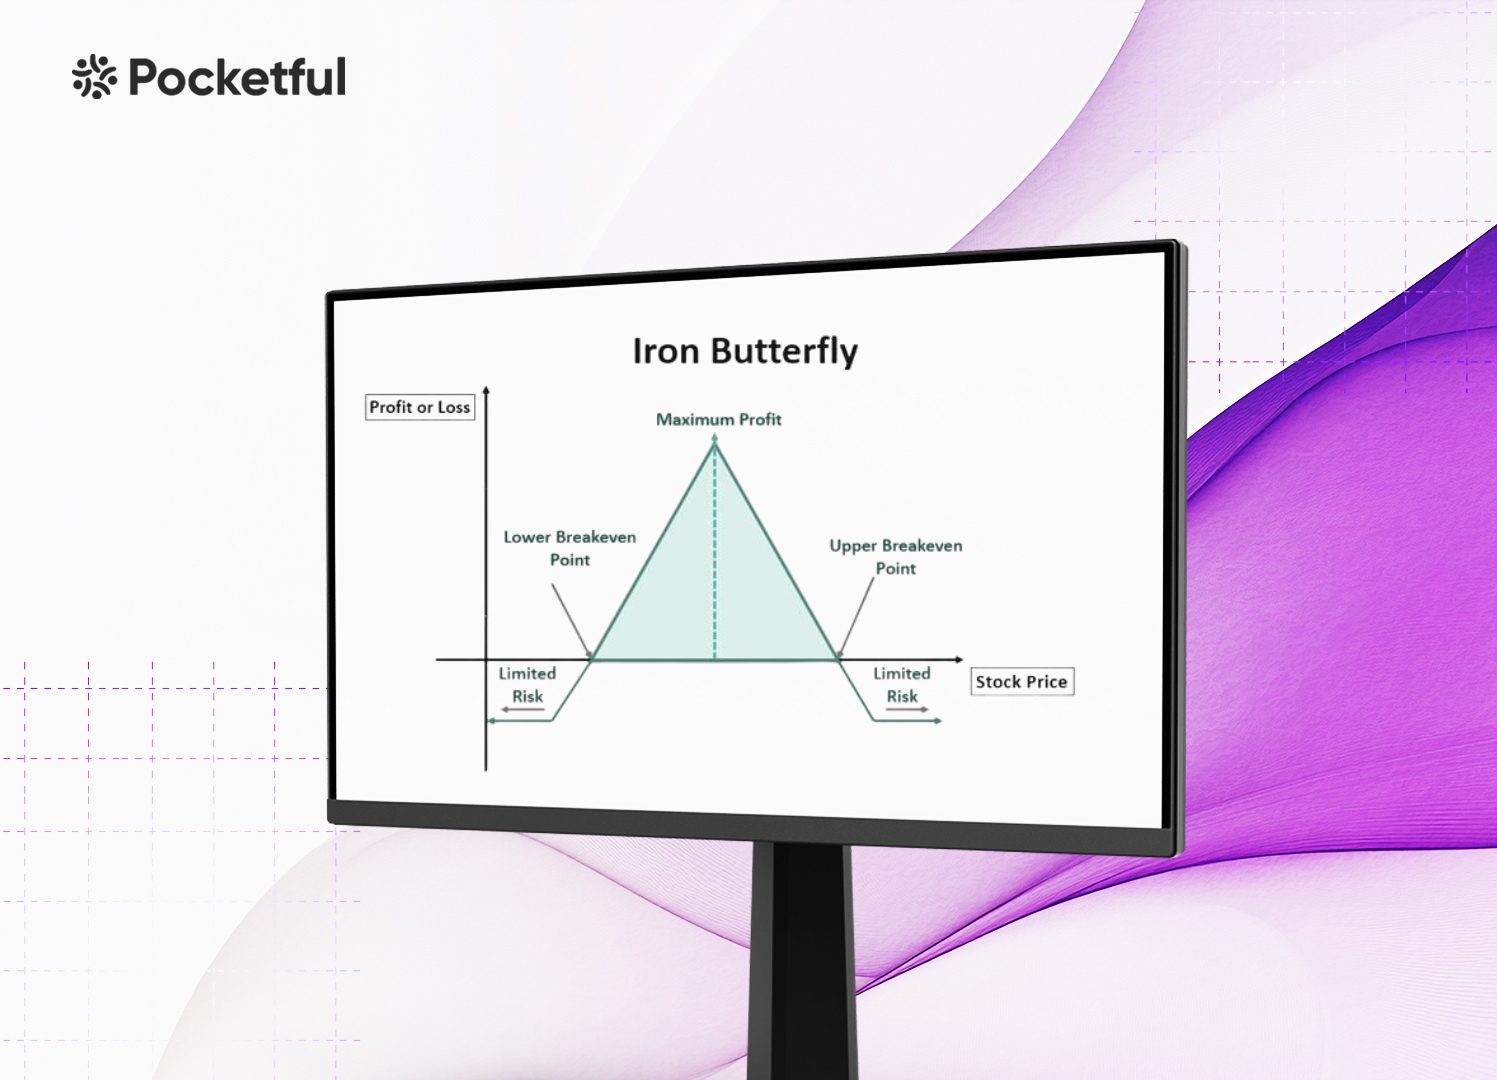
Profit, Loss & Breakeven Analysis
Let us break down the most important part – how much you can make, how much you could lose, and where your break-even points are in case you plan to execute an Iron Butterfly strategy.
Maximum Profit
Your maximum profit is when the stock ends up exactly at the middle strike price, i.e., the strike price of at-the-money options you sold because, both the call and put you sold expire worthless (you keep the premium), and the two options you bought (the wings) also expire worthless, which means you keep the entire premium collected upfront.
Max Profit = Premium Collected
Maximum Loss
But what if the stock moves a lot, either up or down, and goes beyond the wings, i.e., the strike prices of the options you bought)?
That’s when one of the bought options comes into play as either the call with higher strike price gains in value or put with lower strike price rises, when you start losing money on one of the ATM option positions. In simple terms, your loss is capped because of the protective wings.
Max Loss = Distance Between Strike Prices – Net Premium Collected
Breakeven Points
There are two breakeven points, one on the upside and one on the downside. These are the prices at which you neither make nor lose money.
Upper Breakeven Point = ATM strike + Net Premium Collected
Lower Breakeven Point = ATM strike – Net Premium Collected
Example
Let’s say Stock ABC is currently trading at ₹100. You believe the stock is going to stay close to ₹100 for the next few weeks, not much movement up or down. We are considering the lot size of options contracts to be 100.
- Sell 1 ATM Call with strike price 100 – Premium received is 6 Points or ₹600
- Sell 1 ATM Put with strike price 100 – Premium received is 6 Points or ₹600
- Buy 1 OTM Call with strike price 110 – Premium paid is 3 Points or ₹300
- Buy 1 OTM Put with strike price 90 – Premium paid is 3 Points or ₹300
Net Premium Collected is (6 + 6) – (3 + 3) = 6 Points or ₹600
Now, at the expiry
- Case 1: If Stock Ends at ₹100, then all options expire worthless, you keep the ₹600 premium and this is your maximum profit.
Net Profit = ₹600
- Case 2: If Stock Falls to ₹97; ATM call, OTM call and OTM put are worth zero. However, ATM put has some value and the net P&L is calculated as:
P&L = ATM call value + ATM put value + OTM call value + OTM put value
=(6 – 0) + (6 – 3) + (0 – 3) + (0 – 3) = 3 points = ₹300
- Case 3: If Stock Rises to ₹108; ATM put, OTM call and OTM put are worth zero. However, ATM call has some value and the net P&L is calculated as:
P&L = ATM call value + ATM put value + OTM call value + OTM put value
= (6 – 8) + (6 – 0) + (0 – 3) + (0 – 3)= – 2 points = -₹200
- Case 4. Breakeven Points will be as follows;
Lower Breakeven = 100 – 6 = 94
Upper Breakeven = 100 + 6 = 106
At 94: P&L = (6 – 0) + (6 – 6) + (0 – 3) + (0 – 3) = 0
At 106: P&L = (6 – 6) + (6 – 0) + (0 – 3) + (0 – 3) = 0
Advantages & Risks of Using Iron Butterfly Strategy
Advantages
1. Limited Risk: Your maximum loss is capped and you know exactly how much you could lose before you even execute the trade. That makes it a safer bet than other strategies.
2. Defined Profit Range: You also know your max profit in advance, which helps you plan your risk-to-reward clearly.
3. Good for Range-Bound Markets: If you think the market will stay in a range, this strategy is a great way to make money.
4. Take Advantage of Time Decay: Because you are selling options at the money, you benefit from time decay, which means your position becomes profitable even if the stock does not move much.
Risks
1. Limited Reward: The potential profit is limited and the position must be held for a long time to take advantage of time decay.
2. High Risk if Stock Moves Sharply: If the stock makes a considerable move in either direction, it can result in maximum loss, especially in a volatile market.
3. Requires Precise Prediction: You need to be very accurate about where the stock price will be at expiry. Even small unexpected moves can turn profitable trades into losses.
4. Higher Brokerage Costs with 4 Legs: Since the Iron Butterfly strategy involves 4 option contracts, transaction costs can add up, especially for frequent traders.
Conclusion
The Iron Butterfly strategy is a steady, risk-defined approach for traders who believe a stock or index will remain in a zone for a while. With limited risk and limited reward, it is more about precision and patience. If you are someone who enjoys planning your trades carefully, managing risk, and profiting from sideways markets, the Iron Butterfly can be a great addition to your options strategies list.
That said, this strategy is not for every market condition. Significant events accompanied with sudden volatility can cause the prices to move considerably causing losses. Therefore, timing is everything. In the end, like any other strategy, success with the Iron Butterfly comes down to knowing when to use it and how to manage it.
| S.NO. | Check Out These Interesting Posts You Might Enjoy! |
|---|---|
| 1 | What is Options Trading? |
| 2 | What is Algo Trading? |
| 3 | What is Intraday Trading? |
| 4 | What Is an Option Contract? |
| 5 | Best Trading Apps in India |
Frequently Asked Questions (FAQs)
What is the Iron Butterfly strategy?
It is an options trading strategy consisting of 4 options contracts that yields profits when the stock stays near its current price and losses if it moves considerably.
Is the Iron Butterfly bullish or bearish strategy?
Neither, it is a neutral strategy. You use it when you expect little to no movement in the stock price.
How many options are used in an Iron Butterfly?
Four, you sell one call, sell one put (both of the same strike), and buy one OTM call and one OTM put.
How much can I lose if I use the Iron Butterfly Strategy?
The Iron Butterfly strategy is a risk-defined strategy, so your maximum loss is limited to the difference between the strike prices of the wings minus the net premium collected.
Is this strategy good for beginners?
It is not a simple strategy to manage, but once you understand how it works, it can be a smart and structured way to trade range-bound markets.