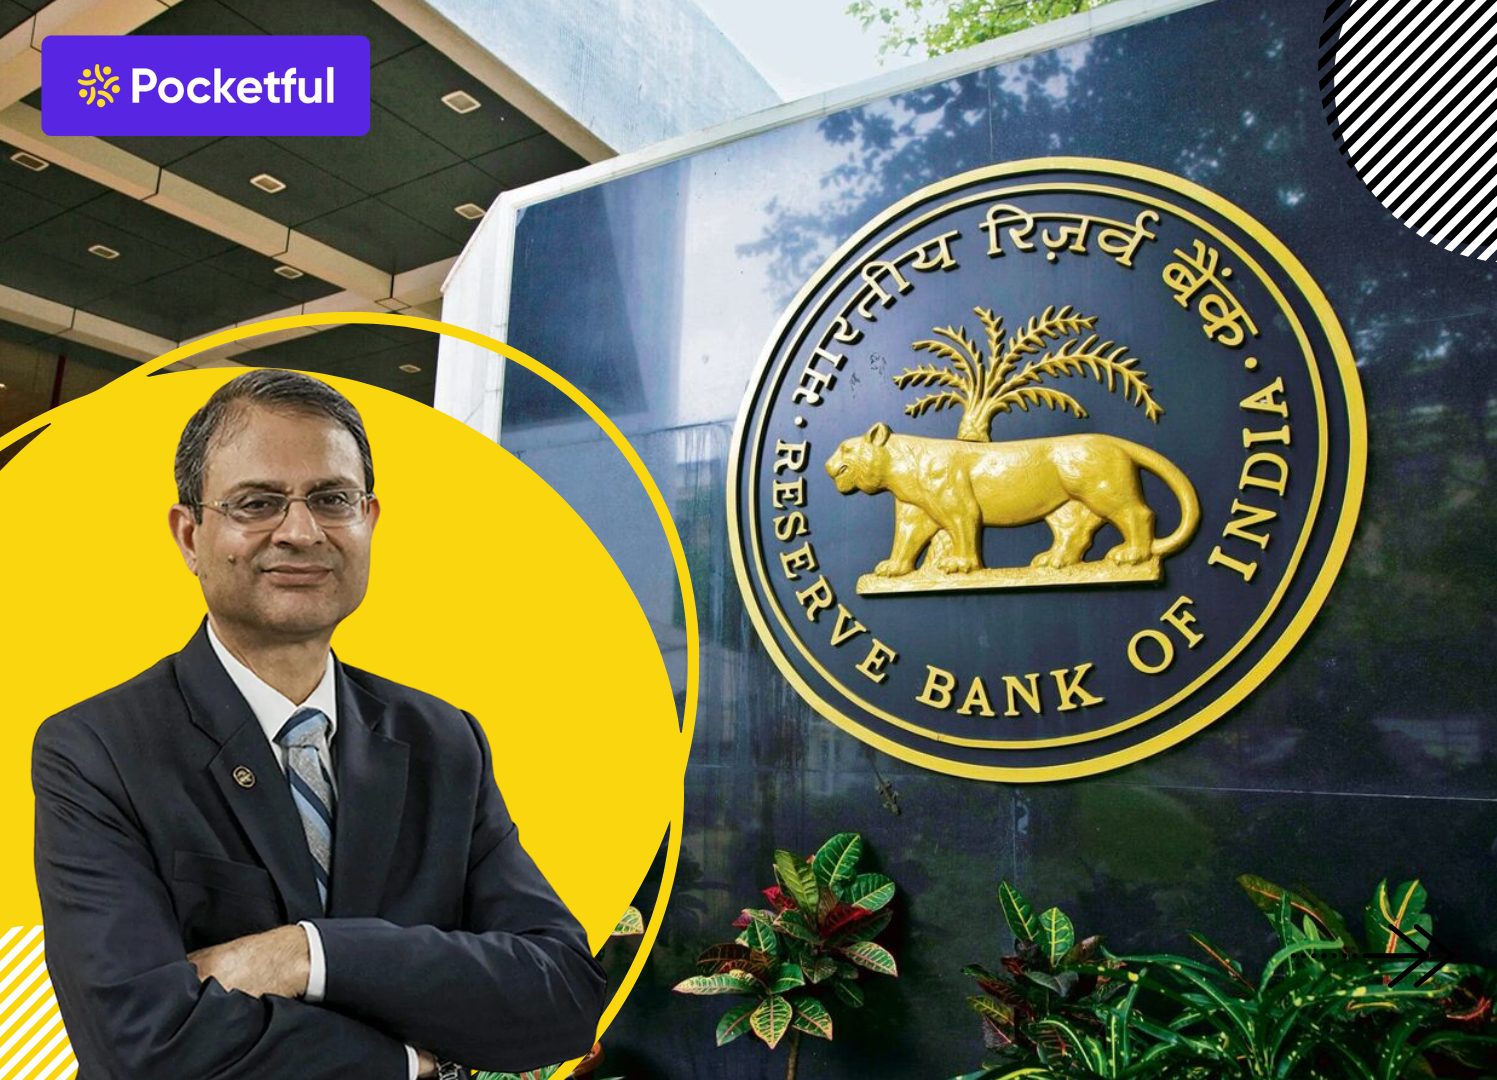
Amid a shifting global economic landscape and geopolitical uncertainties, the RBI’s June 2025 monetary policy offers crucial insights into India’s financial direction. RBI released its new monetary policy on 6 June 2025, in which an attempt has been made to support economic growth by reducing interest rates.
Here’s a quick breakdown of key decisions shaping growth, interest rates, and market sentiment.
Key Decisions
Key decisions
Description
Repo Rate
Cut by 0.50%, new rate at 5.5%
Cash Reserve Ratio (CRR)
Reduced from 4% to 3%
Policy Stance
Now “Neutral”
FY26 GDP Growth Estimate
6.5%
FY26 Inflation Forecast
3.7%
Its Effects
Relief in EMI: Due to the reduction in interest rates, home loans and car loans will become cheaper.
Market boom: Positive sentiment seen in the banking and real estate sector.
Boosting economic momentum: Lower interest rates are expected to boost investment and spending.
Impact of RBI’s monetary policy on different sectors
RBI’s new policy affects every sector. Let’s see which sectors will benefit this time and why:
Banking and NBFC sector: When interest rates are low, banks get cheap money. This means that they will be able to give out more loans. NBFCs i.e. non-banking finance companies will also have access to cheap credit, making it easier for common people to take loans.
Real estate sector: This is good news for home buyers because the interest rates on home loans will be low, which will also reduce EMI (installment). This will encourage people more interested in buying a house, resulting in higher real estate prices.
Automobile sector: Buying cars and bikes will also become cheaper. Due to low interest rates, financing will be easy, encouraging more people to buy vehicles, especially during festivals.
Consumer goods and retail sector: When interest is low, people spend more. This benefits the FMCG and retail sectors selling everyday items as the number of buyers increases.
Stock market and capital market: A reduction in interest rates reduces the bond yield, which is a good sign for the stock market. This increases investor participation in equity markets and leads to a boom in the equity markets.
In this way, this policy decision of the RBI will strengthen the country’s economy as well as bring positive changes in various sectors.
Reasons behind RBI’s policy decision (June 2025)
The reasons behind the RBI’s decision regarding the rate cut have been explained below:
Balance of inflation and economic growth: Inflation rate (CPI) in India stood at around 3.16% in April 2025, which is lower than RBI’s target of 4%. This means that prices have not increased much. Therefore, interest rates were reduced to boost economic growth. Also, GDP growth has been estimated at 6.5% for the financial year 2025-26, which shows that the economy is growing at a good pace.
Global economic environment and challenges: Oil prices remain between $60 and $65 per barrel, down from a high of $80 per barrel in January 2025. Reduction in oil prices increases profit margins of companies. Apart from this, the Russia-Ukraine war and other political instabilities are also slowing down the economic recovery a bit.
Liquidity in the banking system: RBI has decreased the Credit Reserve Ratio (CRR) to 3% to increase the availability of cash. This means that banks will have more money, so that they can give more loans and this will accelerate economic activities.
Updated GDP and Inflation Rate Projections for FY26 As per June 2025 RBI Policy
RBI’s next monetary policy review will be in August 2025. This time the focus will be on inflation trends. At present, the inflation estimate for FY26 is 3.7%, but if this inflation increases more than expected due to a substantial rate cut, then RBI may have to change its strategy. Also, the monsoon situation will also be important because a good monsoon keeps the prices of food items under control and demand remains stable.
The world’s big central banks like the Fed of America and the ECB of Europe are now moving towards keeping interest rates stable or reducing them slightly. Due to this, RBI may also have to show some leniency in its decision. But at the same time, it will also keep a close eye on risks like credit growth and rupee volatility.
In short, the RBI will try to promote economic growth in the coming times as evidenced by the substantial rate cut of 50 basis points in June 2025. Its priority will be to maintain a balance between promoting economic growth and controlling inflation.
Conclusion
RBI’s monetary policy of June 2025 focused on maintaining a balance between inflation control and economic growth. In view of the global and domestic economic conditions, RBI has given priority to financial stability and economic growth. In the coming months also, RBI’s policies will affect the key economic sectors and equity markets. This is the time for investors and the general public to move forward with caution.
Frequently Asked Questions (FAQs)
What is the current inflation forecast by RBI for FY26?
RBI has projected inflation for FY26 at 3.7%, lower than the earlier estimate of 4%.
Has RBI changed the GDP growth estimate for FY26?
No, RBI has retained its GDP growth forecast for FY26 at 6.5%.
How will global economic conditions affect RBI’s policy?
Global economic conditions, especially the policies of the US and European central banks, influence RBI policy, thereby impacting India’s economic stability.
What should borrowers expect after the June 2025 RBI policy?
RBI’s policy is balanced, so a sudden big change in interest rates is less likely, but it is important to keep an eye on the market situation.
How does RBI plan to manage inflation and growth simultaneously?
RBI will continue to implement policy measures such as interest rate changes, open market operations, etc. to promote growth while keeping inflation under control.
You may have come across Bajaj Finance and Bajaj Finserv if you have searched for loans, insurance or investment options on the internet. They both seem alike, belong to the same group and are commonly found in similar web searches, but they aren’t the same.
So what exactly is the difference, and if you’re a customer or an investor, which one should you be looking at?
In this blog, we’ll explain everything in a simple way about each company and which one might be a better fit for your portfolio. Whether you’re trying to understand whom to approach for a loan or deciding which stock to invest in, this guide is here to make it easy.
Bajaj Finserv – Company Overview
Bajaj Finserv Limited is one of India’s leading financial services companies. It operates across a wide range of financial segments, including:
Consumer finance (like personal loans, home loans, EMI cards offered through subsidiaries)
Insurance (life and general)
Asset management
Wealth management
Mutual funds
Digital payments and more
It’s known for its quick loan approvals, flexible EMIs, and strong digital presence that makes borrowing or investing super convenient for individuals and businesses alike.
The company has its headquarters in Pune, Maharashtra and was founded in 2007 and is currently headed by chairman, Sanjiv Bajaj. The parent group is the Bajaj Group, which was founded by Jamnalal Bajaj in 1926.
Important Milestones
From 2008 to 2012: Bajaj Finance grew rapidly by offering consumer durable loans on easy EMIs, one of the first of its kind in India.
From 2013 to 2017: Expanded into personal loans, business loans, and housing finance.
2018: Bajaj Finserv crossed major growth thresholds as loan disbursements increased substantially and the assets under management crossed ₹1 lakh crore, with a combined customer base of 25 million.
2020–2022: Entered the digital payments space and launched Bajaj Finserv Wallet, Bajaj Finserv Health, and focused on building a digital ecosystem.
2023: Announced foray into mutual funds under the Bajaj Finserv Mutual Fund brand.
Bajaj Finance – Company Overview
Bajaj Finance Limited is one of India’s top non-banking financial companies (NBFCs). It offers a wide range of financial products and services, including:
Consumer durable loans (like TVs, mobiles, appliances on EMI)
Personal loans
Home loans
Business loans
Credit cards
Fixed deposits and investment products
The brand is recognised for offering No Cost EMI on various products, including gadgets, furniture, travel, etc., which is readily available at many partner stores and online platforms.
The business is headquartered in Pune, Maharashtra and started operations as Bajaj Auto Finance Limited in 1987. Interestingly, Bajaj Finance is a subsidiary of Bajaj Finserv.
Important Milestones
In 2007, Bajaj Auto underwent a corporate demerger. Its financial services arm became a separate entity, Bajaj Finserv Limited, and Bajaj Auto Finance was rebranded as Bajaj Finance Limited.
Rajeev Jain was the CEO, marking the beginning of a significant transformation.
Focus shifted from just auto finance to consumer lending, SME lending, and commercial lending.
From 2010 to 2020
Introduced EMI cards, allowing customers to shop for electronics, furniture, and appliances on easy instalments.
Rapidly expanded into digital lending, e-commerce finance, and partnerships with retailers and brands.
Built a wide offline and online network, facilitating extremely fast and hassle-free loan disbursals.
From 2020–Present
Launched the Bajaj Finserv App for digital financial solutions.
Stepped into the digital payments ecosystem with digital wallets and co-branded credit cards.
Leveraged AI, data analytics, and cloud technology for personalised financial services.
Despite market challenges like COVID-19, it bounced back strongly with innovative financial products and digital-first strategies.
Comparative Study of Bajaj Finserv and Bajaj Finance
PARTICULARS
BAJAJ FINSERV
BAJAJ FINANCE
Current Price (₹)
1,956
8,945
Market Cap (₹ Crore)
3,12,532
5,55,868
52-W High (₹)
2,135
9,710
52-W Low (₹)
1,511
6,425
FII Holdings as of March 2025
7.19%
18.91%
DII Holdings as of March 2025
9.34%
17.42%
Book Value (₹)
453
1,556
PE Ratio (₹)
35.2
33.4
As of 6 June 2025
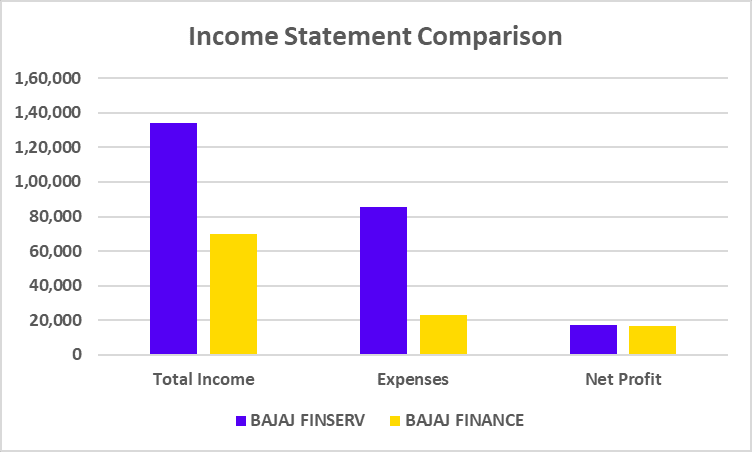
Financial Statements Comparison
PROFIT & LOSS STATEMENT
Particulars
BAJAJ FINSERV
BAJAJ FINANCE
Total Income
1,33,821
69,724
Expenses
85,782
22,892
Net Profit
17,539
16,761
(All values are in INR crores and the data is as of March 2025)
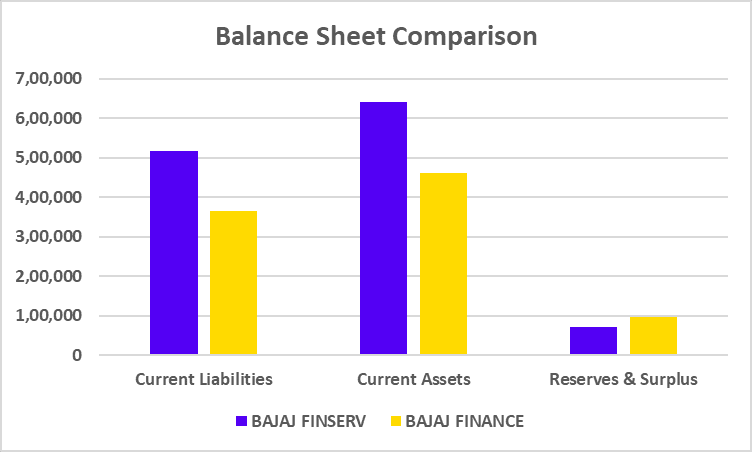
BALANCE SHEET
Particulars
BAJAJ FINSERV
BAJAJ FINANCE
Current Liabilities
5,16,745
3,66,042
Current Assets
6,41,639
4,60,437
Reserves & Surplus
72,235
96,568
(All values are in INR crores and the data is as of March 2025)
CASH FLOW STATEMENTS
Particulars
BAJAJ FINSERV
BAJAJ FINANCE
Cash Flow from Operating Activities
-62,113
-68,154
Cash Flow from Investing Activities
-7,986
-2,765
Cash Flow from Financing Activities
70,191
70,527
(All values are in INR crores and the data is as of March 2025)
Inference
Bajaj Finserv has about ₹1.3 Lakh crore in revenues, which also includes revenues from its stake in Bajaj Finance. This approach reduces dependence on lending alone and promotes a more balanced portfolio. On the contrary, Bajaj Finance reported an impressive profit of ₹16,761 crore. Additionally, the company’s AUM surged past ₹3 lakh crore.
You can base your investment decision based on the following points:
If you want to invest specifically in the lending business, go for Bajaj Finance.
If you want diversified exposure (loans, insurance, mutual funds, etc.), then Bajaj Finserv is a better long-term pick.
However, it is advised to analyse the company’s financial statements and future business plans before investing. You should also consult a financial advisor to make an informed investment decision.
Ultimately, Bajaj Finance and Bajaj Finserv are two sides of the same coin, closely connected, but established for different purposes. If you’re a customer looking for loans, EMIs, credit cards, or fixed deposits, Bajaj Finance is the brand you’ll be dealing with. It’s fast, efficient, and focused on direct financial services. But if you’re an investor thinking long-term and want a slice of the entire financial services, from lending to insurance to digital solutions, then Bajaj Finserv gives you a more diversified exposure as the parent company. So, the “better” company depends on what you’re looking for. Whichever company you choose, one thing’s for sure that both companies have established a strong reputation in India’s financial services industry.
S.NO.
Check Out These Interesting Posts You Might Enjoy!
Are Bajaj Finance and Bajaj Finserv the same company?
No, they’re not the same, but they’re related. Bajaj Finance is a subsidiary of Bajaj Finserv.
Which company gives loans, Bajaj Finance or Bajaj Finserv?
Bajaj Finance offers loans, EMIs, credit cards, and deposits. Bajaj Finserv does not directly give loans.
Is Bajaj Finance safe for FDs?
Yes, Bajaj Finance has high credit ratings (CRISIL AAA/Stable & ICRA AAA/Stable), making it a reliable FD option.Q4. Which company has more profits?
Which company has more profits?
Bajaj Finserv has marginally higher profits than Bajaj Finance, but it must be taken into consideration that Bajaj Finance is the subsidiary of Bajaj Finserv due to which a proportion of profits earned by Bajaj Finance is also reflected in profits of Bajaj Finserv.
Is Bajaj Finserv a bank?
No! It’s a non-banking financial holding company. It owns stakes in other businesses dealing in finance, insurance, and wealth management.
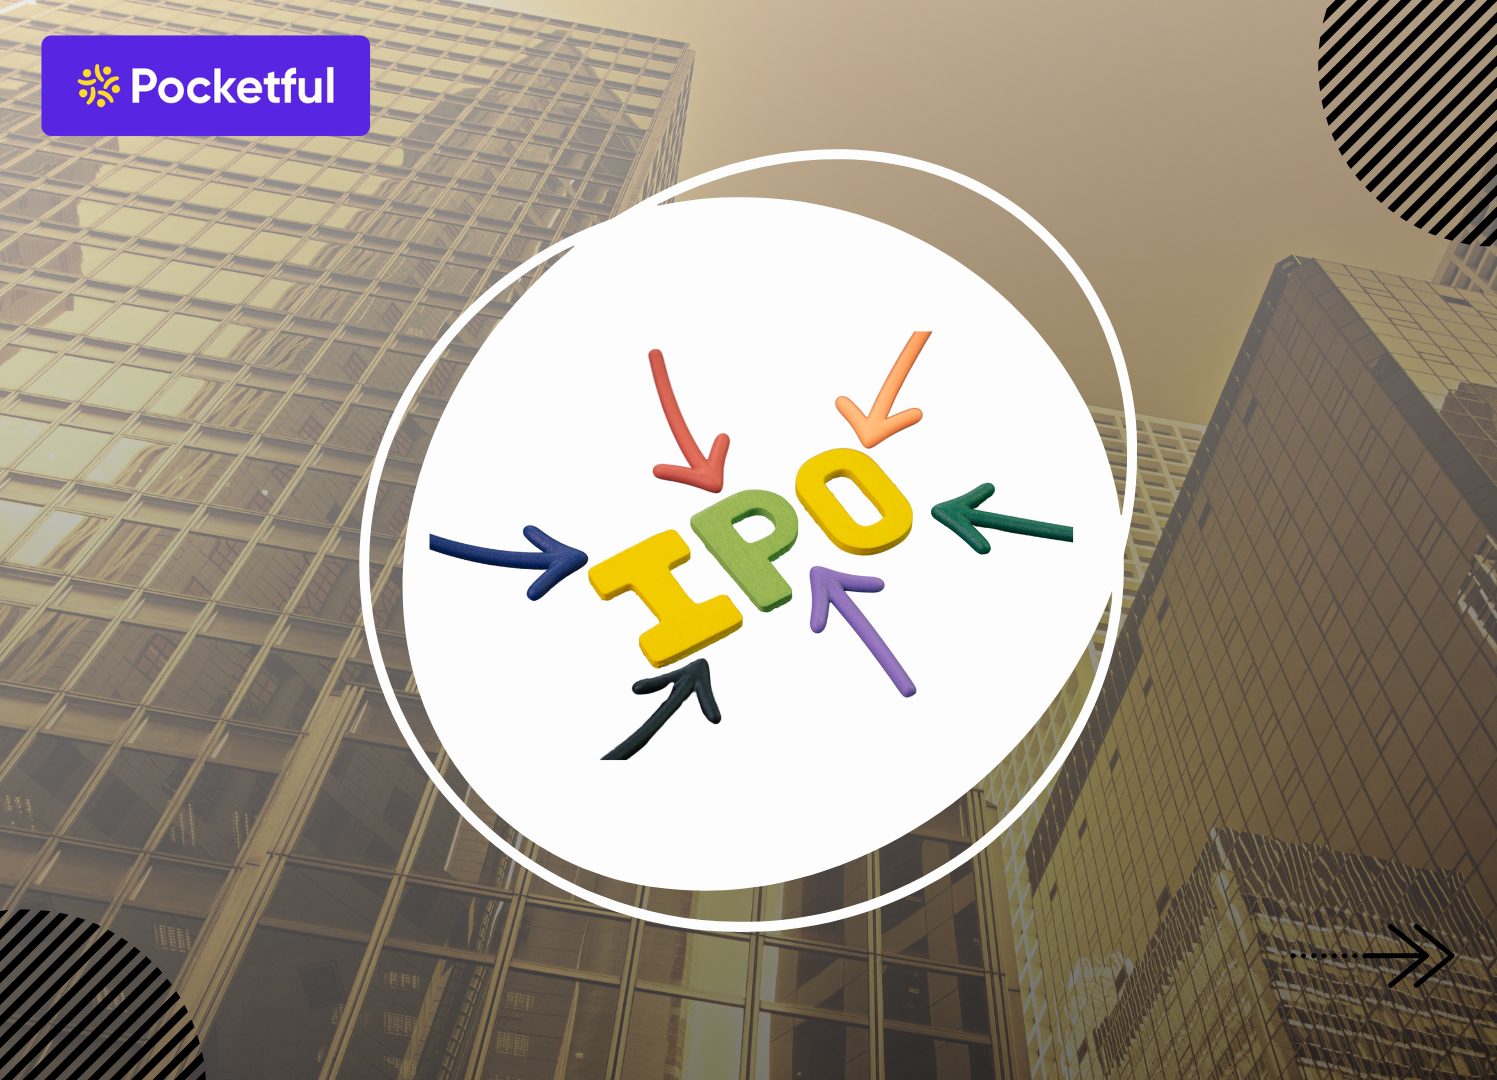
This question comes to the mind of every person who is interested in the stock market. When a private company offers its shares to the public for the first time to raise capital, it is called an Initial Public Offering (IPO). Its main objective is to raise funds from investors for expansion, reducing debt, and other purposes.
In this blog, we will discuss the various reasons due to which the company goes public and launch an IPO in detail.
Understanding IPOs
When a private company offers its shares to the general public for the first time, it is called Initial Public Offering (IPO). After this process, the company gets listed on the stock exchange and anyone with a trading and demat account can buy its shares. The advantage of this is that the company can raise funds quickly and can act quickly on its business plans.
Becoming a Public Company : After bringing an IPO, the company is identified as a public entity. Now it has to make its financial information public every quarter and must comply with regulatory frameworks set by bodies like SEBI and stock exchanges. This gives transparency to investors and also increases the brand value of the company.
Important Statistics Related to IPO in India
Latest scenario of IPO in India : The IPO market in India performed tremendously in the financial year 2024-25. During this period, companies raised a total capital of ₹3.71 lakh crore — which is 92% more than last year. In 2024 alone, the companies raised ₹1.67 lakh crore through IPOs, which is the highest in Asia.
Global Comparison: India now ranks first in terms of number of IPOs. While the US and China saw 205 and 130 IPOs getting launched in 2024, India’s count stood at 332.
Various reasons due to which the companies go public are listed below:
Access to Capital : Every business needs funds to expand whether it is to open a new manufacturing plant, invest in technology or repay old debts. By bringing an IPO, companies can raise large amounts of money directly from the general public. These funds help them to act on the business plans quickly, without the tension of repaying loan or interest payments.
Increasing Brand Value and Public Profile : When a company is listed in the stock market, its brand identity and credibility automatically increases. Its image becomes strong among investors, media and industry due to high regulatory requirements of SEBI. This also easily helps in getting new partnerships and clients and builds trust.
Exit option for Early Investors : Before bringing an IPO, the shares of the company are owned by a few sophisticated investors and founders. But through IPO, they get a chance to sell their shares. This process gives them liquidity, which is not easily available in private companies.
Attracting and retaining talent : In today’s competitive world, retaining talent is very important. After becoming a public company, employees with vested ESOPs can easily sell their shares as per the company’s ESOP (Employee Stock Ownership Plan) policies. After the IPO, the shares are traded and if the company’s share performs well, the trust of the employees in the company’s future increases and they are more inclined to stay with the company.
For all these reasons, bringing an IPO is not just a significant event in a company’s journey, but a strategic decision which can take the company on the path of long-term success.
When a company goes public by launching an IPO, it not only receives funds but also many strategic and long-term benefits. Let us understand these at a glance:
Benefit
Description
Capital Acquisition
The company gets significant capital from the public, which it can use for various purposes.
Market Visibility
Listed companies receive more attention from the media and investors, which increases brand visibility and credibility.
Share Liquidity
After the IPO, shares can be easily bought and sold, providing liquidity to old investors and employees.
Market-Driven Valuation
The stock market participants play a key role in determining the value of a company, which becomes a benchmark for future deals and investments.
Employee Incentives
Plans like stock options and ESOPs make it easier to attract and retain talent.
Better Borrowing Power
It is easier for public companies to get loans from banks on better terms as their financial information is publicly available.
Transparency
Strict regulatory rules improve the governance and trustworthiness of the company.
Disadvantages and Challenges
There are many benefits of a company going public, but there are some challenges and disadvantages associated with it as well. Let us know the major disadvantages and difficulties that a public company has to face:
Regulatory Compliance : A public company has to follow strict rules of SEBI and other regulatory bodies. This includes regular financial reporting, audits and providing comprehensive financial information, which can be time-consuming and expensive.
Market Pressure : The expectations of investors and the market increase a lot. The company’s management may feel the pressure to show good results every quarter, which can sometimes affect long-term business plans.
Loss of Control : Depending on shareholding structure, founders may experience dilution of control and increased accountability to public shareholders. They have to consider the interests of other investors, which complicates decision making.
High Costs : Advisors, investment banks and lawyers have to be paid in the IPO process. Apart from this, regular reporting and other corporate expenses also increase after becoming a public company.
Let us know the main steps a company follows to launch an IPO:
Step
Description
Selection of Underwriters
The company first selects the investment banks or firms that will manage the IPO. These underwriters help with pricing, marketing, and other due diligence required in the IPO.
Due Diligence
The financial, legal and operational status of the company is thoroughly examined to ensure that investors get accurate information.
Regulatory Filings
The company submits a Draft Red Herring Prospectus (DRHP) to SEBI. After review and incorporating changes based on SEBI’s comments, the final RHP (Red Herring Prospectus) is filed for public subscription.
Pricing the IPO
The initial price of the share is determined by looking at the market conditions, value of the company and demand among investors.
Marketing
Company’s representatives meet investors, explain the company’s strengths and plans to increase investor interest.
Going public and listing
Once the IPO opens, the retail investors can apply for the shares. After the IPO subscription period is over, the shares are allotted to the general public and the company gets listed on the stock exchange (like NSE or BSE) and are then traded.
Going public is a big decision for a company, which has many benefits and challenges. IPO helps companies raise funds and also increases its brand recognition, but with this the regulatory requirements and responsibilities towards stakeholders also increases. Therefore, it is important that the company takes this step thoughtfully.
Going public is not just a way to raise money, but is part of the long journey of the company. With the right timing and planning, it helps in moving the company forward. Therefore, the decision of IPO should always be taken wisely and strategically.
S.NO.
Check Out These Interesting Posts You Might Enjoy!
CRED didn’t enter the fintech space with a product. It entered with the idea that good financial behavior deserves recognition. Launched in 2018, CRED quickly gained a reputation for being the best fintech platform for India’s top credit card users. It wasn’t just about paying bills, but about being part of a trusted community.
This CRED case study looks beyond the surface to understand what made a credit card payment app feel premium. With exclusive rewards and a members-only customer base, CRED built both loyalty and intrigue.
But how sustainable is it? What powers the CRED Business Model, and how does a rewards-first app justify its massive valuation? Let’s unpack the brand that turned financial discipline into social currency.
About CRED
CRED is a Bengaluru-based fintech platform founded by Kunal Shah in 2018. It is a platform that allows individuals with high-credit scores to get registered and make payments while earning rewards. The various services offered by CRED include:
CRED Cash+ (short-term credit against mutual funds)
CRED Pay (payments using CRED coin or saved credit cards)
CRED Mint (peer-to-peer lending)
Rent payments
Curated e-commerce section called CRED Store
The platform utilizes an AI-backed system to assess user’s credit behavior, verify eligibility, and tailor customized experiences. This technology enables CRED to maintain its premium user base. The platform also offers personalized suggestions, real-time tracking, and many more features.
With a strong focus on design, exclusivity, and community, CRED has become one of India’s most distinctive fintech brands. Its app offers not just utility, but an elevated financial experience for credit-savvy users who value rewards, simplicity, and trust.
CRED Valuation
In May 2025, CRED raised $75 million in a Series G funding round. Existing investors, including GIC, Sofina, and RTP Global led it. This round brought the company’s total funding to over $1 billion across nine rounds.
The current valuation is approximately $3.5 billion, a sharp drop from $6.4 billion in 2022. Additionally, the company plans to launch an initial public offering (IPO) in the near future.
CRED Key Statistics (As of FY 24)
Metric
Data
Revenue
₹2,473 crore
User Base
13 Million
Monthly Transacting Users (MTU)
11.5 Million, an increase of 34%
Total Payment Value (TPV)
₹6.87 lakh crore, which is a rise of 55%
Operating Losses
A fall of 41% to ₹609 crore
Customer Acquisition Cost (CAC)
Reduction of 40% approx.
Currently, the company continues to focus on expanding its user base and enhancing monetization strategies. This is why it is essential to understand the company’s performance; a complete SWOT analysis of CRED is essential.
CRED primarily follows a Business-to-Consumer (B2C) model. This model targets individuals with high credit scores who use credit cards. The platform incentivizes responsible financial behavior, such as when the user pays bills on time and earns rewards. To drive engagement, it focuses on gamification and personalized experiences.
Recently, CRED has expanded into some Business-to-Business (B2B) services. These are primarily focused on corporate expense management through its Happay platform, which CRED acquired in 2021 for $180 million. But still, its core revenue stream and growth comes from B2C only.
How Does CRED Work?
CRED functions as an invite-only platform. Typically, a 750 credit score is needed to get accepted. Once the app is downloaded, the credit score is checked at the backend. If the same is found satisfactory, the user is onboarded.
After onboarding, users can:
Pay Credit Card Bills: This is the primary feature. Users earn CRED coins on transactions.
Redeem Rewards: CRED coins can be used to claim exclusive offers and discounts on products from the CRED Store.
Access Financial Services: Users can access CRED Cash for instant credit, use CRED Mint for lending, and even pay rent via credit cards.
Monitor Your Credit Health: The app provides insights into your payment history. You can keep an eye on your credit card payments. CRED’s AI features help you track spend patterns and other card usage statistics with due date reminders on each payment.
The system is designed to reward responsible financial behavior while offering access to curated financial tools and premium benefits.
How Does CRED Earn?
CRED’s business model is designed to generate revenue from multiple sources. While the app is free for users, its monetization comes from options like:
Financial services
Brand partnerships
Platform-based tools
Others
If we dig in deeper, then here are the detailed revenue streams that CRED operates on:
1. Lending and Interest-Based Products
CRED earns revenue through CRED Cash, which offers short-term credit to users. It also facilitates peer-to-peer lending through CRED Mint, taking a service fee on interest earned.
2. Transaction and Processing Fees
Through features like RentPay, CRED allows users to pay rent using credit cards. A small convenience fee is charged on each transaction. Similarly, CRED Pay earns a merchant commission per successful order.
3. Brand Collaborations and Sponsored Content
Brands listed on the CRED Store pay for visibility through listing fees or commission on sales. Sponsored offers and reward placements also generate ad revenue.
4. Subscription Revenue from Businesses
After acquiring Happay, CRED now earns revenue by providing corporate expense management solutions for enterprises.
These revenue streams together fuel CRED’s long-term monetization strategy.
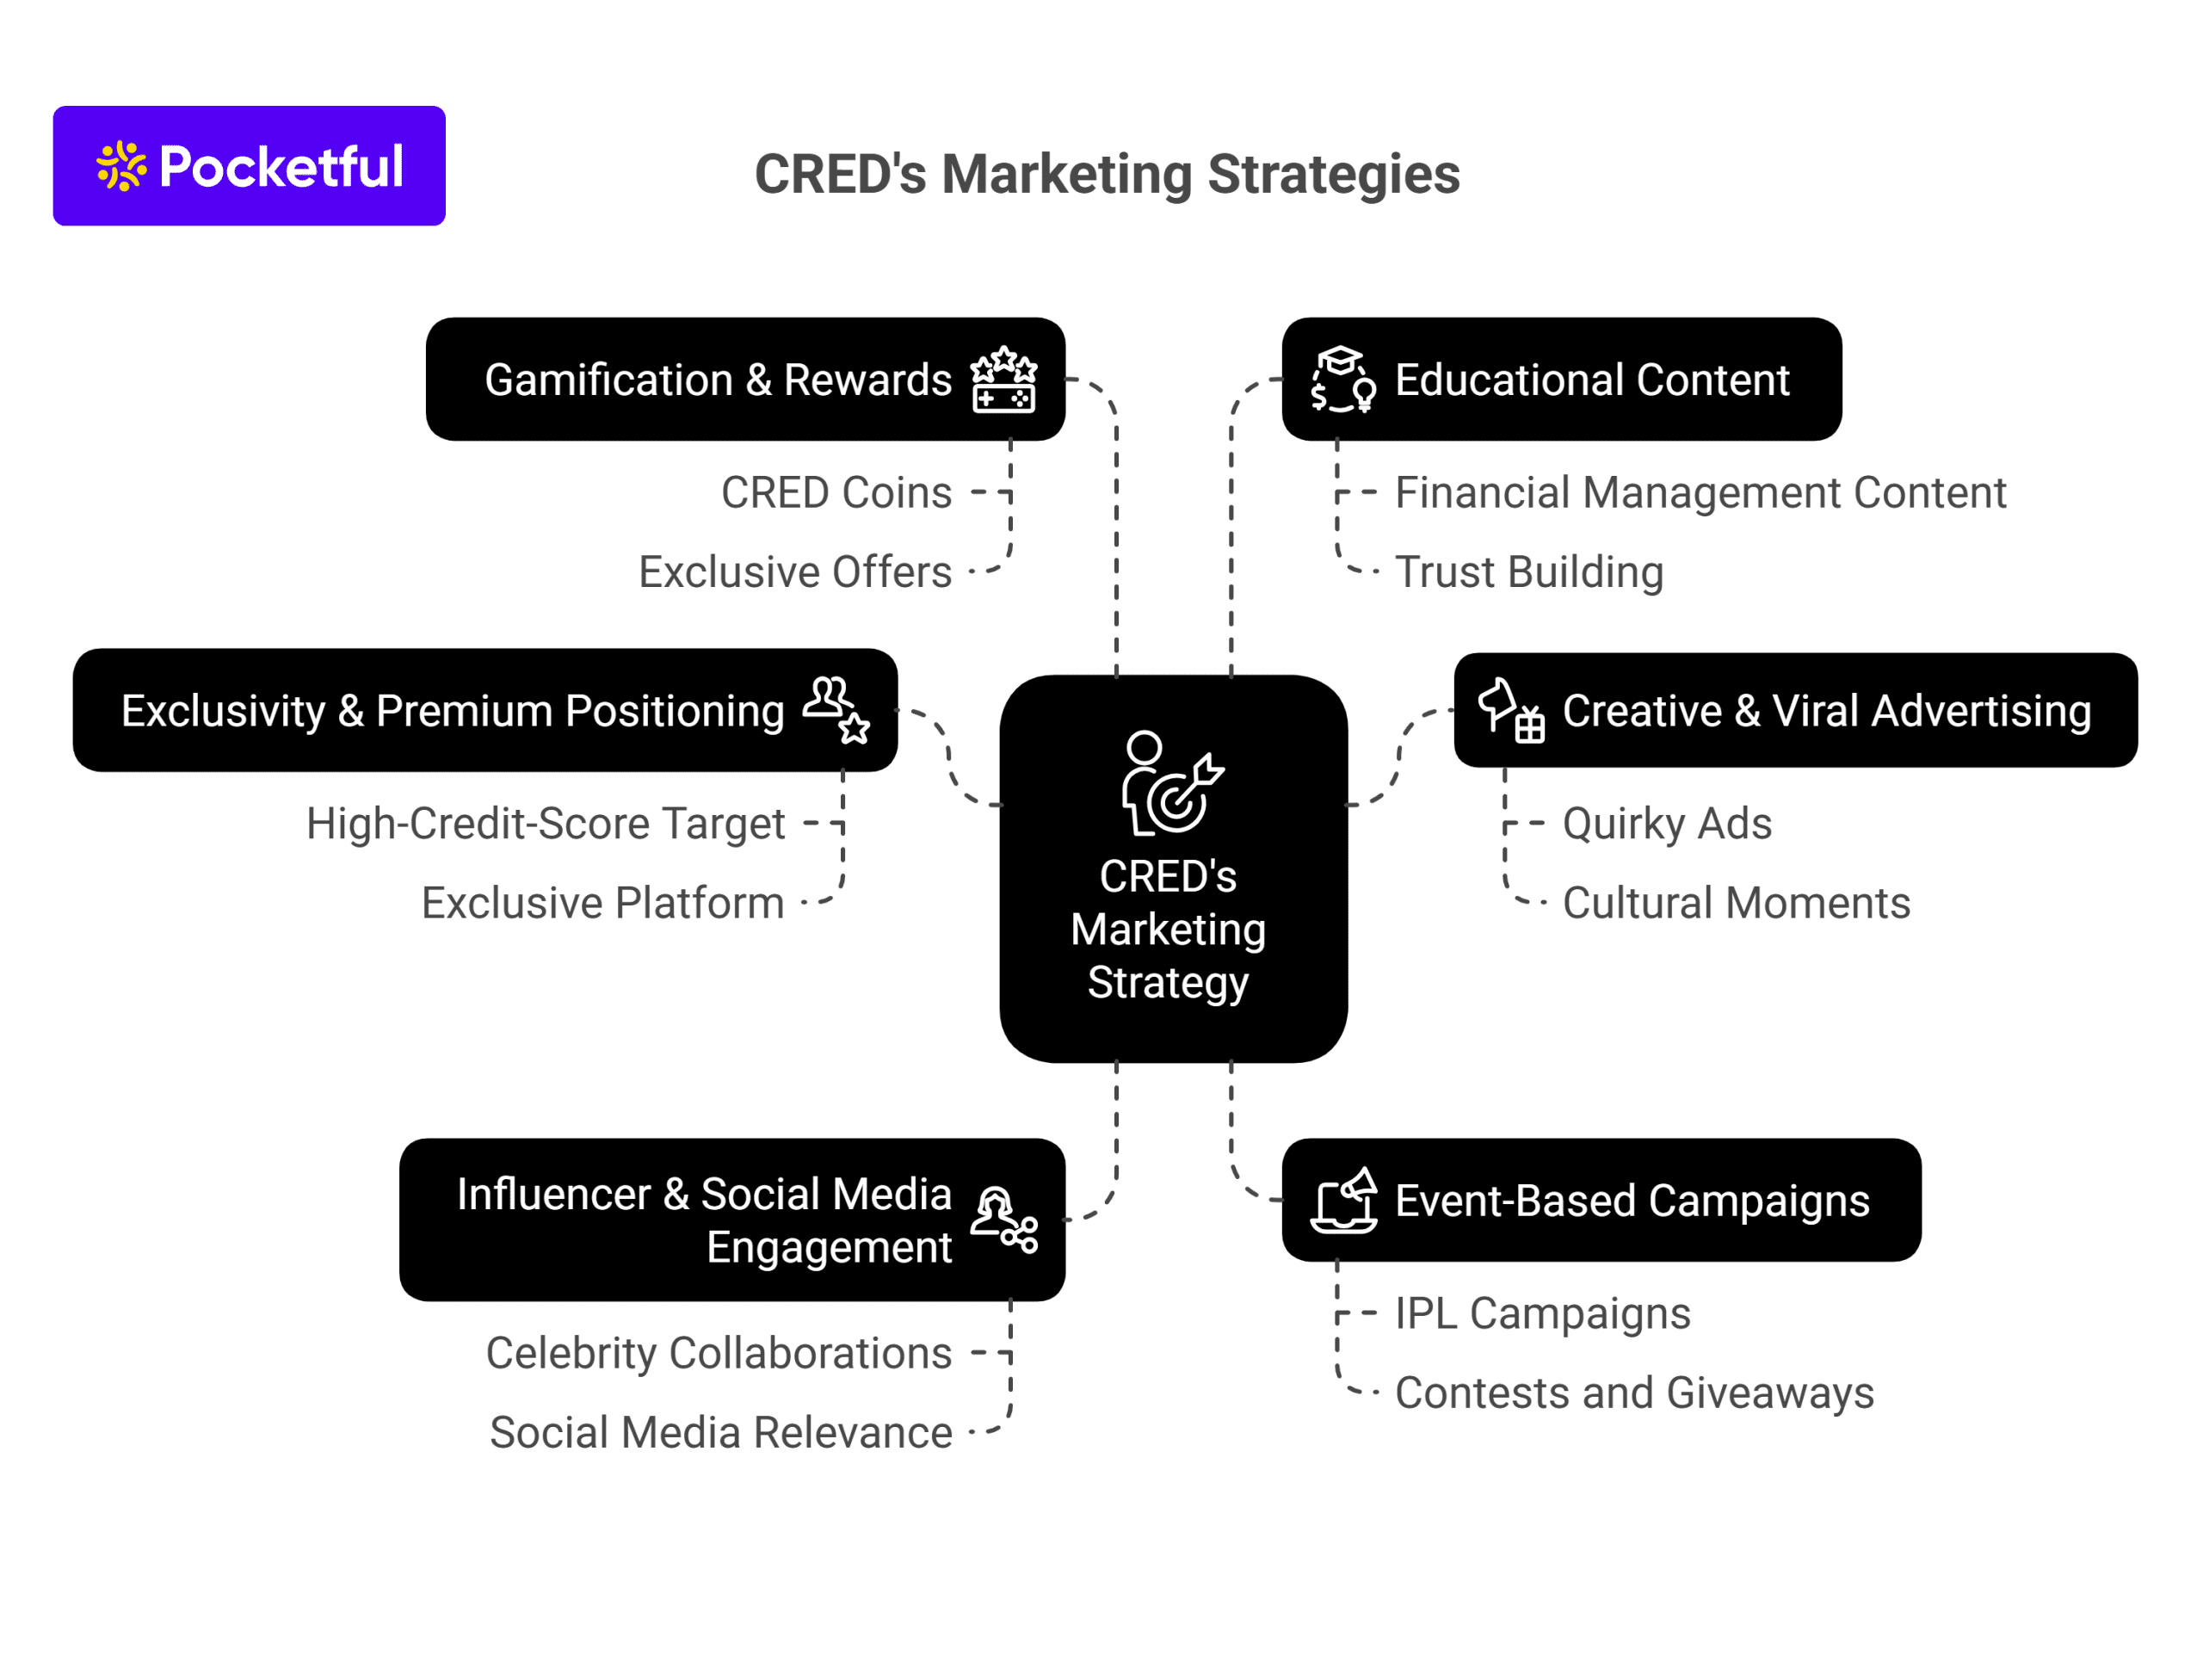
CRED aims to position itself as not just a fintech platform, but one that helps people maintain good credit discipline. This is one of the reasons that its marketing strategies focus on keeping messaging simple, engaging, and interactive. Some of the notable marketing strategies of CRED are as follows:
1. Exclusivity & Premium Positioning
CRED targets high-credit-score individuals. It positions itself as an exclusive, aspirational platform. The brand’s slogan is “Not Everyone Gets It.” This reinforces a sense of privilege, making membership feel special and desirable.
2. Creative & Viral Advertising
The advertisements or creatives are mostly quirky. These ads are designed to entertain, spark conversation, and become cultural moments. This helps the brand stand out in a crowded fintech market. Additionally, it enables people to connect with the brand.
3. Influencer & Social Media Engagement
The brand collabs with celebrities, comedians, and influencers to amplify reach and credibility. Witty, on-trend content on platforms like Instagram, Twitter, and YouTube helps the CRED stay relevant among its user base.
4. Event-Based Campaigns
CRED runs major promotional campaigns. This is mainly during high-visibility events like the IPL. It uses contests and giveaways to drive user engagement and app downloads.
5. Gamification & Rewards
The CRED Coins rewards program incentivizes users to pay credit card bills through the app. This empowers repeated usage and loyalty with exclusive offers at times.
6. Educational Content
CRED also educates its niche audience about financial management through engaging content. This builds trust and positions CRED as a leader in personal finance applications.
Here are some notable advertisements by CRED that captured audience attention greatly.
Rahul Dravid – “Indiranagar ka Gunda” (IPL 2021)
This ad became a cultural phenomenon. It featured the usually calm cricketer Rahul Dravid losing his temper in traffic and declaring himself “Indiranagar ka Gunda.” This unexpected portrayal instantly went viral, sparking widespread discussion on social media.
Bollywood Auditions (2020)
This was an ad featuring celebrities like Anil Kapoor, Madhuri Dixit, and Govinda. All of them were auditioning for a CRED commercial. The theme was poking fun at themselves and the idea of celebrity endorsements. The self-deprecating humor and unexpected scenarios resonated with viewers. This helps in setting CRED apart from conventional fintech advertising.
CRED’s monthly active user (MAU) base reached 13 million in November 2022. It has maintained a steady customer base of 13 million for 16 consecutive months, up to early 2024.
By FY24, some reports estimated the total user base at 16 million. This reflects a year-on-year growth of about 58%. However, new user growth has remained stagnant for a while now.
The average monthly transacting user performs around 20 sessions per month.
CRED’s share in UPI transaction volume doubled from 0.5% to 1% between April 2023 and March 2024. Its share by value increased from 1.5% to 2.3% in the same period.
As of March 2025, CRED processed 144 million UPI transactions. These transactions are worth ₹55,000 crore. It is now ranking seventh in UPI transaction volume in India.
Financial Performance
Revenue rose sharply from ₹422 crore in FY22 to approximately ₹1,500 crore in FY23. It further increased to ₹2,473 crore in FY24.
Operating losses went from ₹1,024 crore in FY23 to ₹609 crore in FY24. This was mainly due to reduced marketing and customer acquisition costs.
Net losses increased modestly, from ₹1,347 crore in FY23 to ₹1,644 crore in FY24.
CRED reduced its customer acquisition cost by approximately 80% over 4 years. It also achieved a 27% reduction in marketing expenses in FY23.
Cash reserves stood at around ₹2,050 crore in FY23. This provides a runway for continued operations and growth.
Other Key Metrics
The average value of UPI transactions on CRED declined from ₹13,000 in January 2022 to ₹3,400 in March 2024. This is mainly due to the platform diversifying into smaller merchant and utility payments.
CRED’s product expansion has increased cross-selling opportunities, although the core user base remains stable.
Major Achievements of CRED
CRED has been able to stand out due to its persistent efforts and strategic approach. Some of the major achievements of CRED that you must know are as follows:
Rapid Revenue Growth: CRED’s revenue surged by 66% to ₹2,473 crore in FY24. It is estimated to reach around ₹3,000 crore in FY25, reflecting strong financial momentum.
Large and Engaged User Base: By June 2024, CRED reported 13 million monthly active users and processed 144 million UPI transactions worth ₹55,000 crore in March 2025. This makes it the seventh-largest UPI payment app in India.
Product Diversification: CRED evolved from a credit card bill payment platform into a financial super app. It is now offering UPI payments, utility billing, vehicle management, travel, wealth management, and loans against mutual funds.
Strategic Acquisitions: The company expanded its portfolio by acquiring platforms like Happay (expense management), CreditVidya (lending), Spenny (investments), and Kuvera (wealth management).
Strong Funding and Valuation Milestones: CRED became a unicorn within three years. It has raised over $1 billion from global investors. Also, despite a recent valuation reset to $3.5–$4 billion, it remains one of India’s most valuable fintech startups.
Now that you have all the basic details for CRED, let us complete a detailed SWOT analysis for better understanding. So, here are the things that you must know:
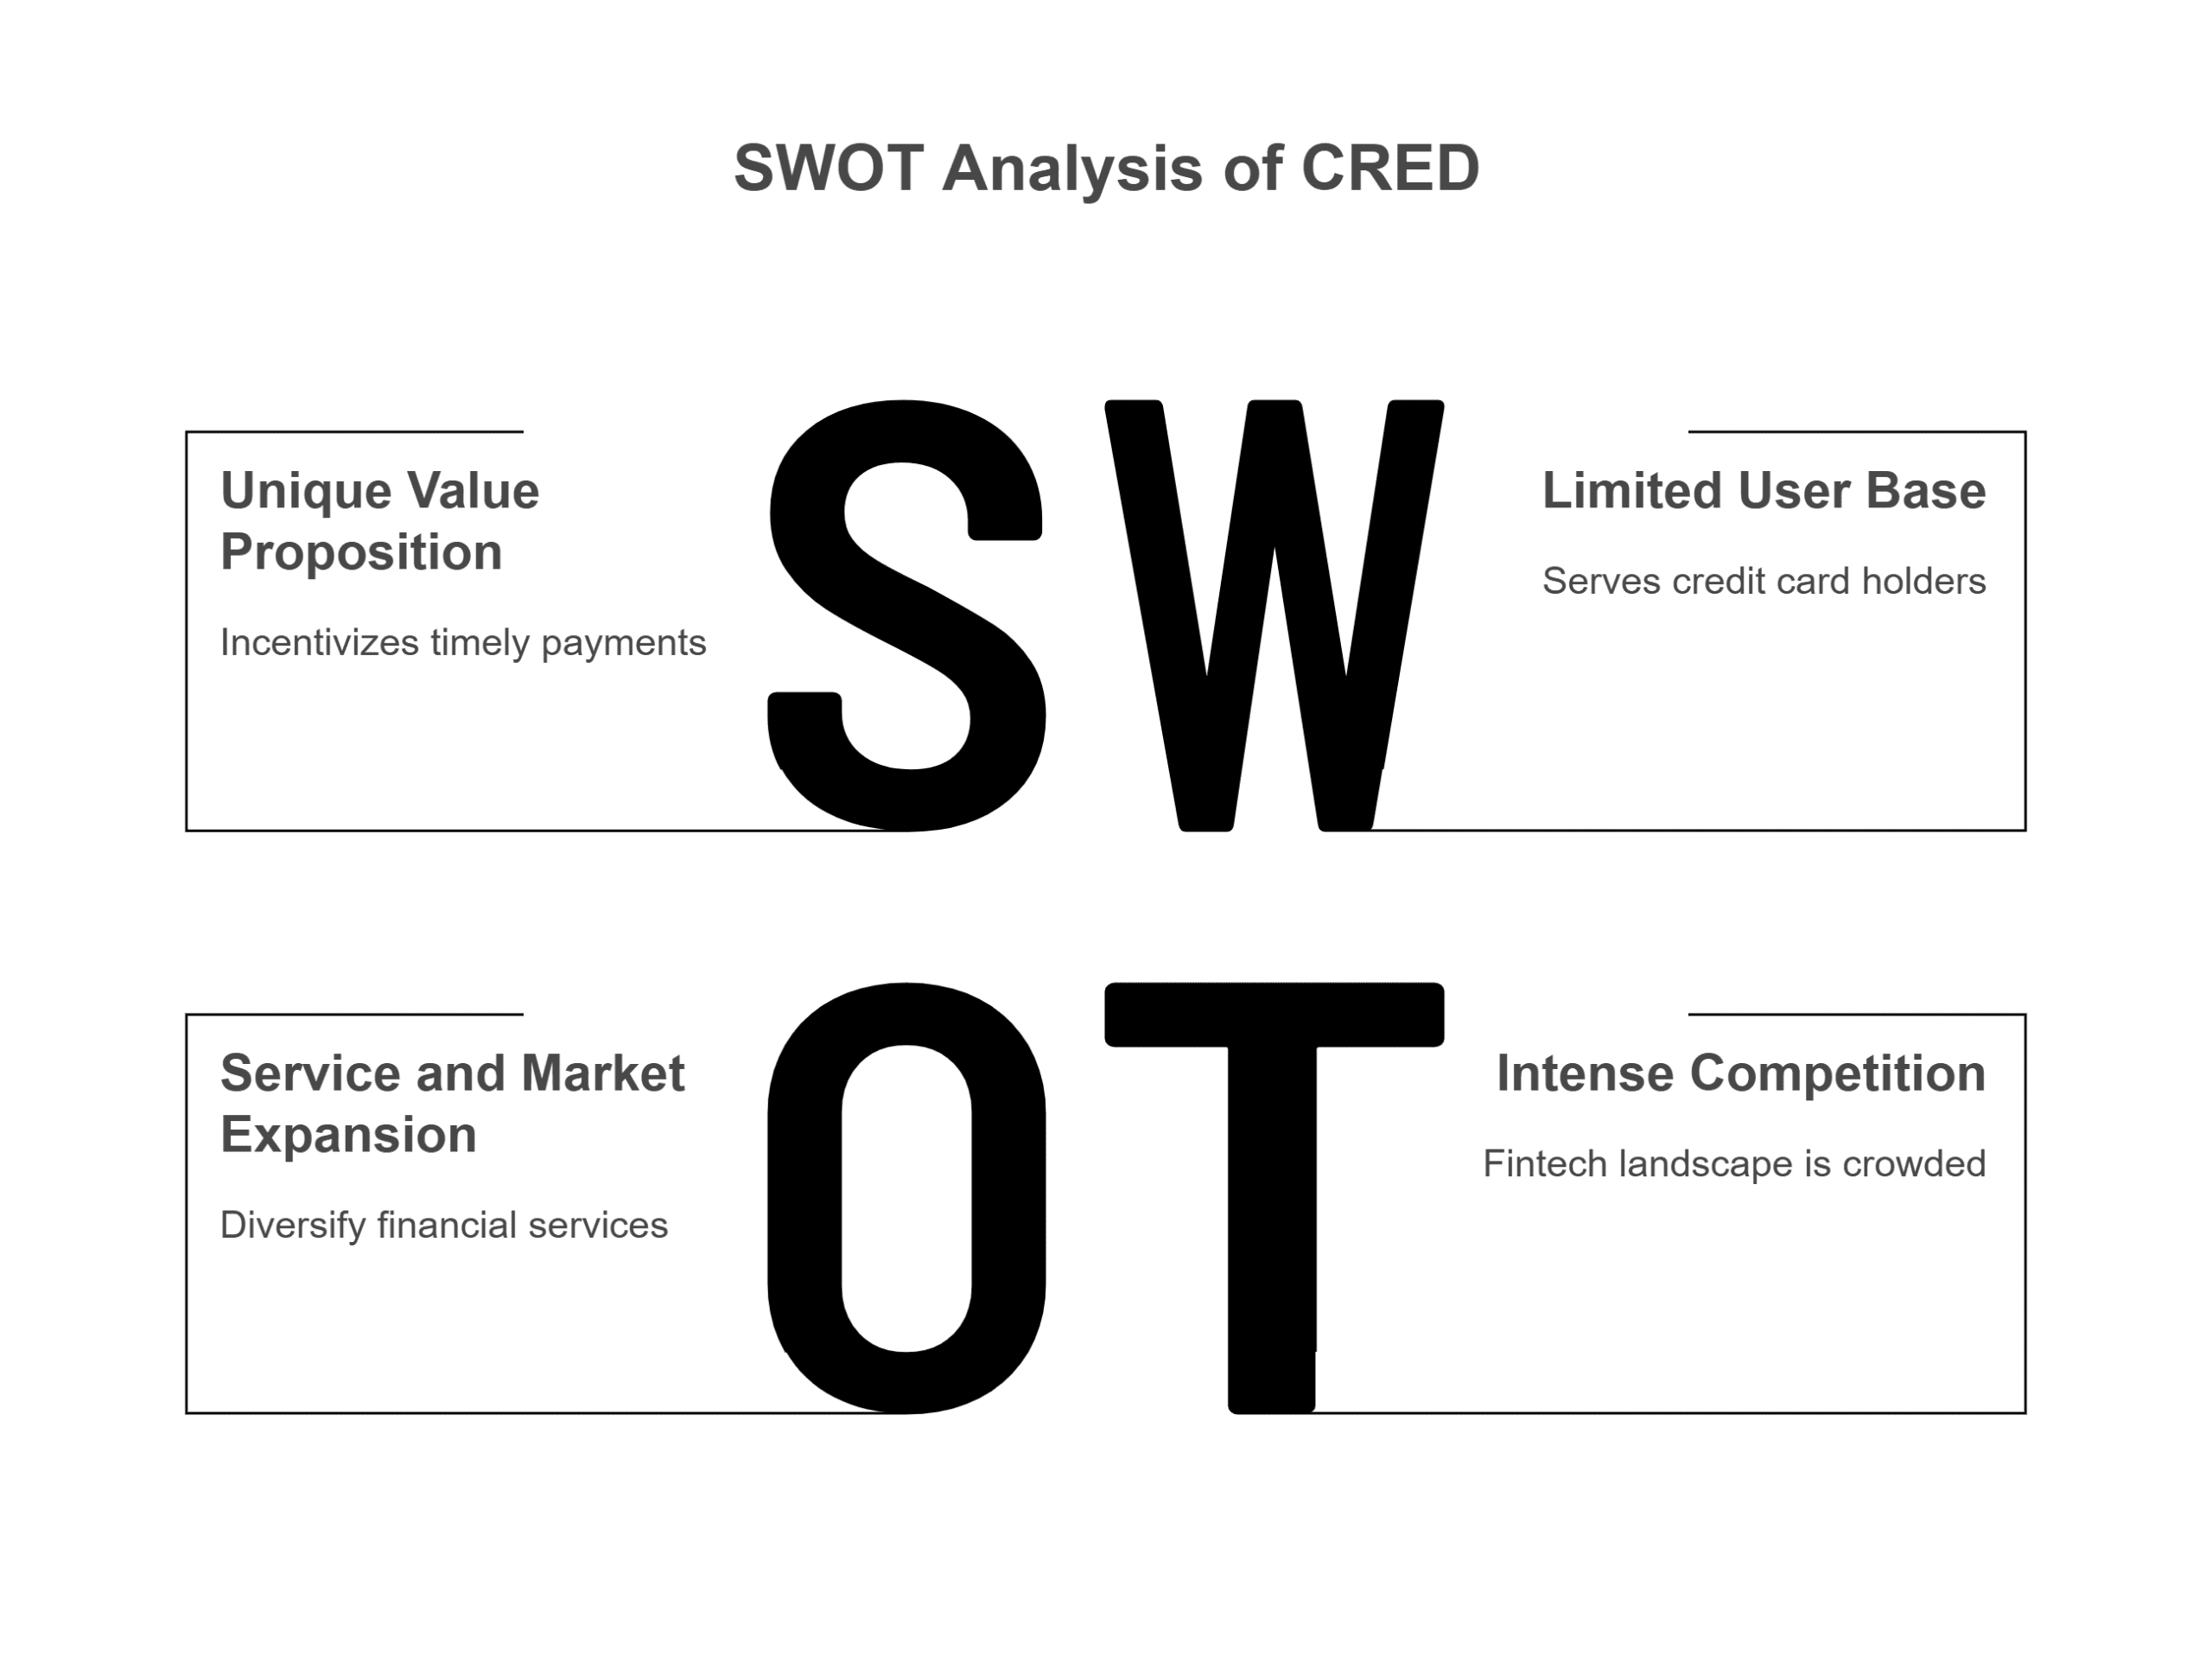
Strengths
Unique value proposition: CRED incentivizes timely credit card bill payments with rewards. This fosters financial discipline and strong user engagement through gamification and exclusive offers.
Strong brand identity and reputation: CRED is a premium and aspirational brand and is recognized for its innovative marketing strategies. It has created partnerships with leading brands.
Loyal and affluent user base: The platform attracts high-credit-score users. This makes it appealing for premium partnerships and targeted financial products.
Weaknesses
Limited user base: CRED primarily serves credit card holders. This excludes a large segment of the Indian population that doesn’t use credit cards.
High dependence on rewards: User engagement is heavily tied to the attractiveness of rewards. So, if these diminish, user retention could suffer.
Profitability challenges: Despite strong revenue growth, CRED remains loss-making, with high operational and marketing costs.
Opportunities
Service and market expansion: CRED can diversify into personal loans, insurance, investments, and target non-credit card users (e.g., UPI, debit card holders).
Data-driven personalization: Leveraging big data analytics and AI can enhance user experience and retention.
Partnershipsandinternationalexpansion: It can collaborate with e-commerce platforms and explore new geographies, unlocking new growth avenues.
Threats
Intense competition: The fintech landscape is crowded, with new entrants and established players constantly trying to increase their market share.
Regulatory risks: Changes in digital payments or credit card regulations could impact operations and growth.
User fatigue: Over-reliance on rewards and gamification can lead to declining engagement as the novelty wears off.
CRED has transformed how creditworthy users manage their finances in India. By blending design, exclusivity, and financial tools, it has built a brand that feels aspirational yet useful. Its journey from bill payments to a full-fledged fintech platform reflects smart product offerings and bold marketing.
While profitability remains a challenge, strong revenue growth and product expansion indicate long-term promise. With IPO plans ahead, CRED’s next phase will test its ability to scale sustainably. Its story offers a clear example of how user trust, community, and consistency can shape success in the fintech space.
S.NO.
Check Out These Interesting Posts You Might Enjoy!
CRED is a fintech company that rewards users for paying credit card bills and offers lending, investment, and premium financial services.
Who can join CRED?
Only users with a credit score above 750 can join CRED, making it an exclusive platform for financially responsible individuals.
How does CRED make money?
CRED earns from lending, transaction fees, brand listings, financial product commissions, and B2B services.
Is CRED profitable?
Not yet. CRED has reduced losses and increased revenue. Yet, it is still working toward long-term profitability and financial stability.
What makes CRED different from other fintech apps?
CRED offers exclusive rewards and financial tools to users with high-credit scores, thereby promoting responsible financial behavior, making it different from other apps that promote discretionary spending.
Haldirams is India’s most popular snack brand today, which started in Bikaner in 1937. Due to the traditional taste and quality, this brand gradually spread across the country and today it has made its mark at the international level as well.
In this case study, we will learn about Haldirams’ business model, marketing strategy and do financial analysis and SWOT analysis on how this brand achieved such a great position on its own.
Haldiram’s: An Overview
Haldirams started in 1937 from a small snacks shop in Bikaner, Rajasthan, founded by Ganga Bhishan Agarwal, fondly called ‘Haldiram Ji’. He introduced Bhujia with a unique taste and crunchiness, which soon became popular among the people.
Over time, Haldirams expanded its business and set up its production plants in cities like Kolkata, Nagpur, and Delhi. Today, the company is headquartered in Noida, Uttar Pradesh.
Haldirams has a product portfolio of over 400 items, including snacks, sweets, frozen foods, ready-to-eat meals, bakery items and beverages. Some of the major products are:
Aloo Bhujia, Moong Dal, Chana Chur
Gulab Jamun, Rasgulla, Sohan Papdi
Ready-to-Eat Curries, Biryani, Paratha
Cookies, Biscuits, Fruit Juices
The company has also taken its products internationally and today it exports its products to more than 100 countries, including the US, UK, UAE, Australia and Canada. Haldirams aims to take the Indian taste to the global audience. The secret of the company’s success lies in its quality, traditional taste and innovation. Haldirams has proved that if quality and consumer preference is taken care of in the product, then even a small business can become a global brand.
Haldirams has adapted its business model over time to suit the ever-changing needs of consumers. It is not just a brand, but the result of a well-planned strategy in which every step has been taken thoughtfully.
Product Diversity and Innovation: Haldirams has always maintained diversity in the product range. Along with traditional namkeen and mithai, the brand is now also focusing on bakery, instant meals, health snacks and other items. Products like millet-based and low-oil snacks have also been included in view of the demand of the health-conscious customers.
Distribution strength: Haldirams’ reach is not limited to just grocery stores. It now extends to malls, cafe style outlets, online marketplaces and airport food courts. The company has started reaching out to new consumers through its website and quick delivery platforms (such as Swiggy Instamart and Zepto).
Revenue Sources
FMCG Retail: Packaged snacks and sweets have high demand.
QSR and Dining: Haldirams also caters to its customers through its restaurants and outlets.
International Trade: The company now exports its products to 100+ countries.
Investments in Operations and Technology: Haldirams has set up modern factories in multiple locations with automated production lines, food safety protocols and IoT-based quality tracking. Along with this, the company is starting a new plant in Bihta, Bihar to meet the demand of Eastern India.
Franchise Model and Global Mindset: The company’s expansion model is completely based on B2B and franchise partnerships, which makes it easy to enter new cities and countries at low-cost. Haldirams makes products according to local taste in each market, which allows it to take the taste of Indian snacks global.
Financial moves and brand value: In March 2025, Singapore-based Temasek agreed to buy nearly 10% of Haldiram’s for around $1 billion, putting the brand’s valuation close to $10 billion. It clearly shows how much international investors value and trust the Haldiram brand.
Haldirams’ business model is a powerful combination of traditional values and modern mindset, which has made it a household name not only in India but across the world.
Haldirams never relied on heavy ad campaigns. Their focus was always on letting the product speak, not promotions. But as the market changed, they adapted their strategy with the times without losing their original identity.
Low Cost Branding Campaigns: Initially, Haldirams relied more on in-store presence and word-of-mouth than TV advertising. Branded displays in stores, attractive packaging, and taste that speaks for itself — these were their first promotions. Their customer relationship was so strong that the brand spread on its own.
Smart Social Media approach: Now Haldirams is also quite active on social media, but not over-promotional. They share short reels, recipe ideas and creative content related to festivals on platforms like Instagram and YouTube. Their focus is on connecting with real people, not with flashy ads, but relatable stories.
Targeted campaigns and regional connect: They don’t run the same campaigns everywhere. In South India, their campaigns are localised and connect with their local customers. Their way of linking their product with the local culture during festivals is very natural and effective.
Direct connection with the customer: Haldirams responds to customer comments on social media, takes feedback and incorporates it in new products. Also, with offers like attractive discounts, buy-one-get-one and limited edition packs during festivals, they keep people engaged without trying to sell forcefully.
Haldirams’ marketing strategy is more relatable and down to earth than flashy or trendy. They not only maintain their product quality and taste, but also their place in people’s hearts and that’s their real win.
Financial Analysis of Haldiram
1. Financial Performance
Below is a summary of Haldirams’ financial performance:
Financial Metric
FY 2024
Revenue (₹ Crore)
12,800
Net Profit (₹ Crore)
1,400
FY 2024 metrics were widely reported and financial data of previous years is not publicly available as it is a private company.
2. Investment and expansion plans
Following Temasek’s investment, Alpha Wave Global and Abu Dhabi’s International Holding Company (IHC) have also invested in Haldirams. The investment will support the company’s expansion plans in international markets such as the US, Middle East and the UK.
3. Market position:
Haldirams holds around 13% of the Indian snacks market, making it a leader in the sector.
4. Future strategy
Merger of entities: The Delhi and Nagpur-based entities are being merged, which will bring uniformity in operations and increase the possibility of an IPO in the future.
IPO preparation: Haldirams may move towards a public listing in the near future, which is likely to raise capital and increase brand value.
New product segments: The company is also focusing on healthy snacks, millet-based foods and gluten-free products to keep pace with changing consumer trends.
Haldirams’ business model looks simple, but it is backed by a strong strategy and a keen understanding of the market. Below we will look at their strengths, where there is scope for improvement, and what they need to keep in mind going forward:
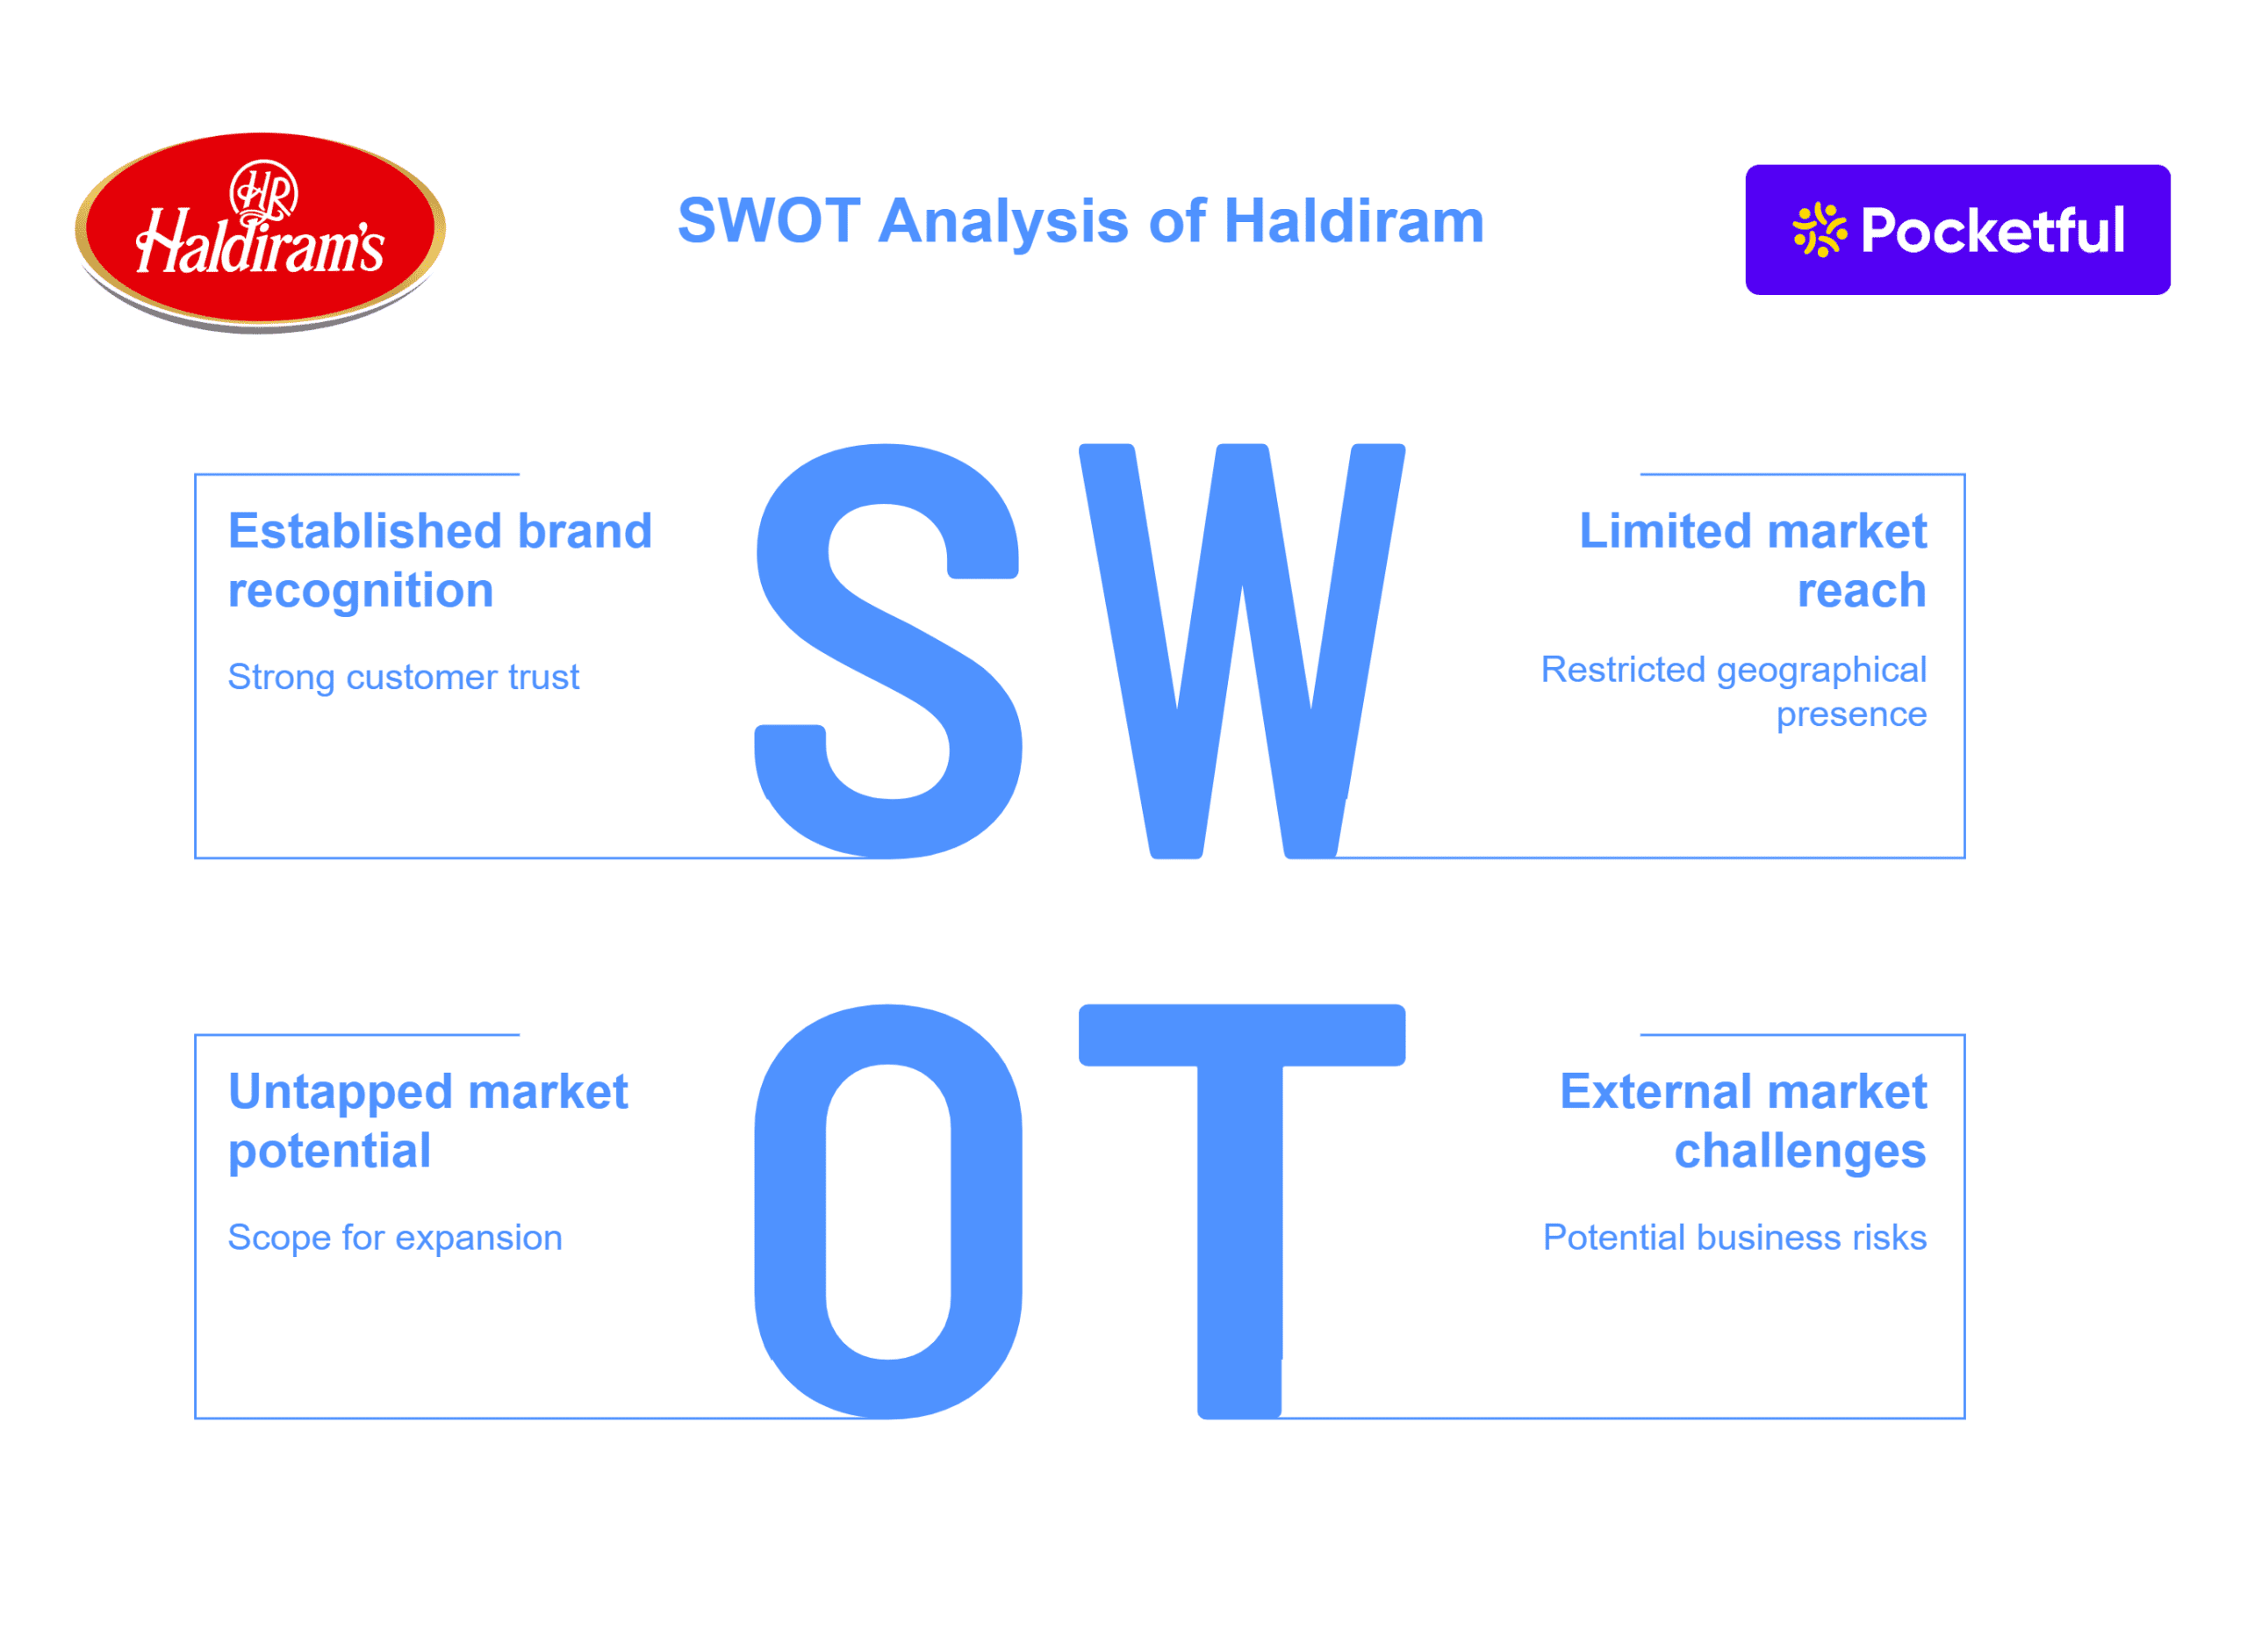
Strengths
Strong Brand Image: Haldirams’ name is associated with taste and trust. The brand value they have built over decades is their biggest strength today.
Diverse product range: From sweets to snacks, instant foods and healthy options – there is something for every age and taste.
Wide network: Haldiram’s products are easily available from big cities to small towns, and now even in the US and Europe.
Weaknesses
Low presence in South India: The company has a strong customer base in North and West India, but its reach in South India is still limited.
Low visibility in media: Haldirams’ marketing is still a little quiet. While other brands are running high-visibility campaigns, Haldirams mostly adopts a conservative approach.
Opportunities
Growing demand for healthy food: People are now moving towards healthy snacks and Haldiram’s can expand business operations rapidly in this category.
Expansion in foreign markets: There is a lot of demand for Indian snacks in foreign markets. If Haldirams launches some new variants according to the local taste preferences there, then there is a huge opportunity.
Threats
Growing competition: New brands are coming in the FMCG sector every year. Moreover, established players like Bikanervala, ITC, and Britannia are now competing directly with Haldiram.
Changing customer preferences: Today’s customers are not only looking for taste, but also health and innovation. Haldirams needs to experiment a little with its traditional image.
Haldirams has a strong customer base, but with time they need to work on their weak points and adopt new market trends. If they take the right decisions on healthy food, innovation and regional strategy in time, then they will remain on top of the Indian snack industry in the coming years.
The story of Haldirams is an inspiring journey from a small namkeen store to becoming a global brand. By combining traditional taste with modern packaging and innovative thinking, it has won the trust of crores of people in India and abroad. Its business model which includes a diversified product line, strong distribution and smart marketing makes its business operations sustainable. Even in the rapidly changing food industry, Haldirams has constantly upgraded itself, which proves its resilience and foresight.
S.NO.
Check Out These Interesting Posts You Might Enjoy!
Exchange Traded Funds (ETFs) are becoming increasingly popular in today’s time. These investment instruments trade like stocks but offer the diversification and transparency of mutual funds by tracking stock market indices. In 2025, the global ETF market attracted $2 trillion of new capital, which shows their credibility and demand.
In this blog, the features and benefits of ETFs are explained in a simple and detailed manner. Moreover, a comparison between ETF and other investment options is shown to better understand them.
What are Exchange Traded Funds (ETFs)?
ETFs or Exchange Traded Funds are an investment option that follows a stock market index such as Nifty 50 or Sensex. The most special thing about these funds is that they can be bought and sold in the market throughout the day just like shares. That is, unlike mutual funds, ETFs can be bought and sold throughout the trading day at real-time prices, without waiting for end-of-day NAV pricing.
What do ETFs invest in?
ETFs invest not just in stocks but also in many other asset classes, such as:
Equity: Stocks included in the index
Bonds: Government or corporate bonds
Commodities:Such as gold, silver, etc.
International: ETFs that invest in companies of foreign countries
Sector-focused: Such as technology, pharma, banking, etc.
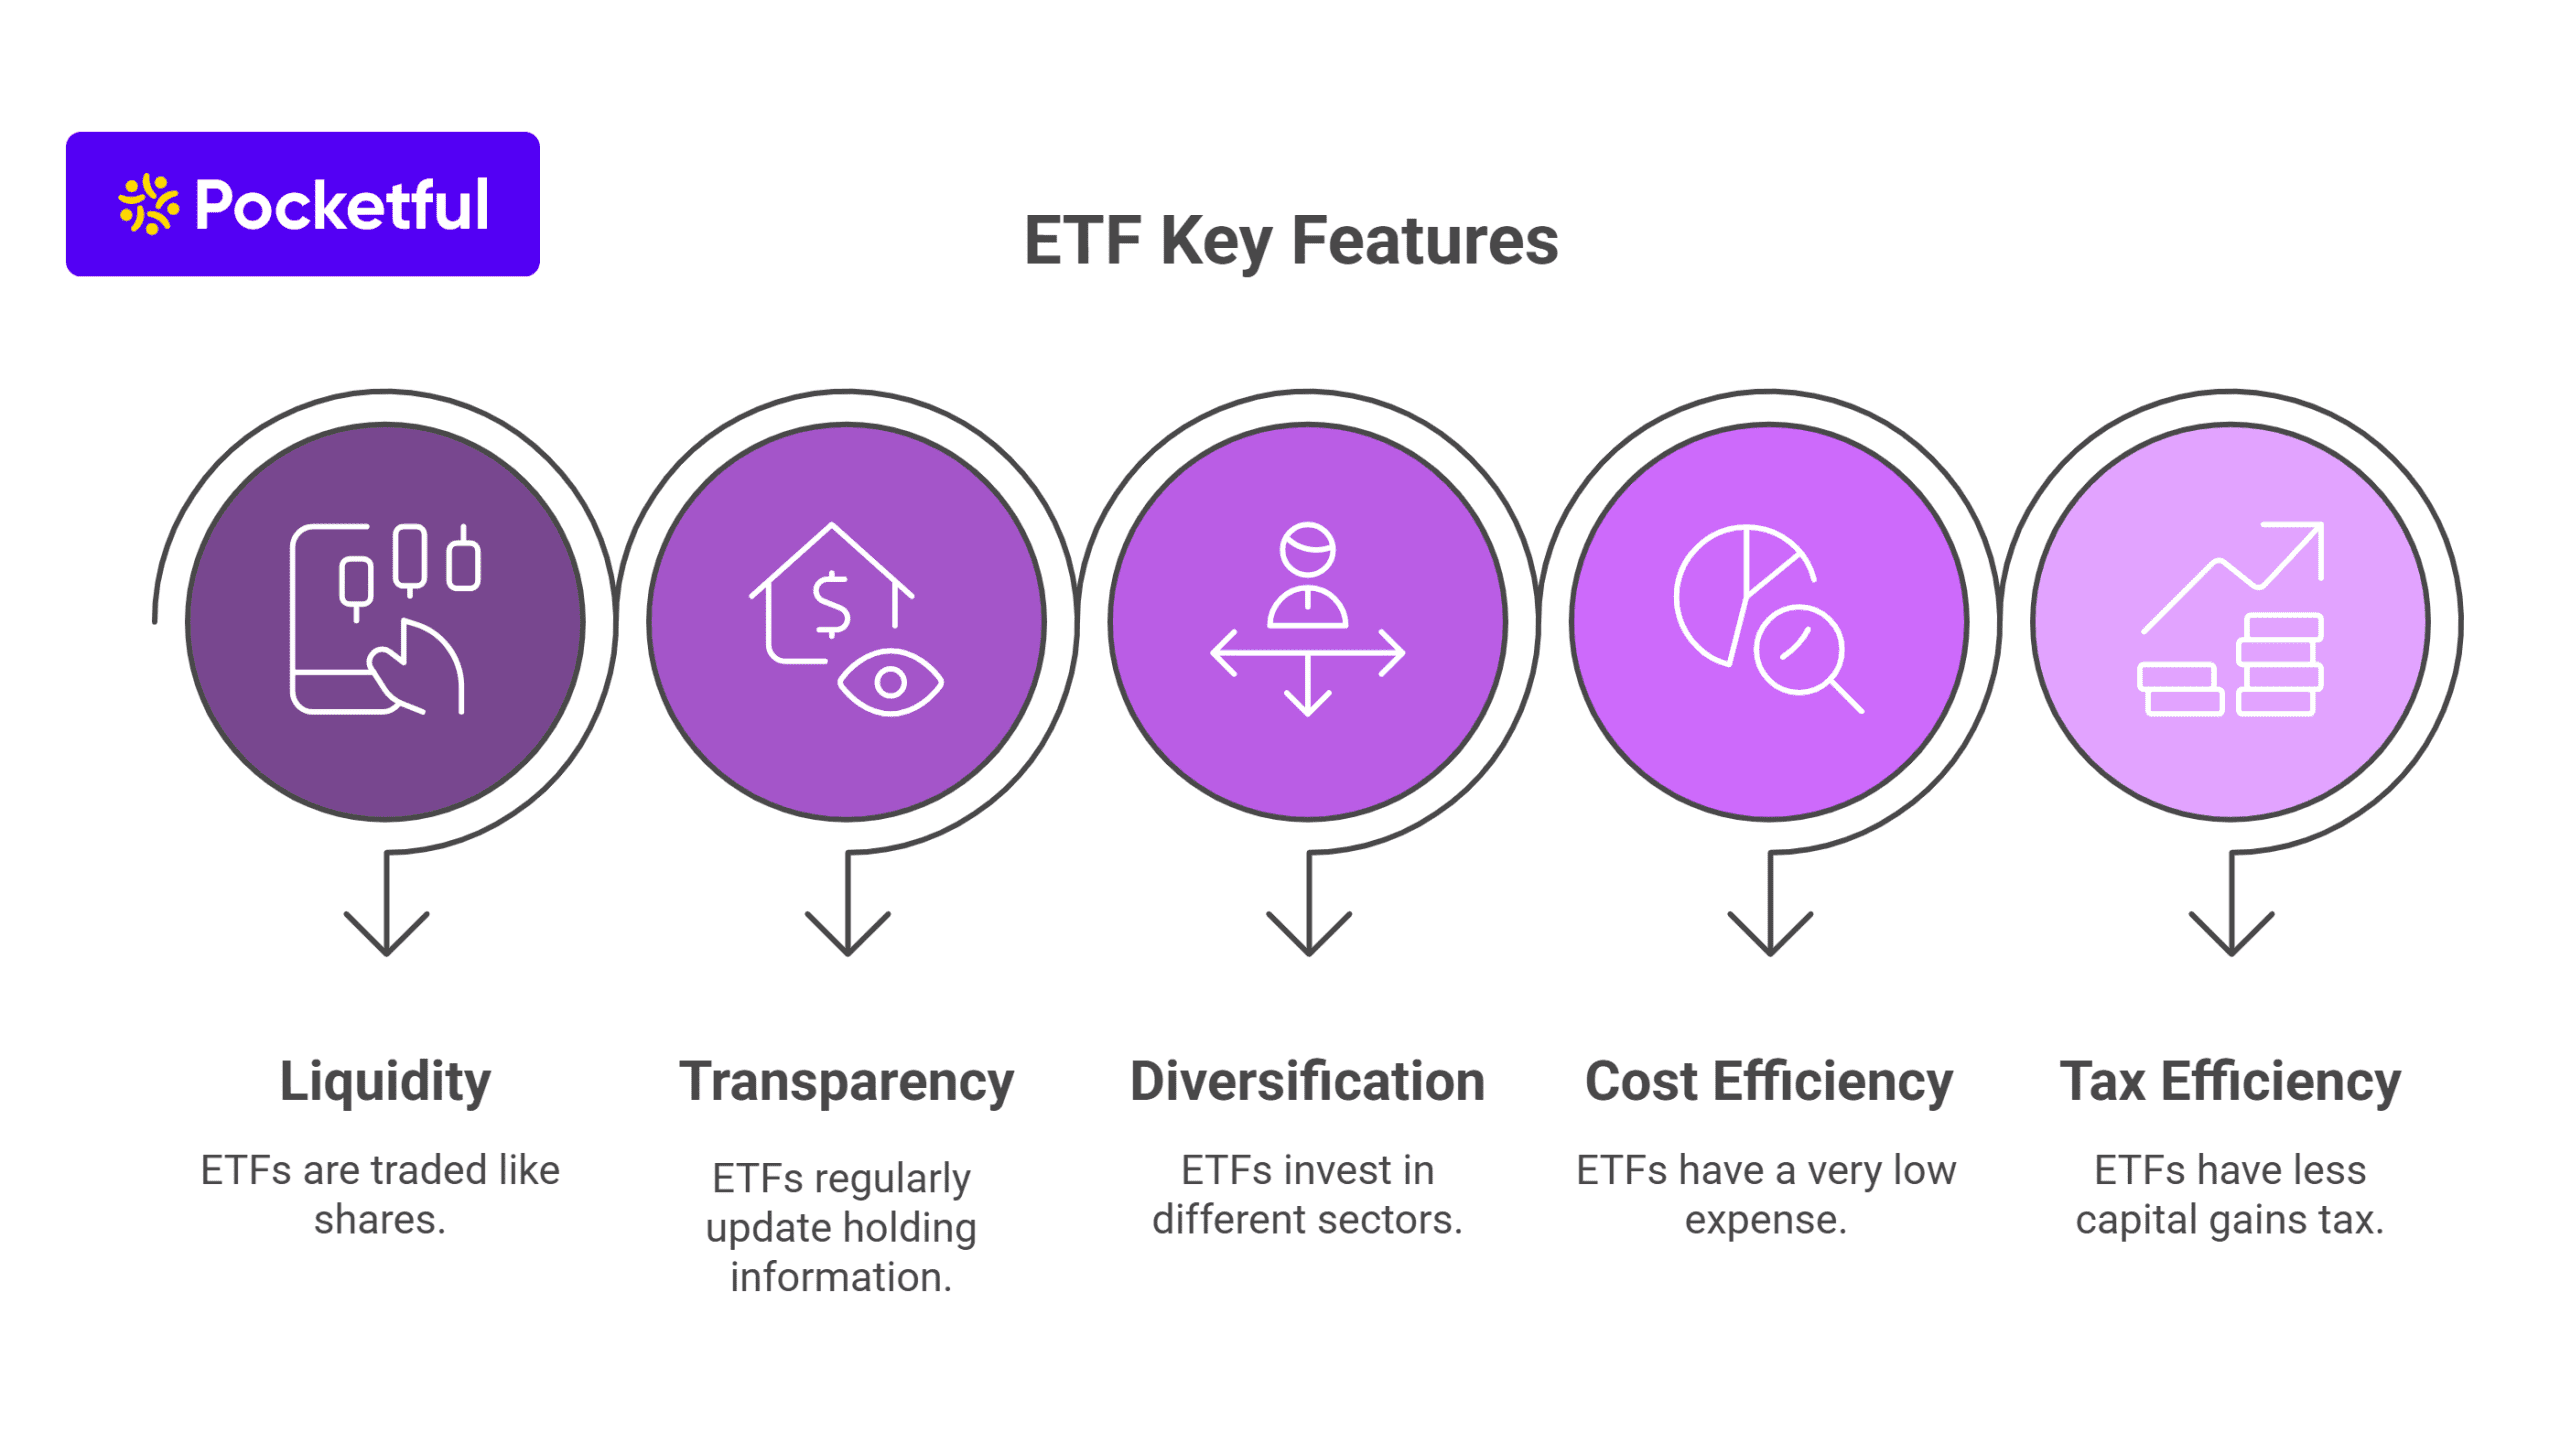
Some special features of ETFs (ETF Features)
Liquidity: Buy and sell whenever you want, like shares.
Transparency: ETFs provide their holding information and tracking error on a regular basis.
Low Cost: Fees are much lower than mutual funds.
Tax Efficiency: Better for tax planning.
Due to all these features, ETFs are becoming a smart, accessible and affordable option for investors these days. Be it a new investor or an experienced one, ETFs are proving to be useful for every investor profile.
Exchange Traded Funds (ETFs) are easy to understand, but they have some special features that make them different from other investment options.
Liquidity: ETFs can be bought or sold like shares throughout the trading hours. This means that when the market is open, investment or withdrawal in an ETF can be done at any time, that too at real-time price. This facility is not available in mutual funds.
Transparency: Most ETFs update their holding information on a regular basis. This helps the investor to know in which companies or assets his money has been invested.
Diversification : Investment can be made in different sectors, companies or asset classes through a single ETF. This distributes the risk and diversifies the portfolio.
Cost Efficiency: ETFs usually have a very low expense ratio because they passively follow the index, which results in reduced cost to the investor.
Tax Efficiency: ETFs are structured in such a way that the impact of capital gains tax is less. Especially when invested for a long time, the benefit of tax saving increases even more.
Benefits of Investing in ETFs
Exchange Traded Funds (ETFs) provide investors with an option that balances risk and also provides returns. Here are some reasons why ETFs are considered a smart investment choice today:
Flexibility: ETFs are traded just like stocks, which allows them to be used for intraday trading. This allows active investors to adopt multiple trading strategies.
Low Investment Threshold: Most ETFs do not require a large amount to start investing, which allows new and small investors to enter the market.
Variety of Choices : Today, there are sector-based, theme-based, international and bond-based ETFs, providing options for any investment goal.
Performance Tracking: The specialty of these funds is that they track the index or sector very closely, making the returns easily comparable.
Real-time pricing: The price of ETFs keeps changing throughout the trading hours, allowing for timely entry and exit.
Automatic risk diversification: An ETF invests in many stocks or assets, reducing the impact of a single company’s decline on the entire portfolio.
No entry or exit load: There are no entry or exit loads when investing in ETFs, making the investment process cost-efficient.
Better control and transparency: Since ETFs are listed on the stock exchange, investors are better informed about their holdings and market movements.
ETFs vs other Investment options: Which is better and when?
Exchange Traded Funds (ETFs) are often compared with mutual funds or other investment options. But each option has its own strengths and limitations. The table below gives a quick overview of their key features:
Feature/Aspect
ETFs
Mutual Funds
Fixed Deposits
Trading Flexibility
Trades like stocks throughout the day
Transact at end of day at NAV only
Lock-in and invested for a Fixed Period
Cost / Fees
Very low expense ratio
Relatively higher fees
No fund management charges
Transparency
Investors have a better idea of where their money has been invested as holdings information is published daily.
Holdings are published quarterly, which makes them less transparent.
Limited information is available as the bank lends your deposited amount.
Liquidity
High – can be bought/sold at any time
Moderate – redemption takes time
Low – Early withdrawal penalty
Market Exposure
Diversified index, sector, commodities, etc.
Based on the investment strategy mentioned in the fund documents
No direct link to the market
Considerations Before Investing in ETFs
Although ETFs have many benefits, it is important to understand a few key points before investing.
Effect of market volatility: ETFs are directly linked to the stock market, so their prices can also go down rapidly when the market falls.
Possibility of tracking error: Sometimes the return of an ETF does not match the index it is following. This is called tracking error.
Understand the investment strategy: Before investing, it is important to know in which assets or sectors the ETF is investing.
Research and clarity are important: Before investing in an ETF, conduct your own research to select the best fund for your portfolio.
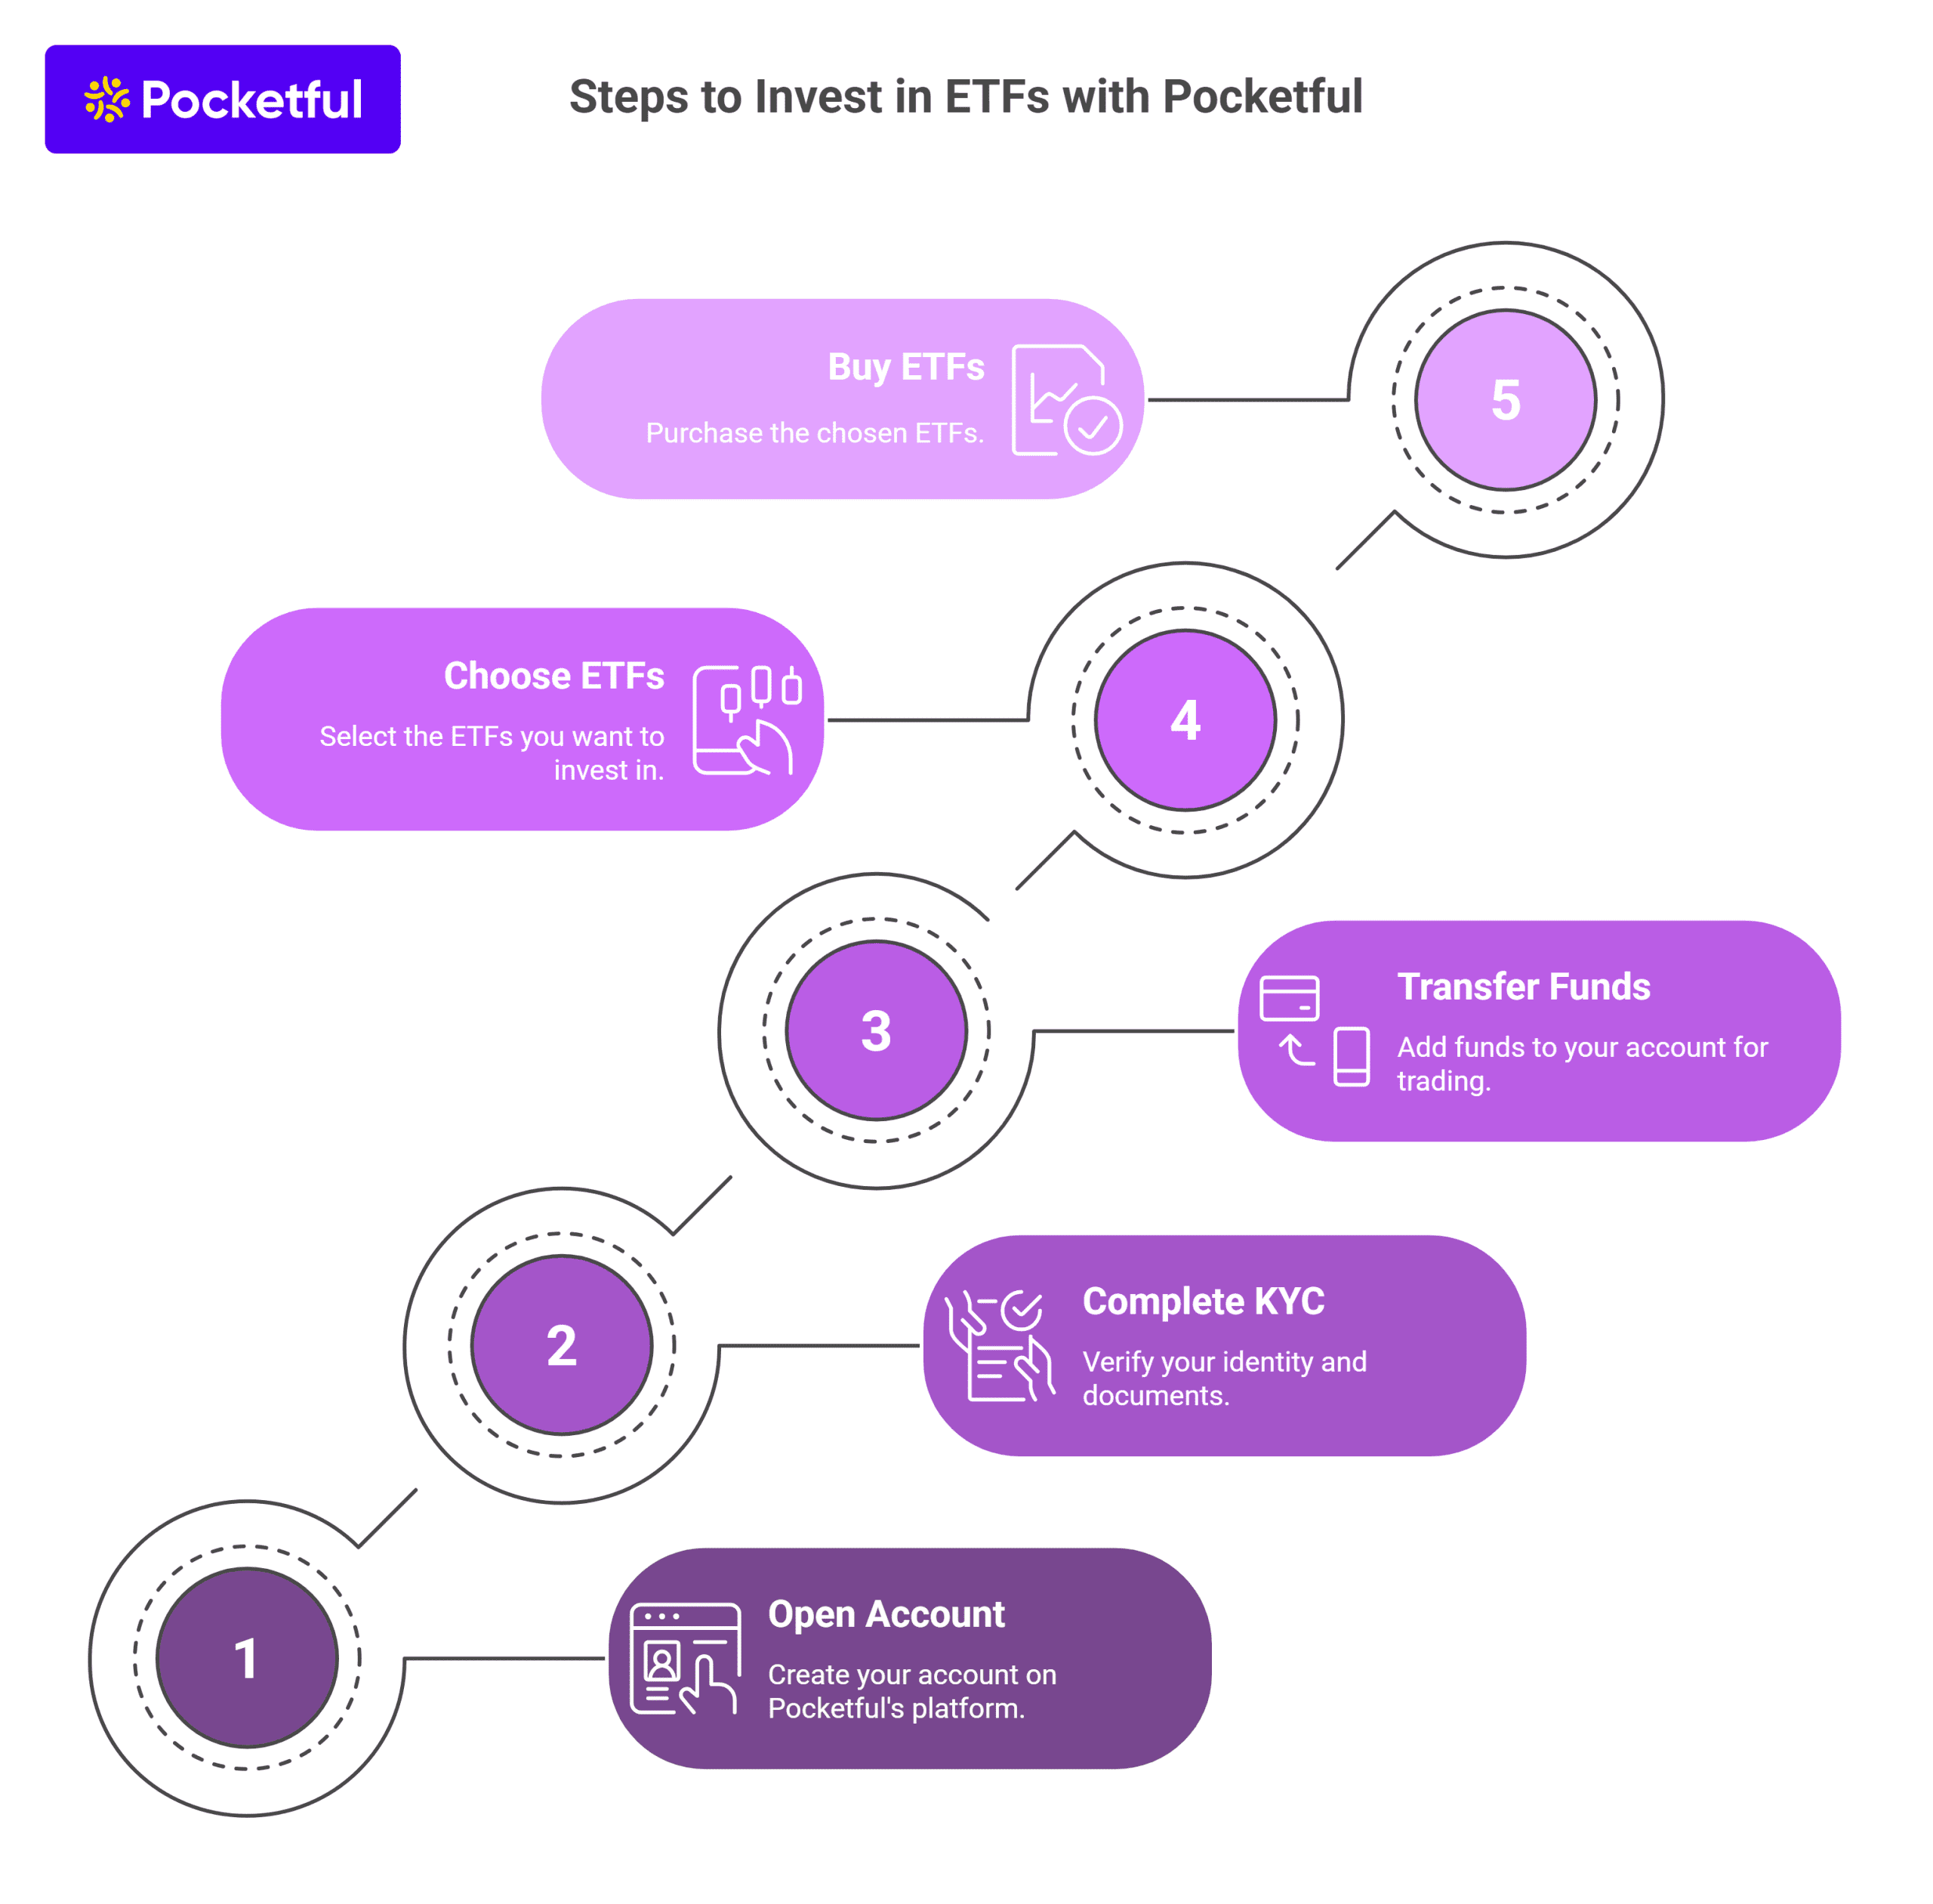
How to Invest in ETFs Step-by-Step with Pocketful?
You can easily invest in ETFs with Pocketful by following the steps mentioned below:
ETFs are an easy, flexible and affordable option for investment. They are traded in the stock market, allowing real-time buying and selling. ETFs have low cost and offer transparency and diversification, which helps in reducing risk. For any investor, whether new or experienced, adding ETFs to their portfolio can be a wise move. For a better decision, one should include ETFs in their investment portfolio after consulting an expert or doing thorough research on their own.
S.NO.
Check Out These Interesting Posts You Might Enjoy!
In the world of financial markets, there are various investment options available. If an investor is looking to diversify their portfolio and has a limited amount of capital, they can consider investing in ETFs or Exchange Traded Funds. They are passively managed funds offered by various AMCs. But do you know which ETFs have been top performers in recent years?
In this blog, we will give you an overview of the top 10 ETFs in India, along with the factors to consider before investing in them.
What is an ETF?
An ETF or Exchange Traded Fund is a passive investment tool that predominantly invests the capital in a basket of stocks, commodities, etc. ETFs are generally traded on the stock exchange like any other ordinary stock; therefore, to buy and sell ETFs, you are required to have a demat and trading account.
List of Best ETFs in India
The following are the best ETF to invest in 2026:
ETF Name
Symbol
5-Year Return
Kotak NV 20 ETF
KOTAKNV20
203.26%
Kotak Nifty Bank ETF
BANKNIFTY1
196.54%
SBI NIFTY NEXT 50 ETF
SETFNN50
186.79%
Nippon India ETF Junior BeES
JUNIORBEES
184.70%
Bandhan NIFTY ETF
IDFNIFTYET
181.53%
Quantum Nifty ETF
QNIFTY
180%
Motilal Oswal M50 ETF
MOM50
175.04%
Invesco India NIFTY ETF
IVZINNIFTY
171.90%
SBI NIFTY 50 ETF
SETFNIF50
167.28%
Invesco India Gold ETF
IVZINGOLD
95.16%
(Data as of 15th May 2025)
Overview of the Best ETFs in India
An overview of the top ETFs in India is as follows:
1. Kotak NV 20 ETF
This ETF invests in Nifty 50 Value 20 index stocks. These stocks represent companies with strong fundamentals and attractive valuations. It primarily tracks share prices of 20 companies with low PE, low PB and high dividend yield. It is managed by Kotak AMC.
2. Kotak Nifty Bank ETF
This ETF, launched by Kotak Mutual Fund, tracks the Bank Nifty index and provides investors with an exposure to the top 12 banking stocks. Investors who wish to make a tactical allocation in the banking industry can opt to invest in Kotak Nifty Bank ETF.
3. SBI Nifty Next 50 ETF
The SBI Nifty Next 50 ETF was launched by SBI Mutual Fund and tracks the Nifty Next 50 Index. It is also a good investment option for investors who want to participate in the growth of the next 50 companies.
4. Nippon India ETF Junior BeES
This ETF primarily invests in the Nifty Next 50 Index, or the next 50 companies after Nifty 50 companies by market capitalisation. The stocks in which this ETF invests belong to the large and mid-cap segments. They are managed and operated by Nippon AMC and are suitable for investors seeking growth.
5. Bandhan Nifty ETF
The Bandhan Nifty ETF also invests in Nifty 50 stocks. Earlier, it was launched by IDFC mutual fund, which was later taken over by Bandhan AMC. Therefore it is known as Bandhan Nifty ETF.
6. Quantum Nifty ETF
This ETF, launched by Quantum AMC, tracks the Nifty 50 Index and offers similar exposure to large-cap stocks of India as specified by the Nifty 50 index. It is another ETF that invests in the Nifty 50 index that has generated substantial returns in the recent past.
7. Motilal Oswal M50 ETF
For investors who wish to invest in the Nifty 50 index ETF, Motilal Oswal M50 is another option as it offers exposure to the top 50 companies of India. This ETF has also given tremendous returns over the past 5 years.
8. Invesco India Nifty ETF
This ETF is managed by Invesco India Asset Management Company. It primarily invests in the top 50 companies listed on the National Stock Exchange based on market capitalisation. Those 50 companies have exhibited strong performance over many years.
9. SBI Nifty 50 ETF
As the name indicates SBI Nifty 50 ETF tracks the Nifty 50 Index and is managed by SBI. It is highly liquid in nature and is often used as an investment option by EPFO and other institutional investors.
10. Invesco India Gold ETF:
This ETF tracks the domestic price of Gold and allows the investor exposure to Gold digitally. It is also known as commodity ETF, and can be used as a hedge against inflation and currency fluctuations.
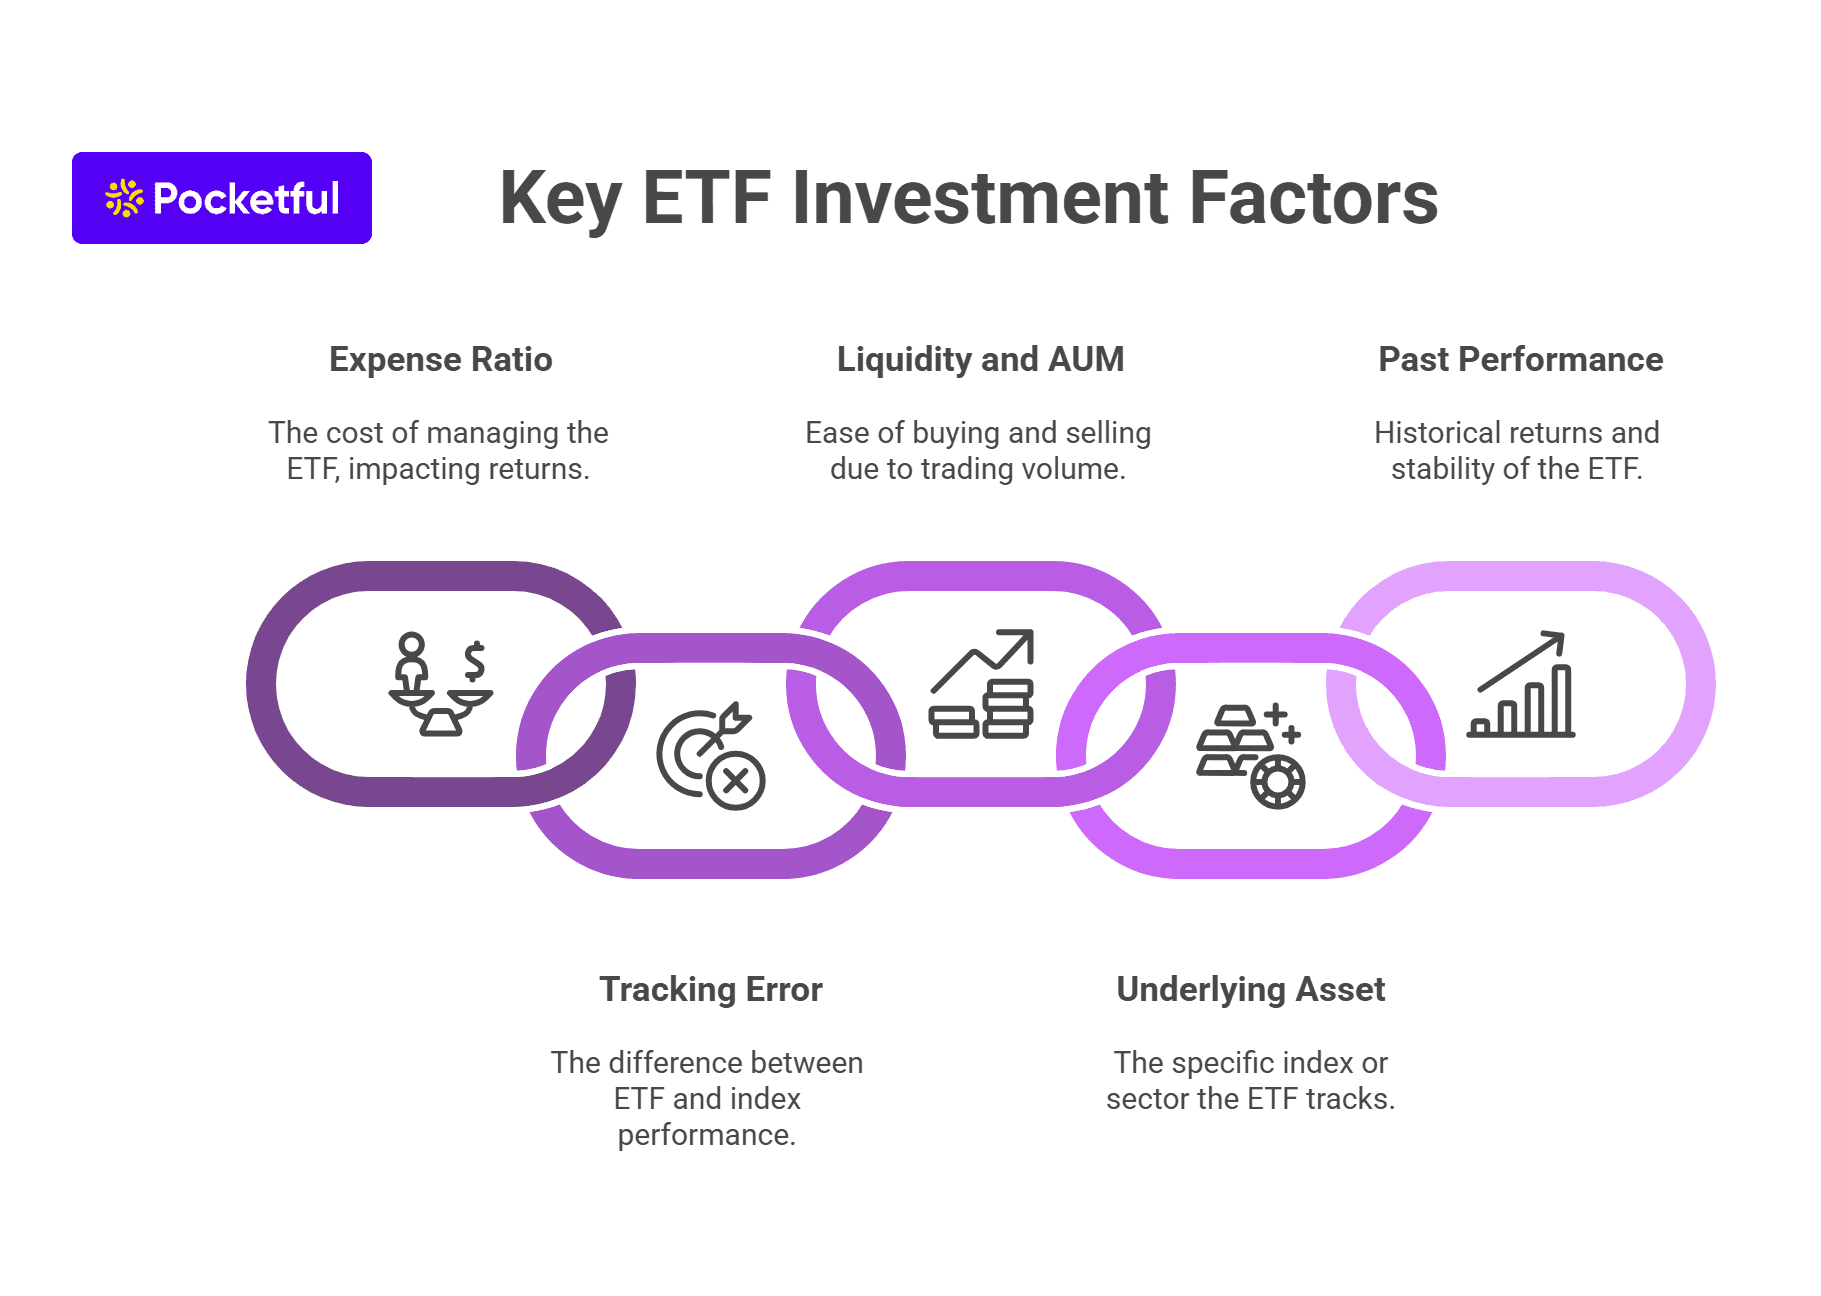
The key factors which an investor should consider before investing in an ETF are as follows:
Expense Ratio: The expense ratio plays a major role when choosing an ETF for investment; the lower the expense ratio, the higher the returns.
Tracking Error: A tracking error defines the difference between the performance of an ETF and the index which it replicates; the lower the tracking error, the better the returns.
Liquidity and AUM: Check the trading volume and the assets under management (AUM) of the ETF. A high trading volume and larger AUM generally indicate better liquidity, which makes it easier to buy and sell an ETF.
Underlying Asset: There are various ETFs available in the market tracking the different indices; therefore an investor should choose the ETF based on their investment objective.
Past Performance: This is one of the key factors to be considered before choosing an ETF for investment. ETFs which have posted consistently higher returns with low tracking errors should be considered for investment.
The amount to be invested in the ETF depends on various factors such as your existing financial conditions, debt level, your investment objective, and your risk tolerance. If you are an aggressive investor and want to invest in a specific sector for a higher return, then you can opt for sectoral ETFs. However, if you are a conservative investor, then you can opt for investing in equity-oriented ETFs, which primarily invest in the top 50 or 100 companies. Alternatively, if you are looking to diversify your portfolio and wish to invest in Gold and other commodities, then you can invest in commodity ETFs.
On a concluding note, there are various categories of ETFs available in India, and if someone is looking to invest passively, ETFs are a good option. However, ETFs generally have a slight tracking error, due to which their returns are approximately similar to that of the indices they follow. Hence, an investor must compare the tracking error of the ETFs investing in the same underlying asset to select the best ETF among them before investing. Among the various ETFs available in India, one must consider the ETF which suits their risk profile and always invest in an ETF after consulting with their investment advisor.
ETFs are passively managed funds as they replicate the index that they follow.
What is the minimum amount one can invest in an ETF?
The minimum amount that an investor can invest depends on the price of the ETF; there are various ETF prices which start from as low as ₹50.
Which type of tax applies to ETFs?
Capital Gain Tax is applicable on ETFs, depending on whether it is an equity, debt or gold ETF.
How can I buy an ETF in India?
To purchase an ETF in India, one must have a trading and demat account with a broker. If you have one, you can buy it like any other stock.
What are the risks associated with investing in ETFs?
ETFs generally carry lower risk than other asset classes. However, there are tracking errors, due to which the returns of ETFs can be lower than the index they follow.
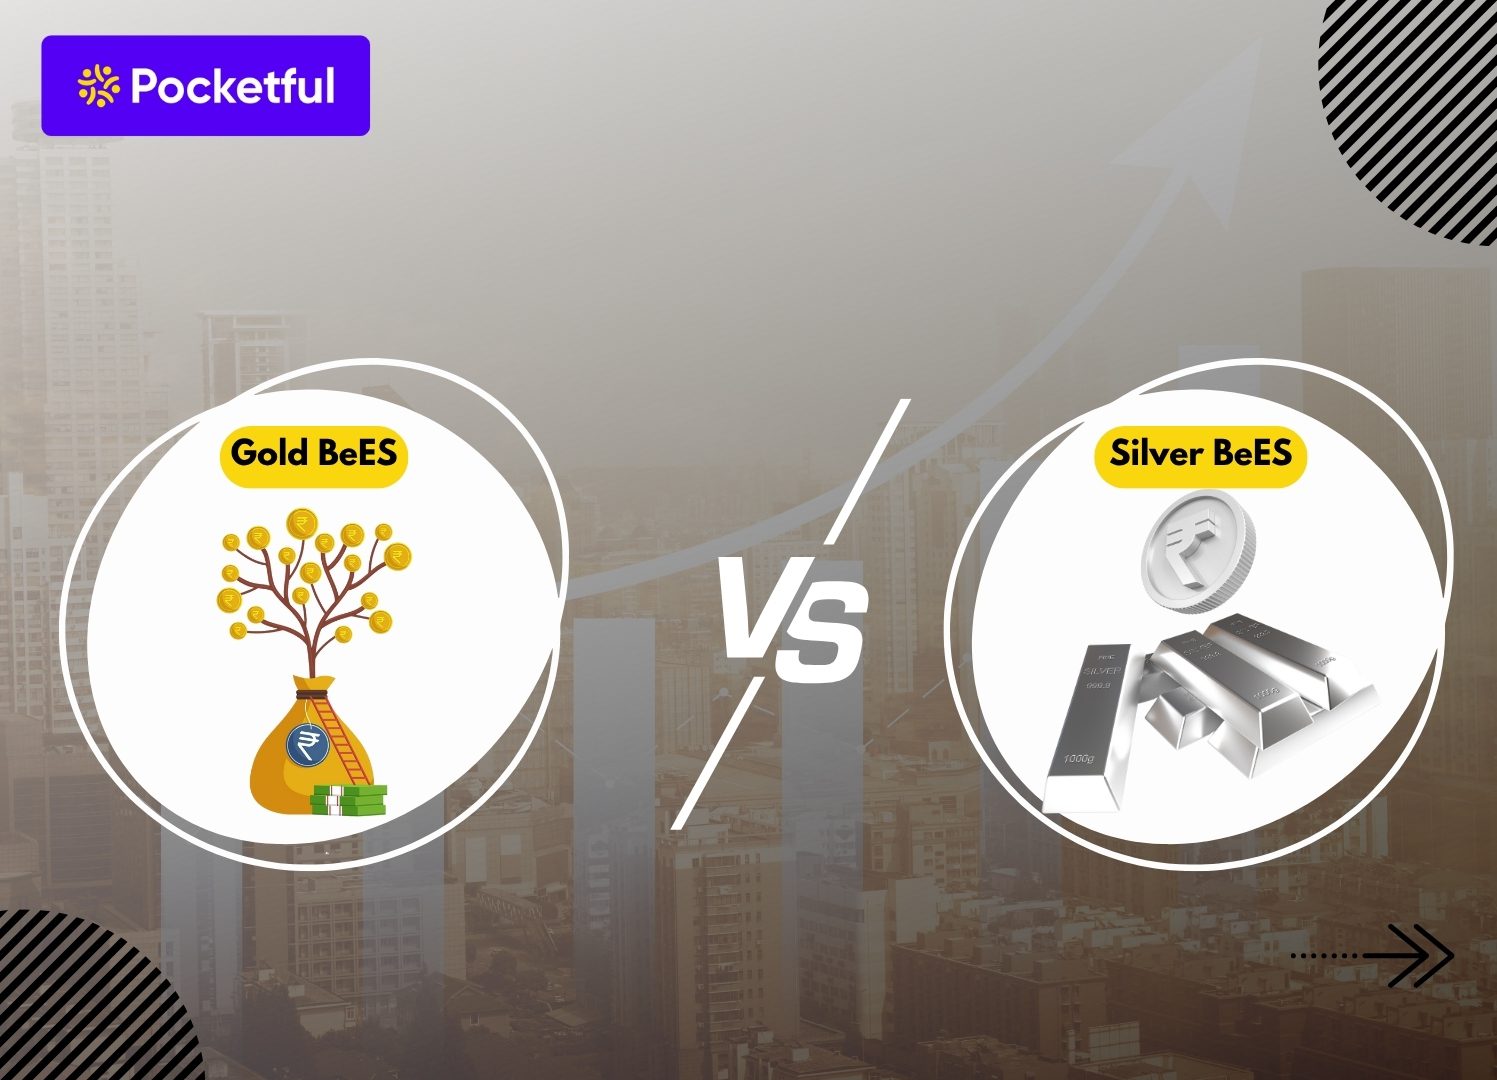
Investing in gold or silver today no longer means just buying jewellery as the way to invest in gold and silver has changed. Today, investing in these metals through ETFs like Gold BeES and Silver BeES is not only easy but also very transparent and affordable. Recently, the total trading volume of these ETFs crossed ₹644 crore on Akshaya Tritiya 2025, which is three times more than last year.
Gold BeES is considered a symbol of stability and reliability, while Silver BeES has the potential to give better returns. In this blog, both the options are weighed wisely to make the right investment decisions.
Understanding Gold BeES
Gold BeES is an exchange-traded fund (ETF) that tracks the domestic price of gold and allows investors to invest in gold digitally. It was launched by Nippon India Mutual Fund.
Key Features
Each unit represents approximately 0.01 grams of 99.5% pure gold, and its value fluctuates with gold prices.
It can be bought and sold like shares on NSE or BSE.
Investment is possible through Demat accounts.
There is no hassle of storage cost, making charges or theft.
There is an opportunity to invest in gold even with less capital.
Provides stability in long term portfolio and protection from inflation (Inflation Hedge).
Gold is traditionally considered a safe haven asset.
Understanding Silver BeES
Silver BeES is an ETF that tracks domestic silver prices and gives investors the option to invest in it digitally without buying physical silver. It has also been launched by Nippon India Mutual Fund.
Key features:
Each unit contains the value of about 1 gram of silver.
It can also be traded like a stock in real time on NSE/BSE.
Investment can be done with the help of a Demat account.
There is no need to store physical silver, which reduces the risk.
Silver is also an industrial metal, which is used in electronics, solar and auto sectors.
There is a sharp fluctuation in prices, which can lead to high returns in the short term.
Risk is slightly higher, but growth opportunities are also better.
Gold BeES vs Silver BeES: Key Differences
Points
Gold BeES
Silver BeES
Underlying Asset
Tracks 99.5% pure physical gold.
Tracks domestic silver prices, which depend on both industrial and investment demand.
Liquidity and Accessibility
Liquidity remains good due to high trading volume.
The trading volume is comparatively lower, but still significant.
Demand in Industries
Mainly used for jewellery and investment purposes, industrial demand is low.
There is high demand for silver in industries like electronics, solar panels, automobiles.
Volatility and Risk
Prices remain relatively stable, considered a safe investment option.
Prices fluctuate wildly, risk is high but the potential for returns is also high.
Returns
Gold BeEs give stable returns in the long term and help in protecting against inflation.
Potential for higher returns in the short-term, but prices are more volatile.
Lets compare the performance of Gold BeEs and Silver BeEs:
1. Historical Returns
Gold BeES has given investors an annual compounded annual growth rate (CAGR) of around 20.37% in the past 3 years. This means that long-term investment in gold has been stable and profitable.
On the other hand, Silver BeES has risen rapidly to achieve a CAGR of around 12.20% between 2022 and 2025. Since silver prices are influenced by industrial demand, its performance has been volatile.
2. 2024 Annual Performance
Gold ETFs delivered an average return of 19.23% in 2024, which was a big positive for investors amid economic uncertainty and inflation concerns. Silver ETFs also achieved a return of around 15.01%, which was possible due to global economic recovery and rising industrial demand.
3. Market Trends and Economic Factors
Gold BeES : Gold is traditionally considered a ‘safe haven’. When global economic uncertainty, inflation or geopolitical tensions rise, Gold BeES performs better. It helps investors protect their portfolios.
Silver BeES : Silver prices are linked to its demand in the manufacturing industry. Its increasing demand in sectors such as electronics, solar panels, and automobiles can increase Silver BeES prices rapidly. However, its prices are highly volatile, so it can be a bit risky for new investors.
4. Comparison from Investor Perspective :
Both investing in Gold BeES and Silver BeES depends on the investor’s financial goals, risk tolerance and holding period.
Gold BeES performance is generally considered stable and suitable for long-term investments.
Silver BeES has higher volatility, making it suitable for investors who can tolerate more risk and are focused on faster growth.
Pros and Cons of Investing in Gold BeES and Silver BeES
Both Gold BeES and Silver BeES are exchange traded funds (ETFs) that track the prices of gold and silver. While both these metals are considered valuable, the advantages and disadvantages of investing in them can differ:
1. Pros and Cons of Gold BeES
Pros
Stability : Gold is traditionally considered a safe asset, performing stable in economic uncertainty.
Inflation Hedge : Gold prices often rise in times of inflation, helping preserve value.
High Liquidity : Gold BeES has a high trading volume, making it easy to buy and sell.
Cons
Lower Short-Term Potential: Returns may be slow in the short term.
2. Pros and Cons of Silver BeES
Pros
Affordable : Low unit price makes it affordable even for small investors.
Short-Term Gain Potential : Prices may rise if industrial demand increases.
Industrial Support : Sustainable demand comes from electronics and green energy sectors.
Cons :
High Volatility : Prices can change rapidly, which can increase risk.
Industry Cycles Impact : Investment performance may be affected by economic recession or production decline.
Both ETFs Gold BeES and Silver BeES may look similar but their return profiles and market behaviour differ. Every investor has different needs, time horizon and risk appetite, and hence the utility of these options may vary.
Selection based on investment goals and risk profile
1. For those seeking stability – Gold BeES
Investors who prioritize stability and low risk are often attracted to assets that do not fluctuate much.
Gold BeES prices remain relatively stable, and it maintains its value even in times of economic uncertainty.
It can help balance a portfolio over the long term.
2. For those seeking growth – Silver BeES
Some investors prefer options with higher return potential, even if it comes with a little more risk.
Silver BeES is more volatile, but it can provide good returns when industrial demand increases.
3. Investment Horizon
Gold BeES is generally considered better for the long term as its price increases steadily over time.
Silver BeES has the potential to deliver faster returns in the short to medium term, but the risk is higher.
4. Importance of Diversification
Many investors prefer to create a diversified portfolio that includes both – Gold BeES and Silver BeES.
Gold provides protection against inflation and global uncertainty, while silver offers growth potential.
Combining the two can create a balanced investment portfolio that balances both risk and return.
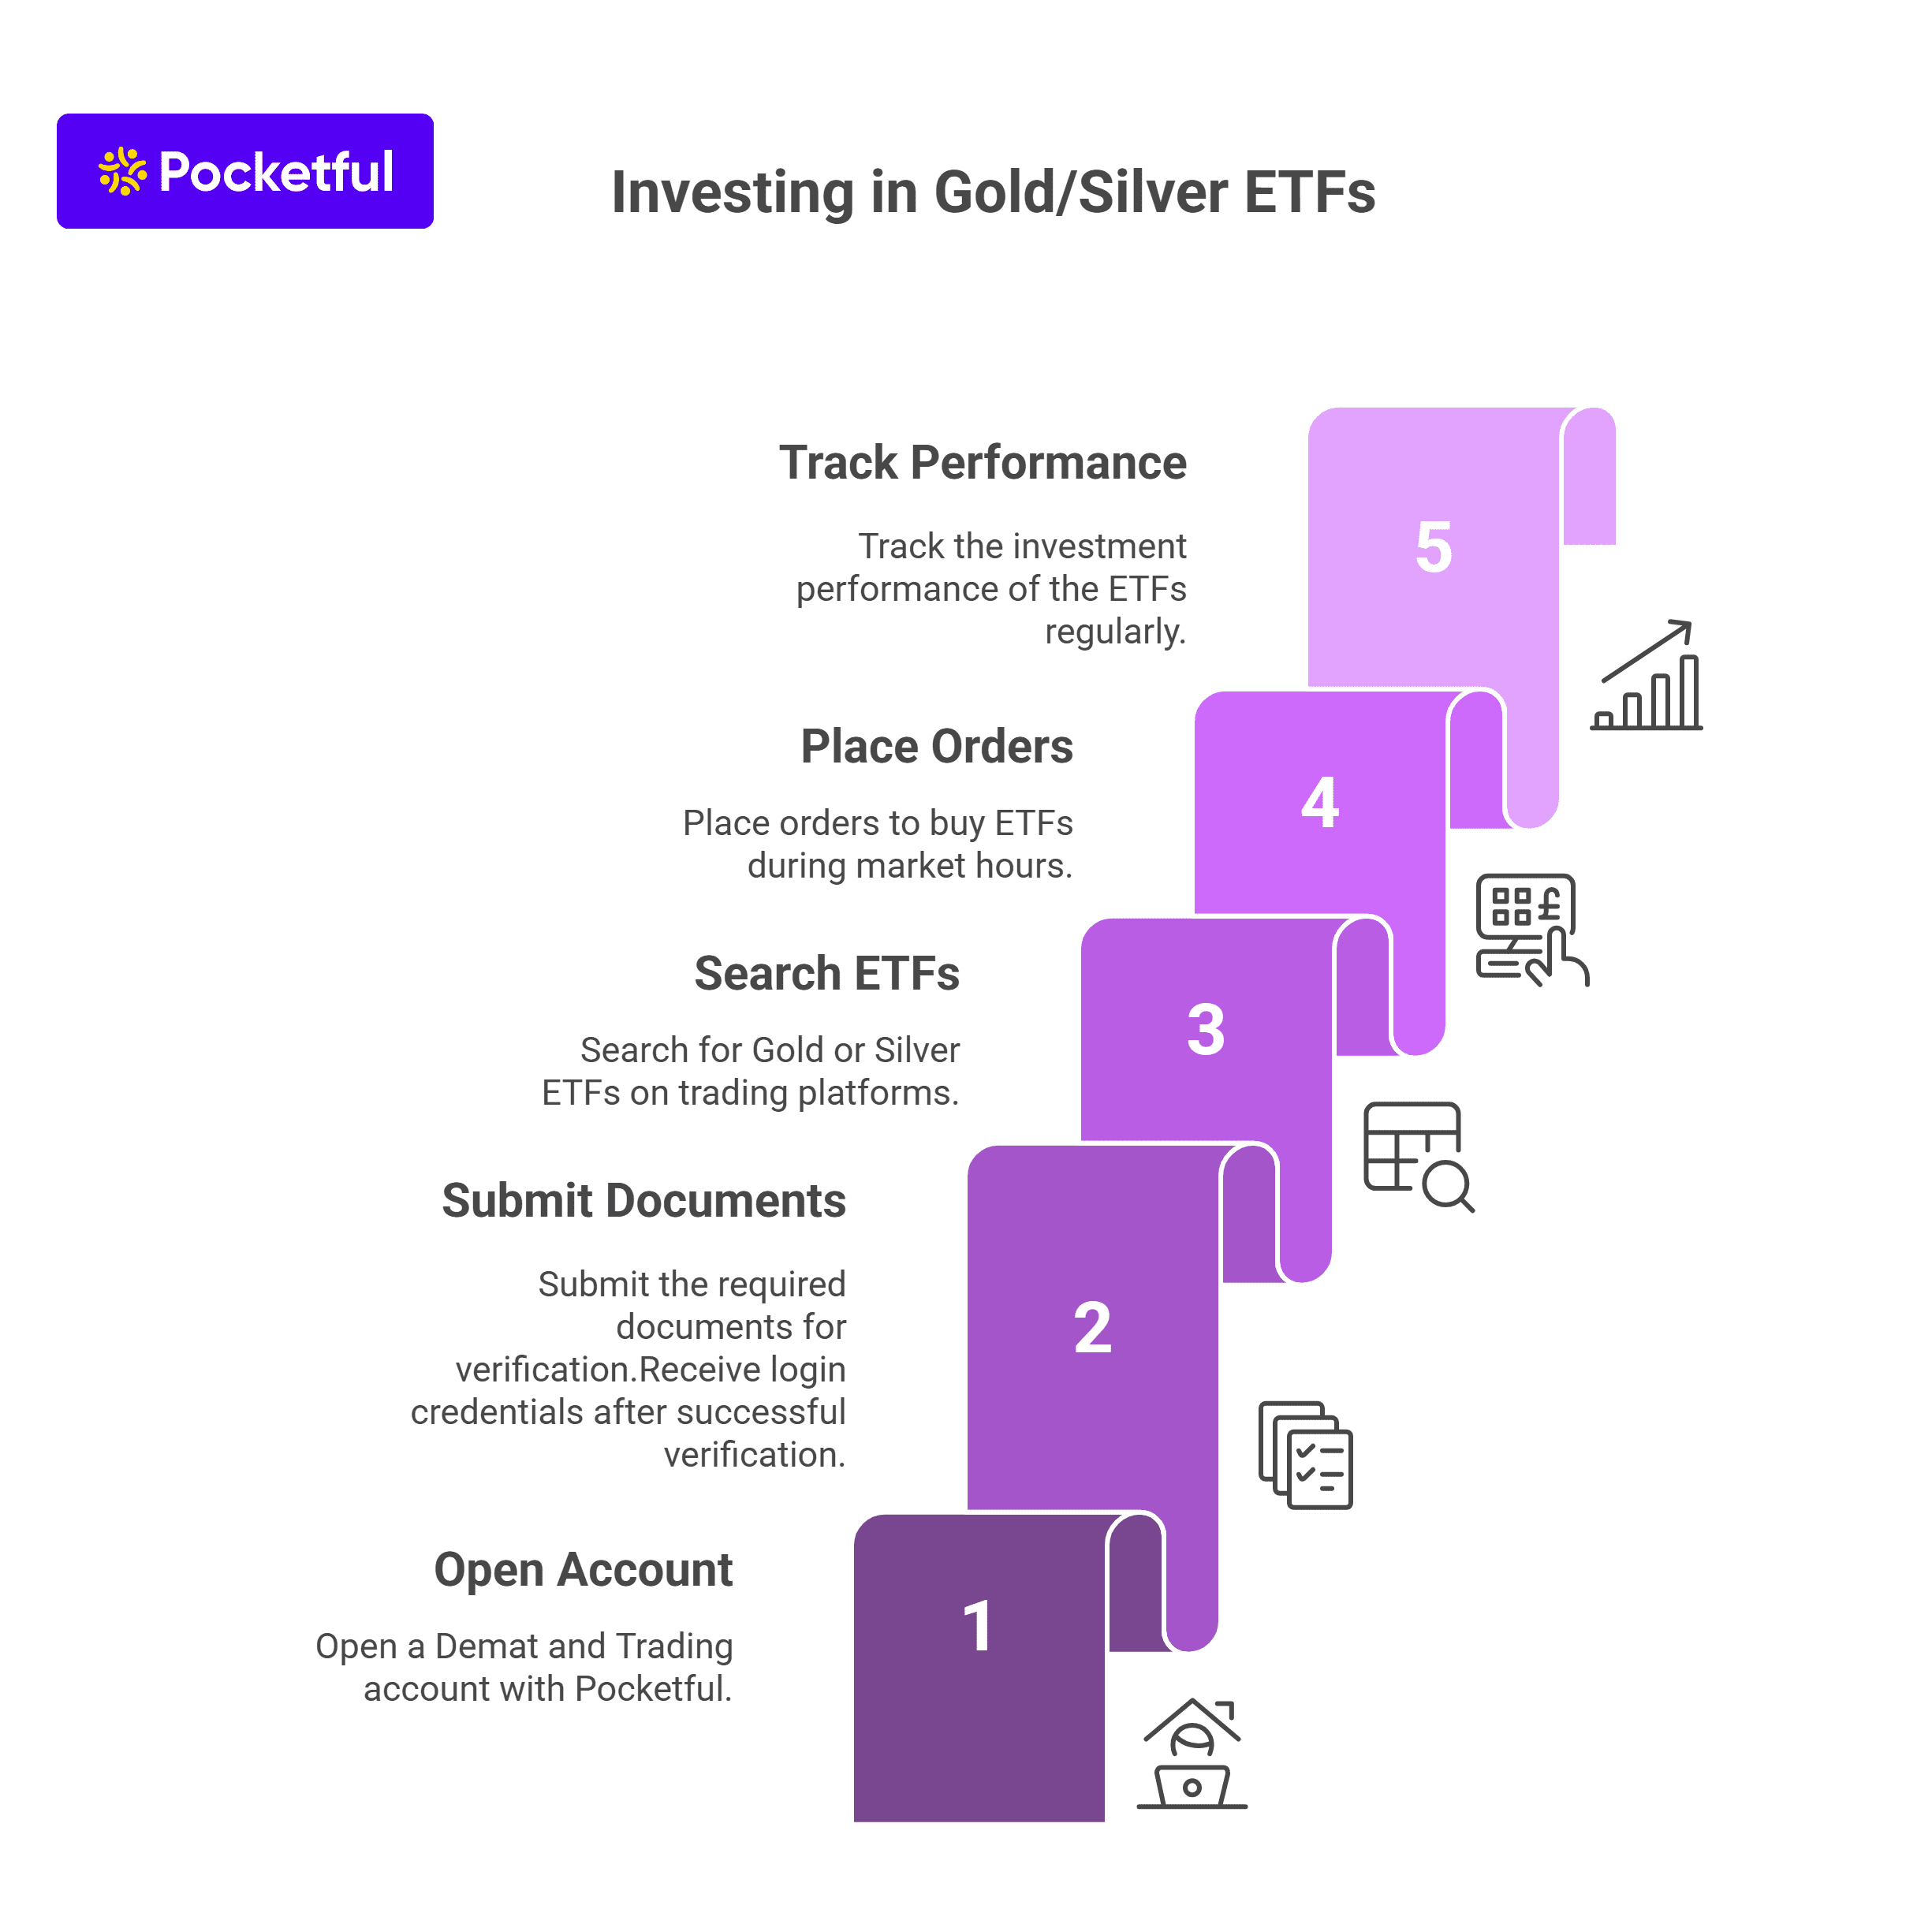
Submit the required documents and after successful verification, you will be sent the login credentials, which you can use to log in to your trading account.
Investors can search for Gold BeES or Silver BeES on the trading platforms. It is useful to check factors such as expense ratio, fund performance and tracking error before investing.
Then, orders can be placed to buy these ETFs during market hours.
TRack the investment performance of the ETFs at regular intervals.
Easy Investing with Pocketful : Pocketful is a registered stock broking platform from where one can invest in Gold BeES and Silver BeES in just a few clicks. Pocketful offers its clients a user-friendly interface, fast order execution and dedicated support team.
Gold and silver are different in nature; one is a safe haven linked to tradition, the other is a volatile metal driven by industrial demand. Gold BeES and Silver BeES allow investors to invest in these precious metals without having to buy them physically. It is important to understand these ETFs not just from a returns perspective but also economic and market dynamics behind them. It can be useful to keep in mind the objective, time horizon and market trends while deciding their suitability for your investment portfolio. Consult a financial advisor for advice before investing.
S.NO.
Check Out These Interesting Posts You Might Enjoy!
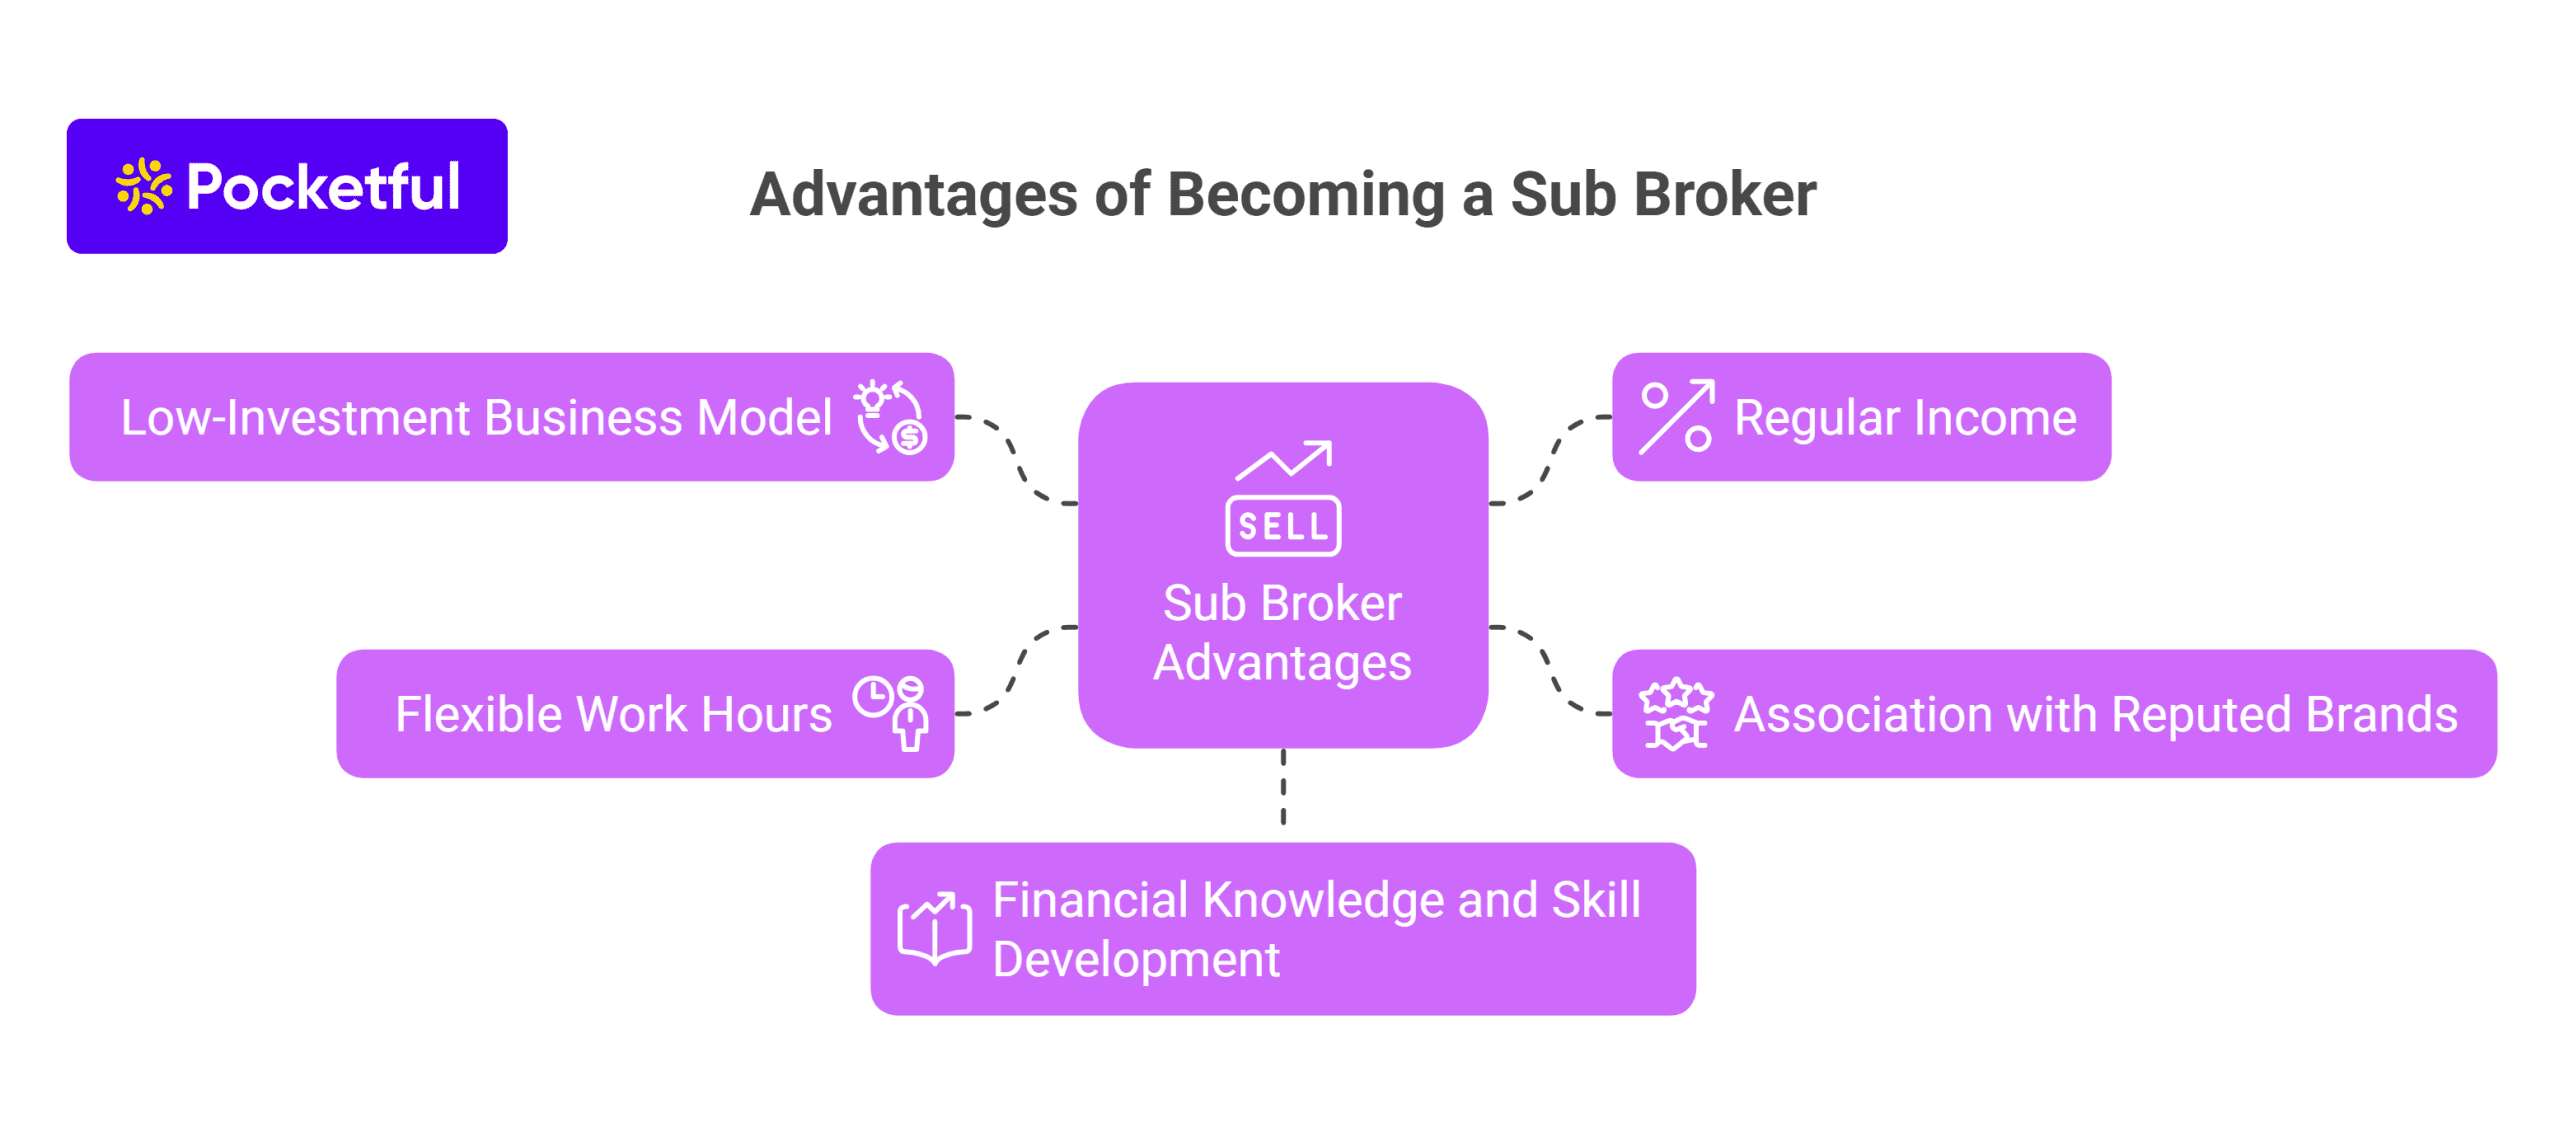
If a person is thinking of making a career in the stock market and has the ability to guide people about investing or trading, then becoming a sub broker can be a good career option. In today’s world, the demand for trading related services is constantly increasing.
This blog will explain in detail what steps are to be taken to become a sub broker, what are the qualifications and documents required for this, and how success can be achieved in this field with less investment.
What is a Sub Broker?
A sub-broker is a person or firm that works with a registered stockbroker and provides services such as share trading, investment and demat accounts to its clients. As per today’s regulations, SEBI has replaced the term “Sub-Broker” with “Authorised Person (AP)” but among the general public, the term sub-broker is still popular. A sub-broker does not deal directly with the exchange itself but works under the network of brokerage houses and earns on a commission basis. This role is best suited for those who are interested in selling financial products and building a client network.
Eligibility Criteria to Become a Sub Broker in India
The following eligibility criteria are required to become a sub-broker (now Authorised Person) in India:
Age: The applicant must be at least 18 years of age.
Educational Qualification: It is mandatory to have passed a minimum of 10+2 (Higher Secondary). However, higher education such as a graduate degree and experience in the financial market enhances career prospects.
NISM Certification: It is mandatory to pass the NISM-Series-VIII: Equity Derivatives Certification Examination, if you are dealing in derivatives as most of the brokerage is generated through derivatives trading activities.
Other Requirements: A person or an entity cannot be appointed as an AP on the same stock exchange by more than one trading member and there should not be any criminal or fraud case pending against him.
Note: SEBI has recently proposed new eligibility norms requiring a graduate degree and at least 3 years of experience in the financial markets, but these are not yet mandatory.
By fulfilling these criteria, you can take the first step towards becoming a successful sub-broker in India.
In August 2018, SEBI abolished the sub-broker category. Now, those who were earlier called sub-brokers are known as Authorized Persons (AP). To become an AP, one has to register through the respective stock exchange (such as NSE or BSE) instead of SEBI.
Here is the step-by-step process:
Select a broker : Choose a reputed stock broker (such as Pocketful) that offers the AP model. Get in touch with the broker and know the requirements.
Get NISM certification : For some brokers, it may be necessary to pass the NISM-Series-VIII: Equity Derivatives Certification Examination. It is recognized by SEBI and is useful for working in the financial markets.
Fill the application form : Fill the application form provided by the broker and attach the required documents, such as identity proof, address proof, educational certificates, etc.
Sign the contract : Sign an authorised person contract with the broker, which clearly describes the rights and responsibilities.
Register with the stock exchange : The broker will forward your application to the relevant stock exchange (such as NSE or BSE). The exchange will review the application and require you to pay a registration fee.
Get a registration certificate : After successful registration, you will receive an authorised person registration certificate from the stock exchange, allowing you to legally provide services to investors.
Documents Required for Sub Broker Registration
To become a Sub Broker (Authorised Person) in India, the following documents are required:
Application Form
Application form duly filled and signed in the format prescribed by the stock exchange.
Can be obtained from the concerned stock exchange.
Recommendation Letter
Recommendation letter provided by the concerned stock broker.
This letter should be on the broker’s letterhead.
Proof of Identity and Address
PAN Card, Aadhar Card, Passport, Voter ID, Electricity Bill, Telephone Bill etc.
Certified copies of all documents are required.
Educational Qualification Certificate
Minimum 10th or 12th class certificate.
If education is less than 12th, then at least two years of experience in the capital market must be certified.
Bank Reference Letter
Document issued by the applicant’s bank.
This letter is helpful in establishing an applicant’s good financial position.
Other Reference Letters
Reference letter issued by a chartered accountant, company secretary, lawyer or notary.
This letter certifies the credibility of the applicant.
Agreement
A contract signed between the stock broker and the sub-broker on a stamp paper.
This contract clarifies the rights and responsibilities of both parties.
Declarations and Affirmations
A declaration by the applicant that he is not guilty of any fraud or dishonesty offence.
This affidavit should be on the applicant’s letterhead.
By preparing these documents correctly and submitting them to the concerned brokerage firm, you can successfully complete the process of registration as a sub-broker.
Sub Brokers must fulfill the requirements mentioned below:
Security of client data : The AP is required to keep every client’s information such as KYC documents and transaction records confidential and secure. Strict action can be taken in case of data leak or misuse.
Transparency of trade details : It is necessary to send a contract note and trade confirmation to the client after every transaction. This gives the client complete information about his trading activity.
Grievance redressal system : The AP has to maintain an effective customer complaint resolution system, so that the problems of the clients can be resolved in a timely manner.
Code of Conduct : It is the responsibility of every AP to follow the rules and ethics set by SEBI and the stock exchanges—such as honesty, fairness and giving priority to client interests.
Reporting and filing : Although the Annual Compliance Report (ACR) is not directly mandatory for the AP, it is necessary to follow the reporting guidelines of the respective exchange.
Sub Broker Fees and Charges
Category
Description
Estimated Charges/Range
Registration Fee
Registration with the Stock Exchange is necessary.
NSE: ₹5,000 + GST BSE: ₹4,000 + GST
Infrastructure Investments
Initial expenses for office, systems, internet etc.
₹50,000 to ₹3,00,000
Maintenance Charges
AMC & Charges for trading platforms/services
₹1,000 to ₹2,000 each year
Commission Share
Brokerage share received on client trades
40% to 70% of total brokerage
Difference Between Sub Broker and Stock Broker
Aspect
Stock Broker
Sub Broker (AP)
Definition
Registered with SEBI and exchange, does direct trading
An agent associated with a stock broker that provides services to clients
Role
Trading, client fund management and risk handling
Dealing with clients, filling out trading forms, providing support
Authorisation
Registered with SEBI and Exchange
Approved by Stock Broker, no need of direct license from SEBI
Connecting clients with stock brokers for trading, customer service
Fee Structure
Collecting brokerage and other charges directly from the client
Receiving payment in the form of commission or fees from a stock broker
Skills and Qualities Required for a Successful Sub Broker
The following skills and qualities are helpful if you want to make a successful career as a sub broker:
Knowledge of financial products : It is important for a sub-broker to have a basic understanding of equity, derivatives, mutual funds and other financial instruments. This will enable him to recommend the right products to clients according to their investment goals.
Persuasive communication : Just giving information is not enough. A good sub-broker should be able to communicate persuasively to encourage client engagement. Pitching, clarity and listening skills are important in this.
Understanding of market trends : The stock market is always changing and a professional sub-broker should have an understanding of when the market may fluctuate and how it will affect the client’s portfolio.
Networking and lead generation skills : Bringing new leads and maintaining trusted relationships with old clients is important. A good client network is the key to consistent earnings.
Knowledge and compliance of regulations : You must be aware of all the regulatory guidelines prescribed by SEBI and the exchange, to ensure regulatory compliance and avoid penalties.
Data and report analysis ability : It is necessary to have the ability to read and understand trading reports, customer activity, brokerage generation etc., so that business performance can be evaluated.
Self-motivation and proactive approach : Sub-brokers face new challenges and deal with new clients every day. In such a situation, keeping yourself updated and thinking of continuous improvement is important for success.
Advantages of Becoming a Sub Broker
The advantages of becoming a sub broker are listed below:
Low-investment business model : Starting as a sub-broker does not require significant capital. Most brokerage firms provide virtual infrastructure support, which makes it possible to start at a low cost.
Regular income from brokerage sharing : The sub-broker receives a certain percentage of brokerage on each client’s trading activity. Income possibilities increase manifold when there is a more active client base.
Association with reputed brands : Association with companies like Angel One, Zerodha, Motilal Oswal, ICICI Direct gives the sub-broker a strong identity and credibility in the market, making client onboarding easier.
Flexible work hours and freedom : This business is free from the constraints of location or time as services are provided to the client through digital platforms, ensuring flexibility in work operations.
Financial Knowledge and Skill Development : Constant exposure to the market leads to continuous improvement in skills such as financial literacy, client handling, and product knowledge, opening up more avenues for growth in the future.
Challenges Faced by Sub Brokers
Challenges faced as a sub-broker are:
Adding and retaining new clients : This industry is based on trust and constantly adding new clients and keeping them satisfied for a long time is a big challenge, especially when there are plenty of options.
Intense and growing competition : Today, almost every major brokerage firm has its own channel partner network. In such an environment, it is not easy to create a different identity and prove yourself with service quality.
Following the rules and staying updated from time to time : It is important to follow the guidelines issued by SEBI and the exchange. Understanding and implementing the rules changing with time is a continuous process.
Market volatility directly affects income : The volatility of the stock market affects not only the investors but also the income of the sub-broker. There is a direct impact on income in a recession or low trading period.
Choose the right brokerage partner : Partnering with a reliable stock broking firm with a robust trading platform is beneficial in the long run. Getting better platforms, support and training increases the quality of work.
Build long-term relationships with clients : Just adding new clients is not enough, but it is also important to maintain a continuing relationship with them. Regular communication and honest advice strengthens the relationship.
Stay updated on the market and regulations : It is important to stay informed about changing regulations, tax rules and investment products so that every client can be given correct and up-to-date information.
Differentiate yourself with personalized service : Every investor has different financial needs. Providing customized advice keeping in mind their risk profile and goals increases both trust and satisfaction.
Focus on special segments : Targeting segments such as HNIs (High Net-worth Individuals), retired persons or new investors can help build a stable and loyal client base.
Conclusion
Becoming a sub-broker is a great option for those who understand the stock market and want to turn it into a profession. The best part is that it does not require a huge investment, but hard work and trustworthy operations can help you achieve success. Understanding the financial needs of clients, giving them the right advice and working according to the regulations is the backbone of this profession. If service quality and learning are given priority, then a career as a sub broker has endless growth opportunities.
FAQs
What is a sub broker?
A sub-broker is a person who acts as an agent of the stock broking company and provides trading services to clients.
How to become a sub broker in India?
To become a sub-broker, one has to register as per the rules specified by stock exchanges and the brokerage company, submit the required documents and undergo training.
What documents are required to become a sub broker?
Identification proof, address proof, PAN card, passport size photo and filling of brokerage company’s application form are required.
Is there any minimum educational qualification for becoming a sub broker?
According to recent news, SEBI has proposed that the applicant should at least be a graduate and have at least three years of experience in the financial markets.
What are the eligibility criteria to become a sub broker?
It is necessary to be a citizen of India, minimum age should be 18 years, and follow the rules set by stock exchanges and SEBI-registered brokers.
डिजिटल दौर में निवेश की शुरुआत अब डीमैट अकाउंट के बिना मुमकिन नहीं। मार्केट में पॉकेटफुल, ज़ेरोधा, ग्रो, एंजेल वन, अपस्टॉक्स जैसे कई ऑप्शन मौजूद हैं, लेकिन इतने सारे विकल्पों के बीच सही प्लेटफ़ॉर्म चुनना अक्सर मुश्किल हो जाता है। किसी को लॉन्ग टर्म इन्वेस्टमेंट चाहिए, कोई एक्टिव ट्रेडिंग करता है, तो कोई सिर्फ़ म्यूचुअल फंड्स में पैसे लगाता है। इस ब्लॉग में 2025 के टॉप 15 डीमैट अकाउंट्स की लिस्ट दी गई है और उनके चार्जेज़, फीचर्स, फ़ायदे और किसके लिए कौन सा बेस्ट है आसान भाषा में समझाया गया है।
डीमैट अकाउंट क्या होता है और क्यों ज़रूरी है?
डीमैट अकाउंट यानी डिमैटेरियलाइज़्ड अकाउंट, एक ऐसा खाता होता है जिसमें शेयर और सिक्योरिटीज़ को डिजिटल रूप में रखा जाता है। पहले जब कोई शेयर खरीदा जाता था, तो उसकी फिज़िकल कॉपी मिलती थी यानी कागज़ पर छपा हुआ सर्टिफिकेट। लेकिन आज के डिजिटल ज़माने में सारी ट्रेडिंग ऑनलाइन होती है, इसलिए हर इन्वेस्टर को एक डीमैट अकाउंट की ज़रूरत पड़ती है।
जैसे बैंक अकाउंट में पैसे रखे जाते हैं, वैसे ही डीमैट अकाउंट में शेयर, म्यूचुअल फंड, बॉन्ड, ईटीएफ जैसे इन्वेस्टमेंट डिजिटल रूप में स्टोर किए जाते हैं।
ये अकाउंट दो मुख्य डिपॉज़िटरी – एनएसडीएल (नेशनल सिक्योरिटीज़ डिपॉज़िटरी लिमिटेड) और सीडीएसएल (सेंट्रल डिपॉज़िटरी सर्विसेज़ लिमिटेड) – से जुड़े होते हैं, जो इन सिक्योरिटीज़ को सुरक्षित डिजिटल फॉर्म में बनाए रखते हैं।
डीमैट अकाउंट के ज़रिए शेयर मार्किट में निवेश करना न सिर्फ़ तेज़ और आसान होता है, बल्कि इसमें फिज़िकल सर्टिफिकेट्स के गुम होने, चोरी या फ्रॉड का कोई रिस्क भी नहीं होता।
डीमैट अकाउंट खोलते समय किन बातों का ध्यान रखें?
डीमैट अकाउंट ओपन करना तो आसान है, लेकिन ब्रोकर बहुत सोच-समझकर चुनना चाहिए। नीचे कुछ इंपॉर्टेंट पॉइंट्स दिए गए हैं जो डिसीजन लेने से पहले ज़रूर चेक करने चाहिए:
सेबी-रजिस्टर्ड ब्रोकर: हमेशा ऐसा ब्रोकर चुनना चाहिए जो सेबी से रजिस्टर्ड हो, ताकि इन्वेस्टर फंड्स और डेटा सुरक्षित रहें।
अकाउंट ओपनिंग फीस: कुछ ब्रोकर्स ₹0 में अकाउंट ओपन कराते हैं, जबकि कुछ नॉमिनल फीस लेते हैं। शुरुआत में ये चार्जेस कंपेयर करना ज़रूरी होता है।
एएमसी (अकाउंट मेंटेनेंस चार्जेस): एएमसी हर साल लिया जाने वाला चार्ज है। कई ब्रोकर्स पहले साल फ्री देते हैं, लेकिन बाद में चार्ज बढ़ सकते हैं , इसे ध्यान से देखना चाहिए।
ब्रोकरेज चार्जेस: यह वो फीस है जो हर ट्रेड पर लगती है। डिस्काउंट ब्रोकर्स ₹20 पर ऑर्डर या उससे भी कम में ट्रेड अलाउ करते हैं। हाई फ्रिक्वेंसी ट्रेडर्स के लिए यह काफी इंपॉर्टेंट होता है।
मार्जिन इंटरेस्ट: अगर मार्जिन पर ट्रेड करना है, तो ब्रोकर कितना इंटरेस्ट चार्ज करता है, यह भी चेक करना चाहिए। हिडन चार्जेस से बचने के लिए ये पॉइंट ध्यान रखें।
रिसर्च टूल्स और इनसाइट्स: ब्रोकर्स जो इन-डेप्थ रिसर्च रिपोर्ट्स, स्टॉक स्क्रीनर्स और टेक्निकल टूल्स प्रोवाइड करते हैं, वो लॉन्ग-टर्म इन्वेस्टिंग के लिए बेहतर होते हैं।
कस्टमर सपोर्ट: एक ज़रूरी फैक्टर है। डीमैट अकाउंट में कोई भी प्रॉब्लम आने पर क्विक और हेल्पफुल सपोर्ट चाहिए होता है। इसलिए ऐसा ब्रोकर चुनना बेहतर है जिसकी कस्टमर सर्विस फास्ट और रिलायबल हो।
2026 के टॉप 15 बेस्ट डीमैट अकाउंट in India
ब्रोकर
अकाउंट ओपनिंग फीस
एएमसी (अकाउंट मेंटेनेंस चार्जेस)
ब्रोकरेज चार्जेस
यूनीक फीचर्स
पॉकेटफुल
₹ 0
₹ 0
पॉकेटफुल देता है ₹0 डिलीवरी चार्जेस की सुविधा।
कटिंग-एज टेक्नोलॉजी से एक ही जगह मल्टीपल एसेट क्लासेस में इन्वेस्ट किया जा सकता है।
ज़ेरोधा
₹ 0
₹300 + जीएसटी
₹20 या 0.03% प्रति ऑर्डर जो भी कम हो।
यूज़र-फ्रेंडली प्लेटफॉर्म और ईज़ी लर्निंग टूल्स।
एंजेल वन
₹ 0
₹240 (पहला साल फ्री)
₹20 प्रति ऑर्डर
डीटेल्ड रिसर्च और वर्सेटाइल मोबाइल ऐप।
आईसीआईसीआई डायरेक्ट
₹ 0
₹ 700
इक्विटी डिलीवरी पर 0.55%, इंट्राडे पर 0.275%
3-in-1 अकाउंट के साथ एक्स्टेंसिव रिसर्च।
कोटक सिक्योरिटीज़
₹ 0
₹ 600
इक्विटी डिलीवरी पर 0.49%, इंट्राडे पर 0.049%
एडवांस्ड ट्रेडिंग टूल्स और पर्सनलाइज़्ड एडवाइजरी।
अपस्टॉक्स
₹ 0
₹ 150
₹20 या 0.05% प्रति ऑर्डर
लो ब्रोकरेज फीस और आसान प्लेटफॉर्म।
5पैसा
₹ 0
₹ 300
₹20 प्रति ऑर्डर
फ्लैट ब्रोकरेज रेट्स और म्यूचुअल फंड इन्वेस्टमेंट्स।
शेयरखान
₹ 0
₹ 400
इक्विटी डिलीवरी पर 0.5%, इंट्राडे पर 0.1%
ट्रेनिंग प्रोग्राम्स और एडवांस्ड ट्रेडिंग प्लेटफॉर्म्स।
मोतीलाल ओसवाल
₹ 0
₹ 199
इक्विटी डिलीवरी पर 0.5%, इंट्राडे पर 0.05%
पर्सनलाइज़्ड एडवाइजरी और पोर्टफोलियो मैनेजमेंट।
एसबीआई सिक्योरिटीज़
₹ 0
₹750 (पहला साल फ्री)
इक्विटी डिलीवरी पर 0.5%, इंट्राडे पर 0.05%
3-in-1 अकाउंट और स्ट्रॉन्ग बैंकिंग इंटीग्रेशन।
एक्सिस डायरेक्ट
₹ 0
₹ 750
इक्विटी डिलीवरी पर 0.5%, इंट्राडे पर 0.05%
सीमलेस फंड ट्रांसफर और एडवांस्ड रिसर्च टूल्स।
आईआईएफएल सिक्योरिटीज़
₹ 0
₹ 250
इक्विटी डिलीवरी पर 0.5%, इंट्राडे पर 0.05%
फ्री रिसर्च रिपोर्ट्स और एडवाइजरी सर्विसेज़।
एडलवाइस ब्रोकिंग
₹ 0
₹ 500
इक्विटी डिलीवरी पर 0.5%, इंट्राडे पर 0.05%
रिसर्च-ड्रिवन एडवाइजरी और डायवर्स इन्वेस्टमेंट ऑप्शंस।
ग्रो
₹ 0
₹ 0
₹20 या 0.01% प्रति ऑर्डर
ज़ीरो एएमसी और यूज़र-फ्रेंडली प्लेटफॉर्म।
पेटीएम मनी
₹ 0
₹ 0
₹20 प्रति इंट्राडे ऑर्डर और ₹20 डिलीवरी के लिए
पेटीएम इकोसिस्टम से इंटीग्रेटेड और लो ट्रांज़ैक्शन कॉस्ट्स।
ट्रेडर्स और इन्वेस्टर्स के लिए टॉप 15 डीमैट अकाउंट्स का ओवरव्यू
ट्रेडर्स और इन्वेस्टर्स के लिए टॉप 15 डीमैट अकाउंट्स का ओवरव्यू नीचे दिया गया है:
1. पॉकेटफुल
पॉकेटफुल एक नई पीढ़ी की डिस्काउंट ब्रोकिंग कंपनी है, जो इक्विटी, कमोडिटी, डेरिवेटिव्स जैसे कई निवेश विकल्प प्रदान करती है। इसका लॉन्च 2024 में हुआ था और यह पेस फाइनेंशियल ग्रुप के अंतर्गत काम करती है। पॉकेटफुल को 27 साल से अधिक अनुभव वाले प्रोफेशनल्स ने विकसित किया है, जिससे यूज़र को बेहतरीन और भरोसेमंद ट्रेडिंग एक्सपीरियंस मिलता है।
पॉकेटफुल की सबसे बड़ी खासियत यह है कि इक्विटी डिलीवरी ट्रेड्स पर कोई ब्रोकरेज चार्ज नहीं लिया जाता, साथ ही अकाउंट खोलने और अकाउंट मेंटेनेंस चार्ज भी फ्री है। इसलिए यह प्लेटफ़ॉर्म शुरुआती और अनुभवी दोनों तरह के निवेशकों के लिए एक बढ़िया विकल्प है।
मुख्य फीचर्स:
इक्विटी डिलीवरी ट्रेड्स पर शून्य ब्रोकरेज।
अकाउंट खोलने की प्रक्रिया बहुत आसान और केवल 5 मिनट में पूरी हो जाती है।
एपीआई सपोर्ट, जिससे अपनी ट्रेडिंग स्ट्रेटेजीज को कस्टमाइज़ और ऑटोमेट किया जा सकता है।
सबसे बेहतर किसके लिए: पॉकेटफुल उन यूज़र्स के लिए बढ़िया है, जो बिना किसी अतिरिक्त चार्ज के एडवांस्ड ट्रेडिंग प्लेटफॉर्म चाहते हैं।
2. ज़ेरोधा
ज़ेरोधा देश की सबसे बड़ी और भरोसेमंद डिस्काउंट ब्रोकिंग फर्मों में से एक है। इसे 2010 में कामथ ब्रदर्स ने शुरू किया था और इसने फ्लैट ब्रोकरेज मॉडल के जरिए ब्रोकिंग इंडस्ट्री में नया ट्रेंड सेट किया। ज़ेरोधा का प्लेटफ़ॉर्म तकनीकी रूप से बहुत एडवांस्ड और यूज़र-फ्रेंडली है, जो ट्रेडिंग को आसान, किफायती और सभी के लिए एक्सेसिबल बनाता है, खासकर नए इन्वेस्टर्स के लिए।
मुख्य फीचर्स:
सिंपल और यूज़र-फ्रेंडली ट्रेडिंग प्लेटफ़ॉर्म।
डेडिकेटेड कस्टमर सपोर्ट टीम, जो आपकी हर क्वेरी का जल्दी समाधान करती है।
वैरिसिटी (Varsity) नाम का फ्री एजुकेशन प्लेटफ़ॉर्म, जहां स्टॉक मार्किट से जुड़ी डीप जानकारी और सीखने के अवसर मिलते हैं।
बेस्ट फॉर:जो इन्वेस्टर्स लो ब्रोकरेज पर ट्रेड करना चाहते हैं और टेक्नोलॉजी-ड्रिवन प्लेटफ़ॉर्म पसंद करते हैं, उनके लिए ज़ेरोधा एक परफेक्ट चॉइस है।
3. एंजेल वन
एंजेल वन भारत की टॉप फुल-सर्विस ब्रोकिंग कंपनियों में से एक है, जिसकी स्थापना 1996 में हुई थी। यह प्लेटफ़ॉर्म इक्विटी, कमोडिटी, डेरिवेटिव्स समेत कई असेट क्लास में ट्रेडिंग और इन्वेस्टमेंट की सुविधा देता है। साथ ही, एंजेल वन इन्वेस्टमेंट एडवाइजरी सर्विसेज भी प्रोवाइड करता है, जो यूज़र्स की वित्तीय ज़रूरतों को बेहतर तरीके से पूरा करता है। इसका ट्रेडिंग प्लेटफ़ॉर्म एडवांस टेक्नोलॉजी से लैस है और यूज़र की सहूलियत को ध्यान में रखकर डिजाइन किया गया है।
मुख्य फीचर्स:
पर्सनलाइज़्ड कस्टमर-फोकस्ड अप्रोच, जो हर यूज़र को खास अनुभव देता है।
एंजेल वन ऐप में एडवांस्ड ट्रेडिंग टूल्स उपलब्ध हैं, जो ट्रेडिंग को आसान और प्रोफेशनल बनाते हैं।
पूरे भारत में स्ट्रॉन्ग ऑफलाइन प्रेजेंस और व्यापक ब्रांच नेटवर्क।
बेस्ट फॉर : जो ट्रेडर्स ऑफलाइन ब्रोकिंग सर्विस को प्राथमिकता देते हैं, उनके लिए एंजेल वन एक भरोसेमंद और बेहतर ऑप्शन है।
4. आईसीआईसीआई डायरेक्ट
आईसीआईसीआई डायरेक्ट भारत के टॉप स्टॉक ब्रोकर्स में से एक है, जो प्राइवेट सेक्टर की बड़ी बैंक, आईसीआईसीआई बैंक की सब्सिडियरी है। इसका सबसे बड़ा फायदा इसका थ्री-इन-वन अकाउंट है, जिसमें सेविंग्स अकाउंट, ट्रेडिंग अकाउंट और डिमैट अकाउंट को एक ही जगह लिंक किया जा सकता है। इससे फंड ट्रांसफर और ट्रेडिंग का प्रोसेस बहुत ही आसान हो जाता है, खासकर उन इन्वेस्टर्स के लिए जो सरलता पसंद करते हैं।
मुख्य फीचर्स:
देशभर में लोकल ऑफ़िस के ज़रिए मजबूत फिज़िकल प्रेजेंस।
क्लाइंट्स को रिसर्च और कंसल्टेंसी सर्विसेज उपलब्ध कराता है।
पर्सनलाइज़्ड वेल्थ मैनेजमेंट सॉल्यूशंस भी देता है, जिससे इन्वेस्टमेंट प्लानिंग आसान हो जाती है।
बेस्ट फॉर : जो इन्वेस्टर्स लोकल ब्रांच से सपोर्ट और हेल्प चाहते हैं, उनके लिए आईसीआईसीआई डायरेक्ट एक ट्रस्टेड और सुविधाजनक विकल्प साबित होता है।
5. कोटक सिक्योरिटीज
कोटक सिक्योरिटीज, कोटक महिंद्रा बैंक की एक डिवीजन है और भारत के टॉप प्राइवेट बैंकों में से एक मानी जाती है। यह यूज़र्स को उनके बैंक अकाउंट को सीधे ट्रेडिंग और डिमैट अकाउंट से लिंक करने की सुविधा देता है, जिससे फंड ट्रांसफर आसान हो जाता है। कोटक सिक्योरिटीज इक्विटी, कमोडिटी, डेरिवेटिव्स सहित कई इन्वेस्टमेंट ऑप्शंस प्रोवाइड करता है। इनके Neo Web प्लेटफ़ॉर्म और कोटक नियो मोबाइल ऐप रियल-टाइम मार्केट डेटा भी प्रदान करते हैं, जो ट्रेडर्स के लिए काफी उपयोगी है।
मुख्य फीचर्स:
इक्विटी और कमोडिटी ट्रेडिंग के साथ म्यूचुअल फंड इन्वेस्टमेंट की सुविधा।
ऑनलाइन एजुकेशनल इनिशिएटिव्स, जो स्टॉक मार्किट की समझ बढ़ाने में मदद करते हैं।
कोटक बैंक के ब्रांड सपोर्ट के कारण सिक्योरिटी और विश्वसनीयता का भरोसा।
बेस्ट फॉर : जो इन्वेस्टर्स स्टॉक मार्किट की नॉलेज ऑनलाइन ट्यूटोरियल्स से बढ़ाना चाहते हैं, उनके लिए कोटक सिक्योरिटीज एक बढ़िया ऑप्शन है।
अपस्टॉक्स एक न्यू-एज डिस्काउंट ब्रोकिंग प्लेटफॉर्म है जो ट्रेडिंग को तेज़, आसान और तकनीकी रूप से स्मार्ट बनाता है। यह यूज़र्स को एडवांस टेक्निकल एनालिसिस टूल्स, ऑप्शन चैन और स्ट्रैटेजी मोड जैसे फीचर्स के साथ अपने ट्रेडिंग डिसिज़न खुद प्लान करने की आज़ादी देता है। अपस्टॉक्स के ज़रिए आप इक्विटी, कमॉडिटी और डेरिवेटिव्स में इन्वेस्ट कर सकते हैं – वो भी मिनिमम कॉस्ट पर।
मुख्य फीचर्स:
सिंपल और यूज़र-फ्रेंडली मोबाइल ऐप जो बिगिनर्स के लिए भी एकदम परफेक्ट है।
मल्टीपल वॉचलिस्ट्स बनाने की सुविधा ताकि फेवरेट स्टॉक्स और कमॉडिटीज को ट्रैक कर सकें।
कोई एनुअल मेंटेनेंस चार्ज नहीं – यानी कम खर्च में ज्यादा फायदा।
बेस्ट फॉर : जिन ट्रेडर्स को इंट्राडे या स्विंग ट्रेडिंग करनी है और टेक्निकल एनालिसिस के टूल्स की ज़रूरत होती है, उनके लिए अपस्टॉक्स एक शानदार चॉइस है।
7. 5पैसा
5पैसा एक लोकप्रिय डिस्काउंट ब्रोकिंग प्लेटफॉर्म है जो 2016 में लॉन्च हुआ था और तब से अपने लो-कॉस्ट मॉडल और मल्टीपल इन्वेस्टमेंट ऑप्शन्स के ज़रिए यूज़र्स के बीच तेज़ी से पॉपुलर हुआ है। यह न केवल स्टॉक्स बल्कि म्यूचुअल फंड्स में भी डायरेक्ट इन्वेस्टमेंट की सुविधा देता है। इसके वेब और मोबाइल प्लेटफॉर्म को इस तरह डिज़ाइन किया गया है कि ट्रेडिंग हर यूज़र के लिए सिंपल और स्मूद लगे।
मुख्य फीचर्स:
आसान और यूज़र-फ्रेंडली इंटरफेस के साथ वेब और मोबाइल प्लेटफॉर्म।
डायरेक्ट म्यूचुअल फंड इन्वेस्टमेंट की सुविधा – वो भी बिना किसी एजेंट के।
F&O 360 प्लेटफॉर्म के ज़रिए एडवांस्ड एनालिसिस टूल्स की एक्सेस, जिससे डिसीज़न लेना हो जाए और भी बेहतर।
बेस्ट फॉर : जो इन्वेस्टर्स स्टॉक मार्किट की शुरुआत इंटरऐक्टिव लर्निंग और वर्कशॉप्स के ज़रिए करना चाहते हैं, उनके लिए 5पैसा एक समझदारी भरा ऑप्शन है।
8. शेयरखान
शेयरखान भारत की उन शुरुआती ब्रोकिंग कंपनियों में शामिल है जिसने 2000 में ऑनलाइन ट्रेडिंग को आम इन्वेस्टर्स तक पहुँचाया। देशभर में फैली अपनी फ्रैंचाइज़ी नेटवर्क की बदौलत इसने जल्दी ही एक मजबूत पहचान बना ली। 2016 में यह फ्रेंच इन्वेस्टमेंट बैंक BNP पारिबास का हिस्सा बना और फिर 2024 में मिराए एसेट फाइनेंशियल ग्रुप ने इसे अधिग्रहित कर लिया। शेयरखान सिर्फ ट्रेडिंग ही नहीं, बल्कि एडवांस लर्निंग के लिए भी जाना जाता है।
मुख्य फीचर्स:
मॉडर्न और स्मूद मोबाइल ऐप जिसमें एडवांस ट्रेडिंग टूल्स उपलब्ध हैं।
शेयरखान क्लासरूम’ के ज़रिए ऑनलाइन कोर्सेस और ट्रेनिंग प्रोग्राम्स।
प्रोफेशनल कस्टमर सपोर्ट जो यूज़र की हर परेशानी का तुरंत हल देता है।
बेस्ट फॉर : जिन्हें टेक्निकल या फंडामेंटल एनालिसिस सीखना है और ट्रेडिंग को गहराई से समझना है, उनके लिए शेयरखान एक बेहतरीन विकल्प है।
9. मोतिलाल ओसवाल
मोतिलाल ओसवाल की शुरुआत 1987 में हुई थी और तब से यह इंडियन ब्रोकिंग इंडस्ट्री में एक जाना-पहचाना नाम बन चुका है। 30+ सालों का अनुभव, दर्जनों अवॉर्ड्स और मजबूत रिसर्च बैकअप के साथ, यह कंपनी इन्वेस्टर्स को सिर्फ ट्रेडिंग ही नहीं बल्कि पर्सनलाइज्ड एडवाइजरी, पोर्टफोलियो मैनेजमेंट सर्विसेज और मल्टीपल एसेट क्लासेज में इन्वेस्टमेंट की सुविधा देती है। इनका RISE मोबाइल ऐप और वेबसाइट यूज़र्स को प्रो-लेवल रिसर्च रिपोर्ट्स और एडवांस एनालिसिस टूल्स तक एक्सेस देता है।
मुख्य फ़ीचर्स:
हर यूज़र की ज़रूरत के हिसाब से कस्टमाइज्ड फाइनेंशियल सॉल्यूशंस।
मोबाइल एप्लिकेशन यूज़र-फ्रेंडली इंटरफ़ेस के कारण इंडस्ट्री में सबसे बेहतरीन माना जाता है।
सिक्योरिटीज के अगेंस्ट लोन की सुविधा भी उपलब्ध है।
बेस्ट फॉर: ऐसे इन्वेस्टर्स जो एक ही प्लेटफॉर्म पर पोर्टफोलियो मैनेजमेंट से लेकर एडवांस रिसर्च और ट्रांजैक्शन फैसिलिटी तक सबकुछ चाहते हैं, उनके लिए मोतीलाल ओसवाल एक परफेक्ट चॉइस है।
10. एसबीआई सिक्योरिटीज
एसबीआई सिक्योरिटीज की स्थापना 2006 में हुई थी और यह भारत के सबसे बड़े पब्लिक सेक्टर बैंक, स्टेट बैंक ऑफ इंडिया (SBI) की फुली ओन्ड सब्सिडियरी है। पहले इसे SBICap Securities Limited के नाम से जाना जाता था। यह ब्रोकिंग फर्म अपने वाइड ब्रांच नेटवर्क और गवर्नमेंट-बैक्ड ट्रस्ट की वजह से इन्वेस्टर्स के बीच एक मजबूत और भरोसेमंद नाम बना हुआ है। एसबीआई सिक्योरिटीज आपको इक्विटी, कमॉडिटी ट्रेडिंग के साथ-साथ रिसर्च-बेस्ड एडवाइजरी और परसोनलाइज़्ड सर्विसेज भी ऑफर करता है।
मुख्य फ़ीचर्स:
हाई-नेट-वर्थ इन्वेस्टर्स के लिए डेडिकेटेड रिलेशनशिप मैनेजर्स की सुविधा।
मार्जिन ट्रेडिंग फैसिलिटी से इन्ट्राडे ट्रेडर्स को अतिरिक्त फंडिंग सपोर्ट मिलता है।
बेस्ट फॉर : जो इन्वेस्टर्स सरकारी बैंक से जुड़े प्लेटफॉर्म पर सिक्योर और वाइड-स्पेक्ट्रम ब्रोकिंग सर्विसेज चाहते हैं, उनके लिए एसबीआई सिक्योरिटीज एक विश्वसनीय ऑप्शन है। हाँ, इसका ब्रोकरेज चार्ज कुछ प्राइवेट ब्रोकर्स से ज्यादा हो सकता है, लेकिन सर्विस की क्वॉलिटी उस अंतर को कवर कर देती है।
11. एक्सिस डायरेक्ट
एक्सिस डायरेक्ट की शुरुआत 2011 में हुई थी और यह एक्सिस सिक्योरिटीज लिमिटेड का हिस्सा है, जो एक्सिस बैंक की सब्सिडियरी कंपनी है। इसने एडवांस टेक्नोलॉजी की मदद से एक पावरफुल ट्रेडिंग प्लेटफ़ॉर्म तैयार किया है जो इंडियन ब्रोकिंग इंडस्ट्री के टॉप प्लेटफ़ॉर्म्स में गिना जाता है। अगर आप एक्सिस बैंक के कस्टमर हैं, तो आप बड़ी आसानी से अपने बैंक अकाउंट को डिमैट और ट्रेडिंग अकाउंट से लिंक कर सकते हैं। मुंबई में इसका हेडक्वार्टर है और यह कंपनी अपने इन्वेस्टर्स को टेक्नोलॉजी, रिसर्च और सपोर्ट का बेहतरीन कॉम्बिनेशन देती है।
मुख्य फ़ीचर्स:
यूज़र्स को मिलता है एक एडवांस ट्रेडिंग और इन्वेस्टमेंट प्लेटफ़ॉर्म।
रेगुलर और डीप फंडामेंटल रिसर्च रिपोर्ट्स, जो स्टॉक्स, सेक्टर्स और कमॉडिटीज को कवर करती हैं।
मर्जिन फंडिंग फैसिलिटी से निवेशकों को मिलती है एक्स्ट्रा ट्रेडिंग पावर।
बेस्ट फॉर : जो निवेशक मर्जिन ट्रेडिंग फैसिलिटी का उपयोग करना चाहते हैं, उनके लिए यह एक अच्छा विकल्प है।
12. आईआईएफएल
आईआईएफएल (India Infoline) की शुरुआत 1985 में एक रिसर्च और एडवाइजरी फर्म के रूप में हुई थी। शुरुआत से ही इसका फोकस इन्वेस्टर्स को डीप रिसर्च और डेटा-बेस्ड इनसाइट्स देने पर रहा है। 2005 में कंपनी ने अपना नाम बदलकर IIFL किया और इंडियन स्टॉक एक्सचेंज में लिस्ट भी हुई। आज यह एक भरोसेमंद ब्रोकिंग हाउस है जो यूज़र्स को एडवांस ट्रेडिंग प्लेटफॉर्म, इन-डेप्थ रिसर्च रिपोर्ट्स और एजुकेशनल सेशंस जैसी सुविधाएं देता है, जिससे निवेशक बेहतर डिसीजन ले सकें।
मुख्य फ़ीचर्स:
इंडस्ट्री-लीडिंग रिसर्च और पर्सनलाइज़्ड एडवाइजरी सर्विसेज।
यूज़र-फ्रेंडली ट्रेडिंग प्लेटफॉर्म जो हर तरह के इन्वेस्टर्स के लिए उपयुक्त है।
फ्री एजुकेशनल सेशंस जो खासकर नए निवेशकों के लिए काफ़ी मददगार हैं।
बेस्ट फॉर : वो इन्वेस्टर्स जो रिसर्च और एक्सपर्ट एडवाइस के बेस पर स्मार्ट ट्रेडिंग करना चाहते हैं, उनके लिए आईआईएफएल एक शानदार चॉइस है।
13. एडेलवाइस
एडेलवाइस ग्रुप ने 2008 में ब्रोकिंग इंडस्ट्री में एंट्री ली और तब से यह निवेशकों को मल्टी-लेवल फाइनेंशियल सर्विसेज़ ऑफर कर रहा है। शुरुआत में कंपनी ने रिसर्च और एडवाइजरी पर ज़ोर दिया और फिर 2015 से म्युचुअल फंड्स, PMS (पोर्टफोलियो मैनेजमेंट सर्विसेज़), और एल्गो ट्रेडिंग जैसी सुविधाएं भी जोड़ लीं। इसका प्लेटफॉर्म खासकर उन निवेशकों के लिए डिज़ाइन किया गया है जो एक ही जगह पर टेक्नोलॉजी, रिसर्च और एडवाइस का पूरा पैकेज चाहते हैं।
मुख्य फ़ीचर्स :
एल्गोरिदमिक ट्रेडिंग की सुविधा जिससे ऑटोमेटेड डिसीजन लिए जा सकते हैं।
एक्टिवली मैनेज्ड फंड्स के सुझाव जो मार्केट कंडीशन्स के अनुसार बदलते रहते हैं।
डेली मार्केट अपडेट्स और रिसर्च एनालिसिस जो निवेशकों को अप-टू-डेट रखते हैं।
बेस्ट फॉर: ऐसे इन्वेस्टर्स जो एक ही प्लेटफॉर्म पर ट्रेडिंग, रिसर्च, और फाइनेंशियल एडवाइजरी जैसी सर्विसेज़ चाहते हैं, उनके लिए एडेलवाइस एक भरोसेमंद और प्रैक्टिकल विकल्प है।
14. ग्रो (Groww)
ग्रो (Groww) की शुरुआत 2016 में चार एक्स-फ्लिपकार्ट कर्मचारियों ने की थी, और कुछ ही सालों में यह युवाओं और नए इन्वेस्टर्स के बीच सुपर पॉपुलर हो गया। इसकी सबसे बड़ी खासियत है बेहद सिंपल और क्लीन यूज़र इंटरफेस, जिससे कोई भी बिना ज़्यादा टेक्निकल नॉलेज के भी आसानी से इन्वेस्ट करना शुरू कर सकता है। इस ऐप के ज़रिए यूज़र्स स्टॉक्स, म्युचुअल फंड्स, ETF जैसी कई इन्वेस्टमेंट ऑप्शन्स का फायदा उठा सकते हैं, वो भी मिनिमल चार्जेस के साथ।
मुख्य फ़ीचर्स :
स्टॉक्स, म्युचुअल फंड्स और ETF में आसान इन्वेस्टमेंट की सुविधा।
क्रेडिट, बिल पेमेंट और UPI जैसी बेसिक फाइनेंशियल सर्विसेज़ भी मौजूद।
न्यूनतम फीस स्ट्रक्चर – लॉन्ग टर्म इन्वेस्टर्स के लिए किफायती।
बेस्ट फॉर : जो निवेशक चाहते हैं कि उनका पूरा इन्वेस्टमेंट पोर्टफोलियो एक ही सिंपल ऐप में मैनेज हो सके, उनके लिए ग्रो (Groww) एक शानदार चॉइस है।
15. पेटीएम मनी
पेटीएम मनी की शुरुआत 2017 में डायरेक्ट म्युचुअल फंड इन्वेस्टमेंट प्लेटफ़ॉर्म के रूप में हुई थी, जिसे Paytm की पैरेंट कंपनी One97 Communications ने लॉन्च किया था। शुरुआती दौर में इसका मकसद था – हर किसी को म्युचुअल फंड्स में कम लागत पर इन्वेस्ट करने का मौका देना। फिर 2019 में कंपनी ने कम ब्रोकरेज के साथ स्टॉक ट्रेडिंग सर्विस भी शुरू की। आज यह ऐप एक सिंपल, किफायती और ऑल-इन-वन इन्वेस्टमेंट प्लेटफॉर्म बन चुका है।
मुख्य फ़ीचर्स:
यूज़र-फ्रेंडली ऐप जो नए यूज़र्स के लिए भी पूरी तरह सहज।
डायरेक्ट म्युचुअल फंड इन्वेस्टमेंट जिससे एक्स्ट्रा कमीशन नहीं देना पड़ता।
SIP और लंपसम इन्वेस्टमेंट के लिए स्मार्ट कैलकुलेटर्स की सुविधा।
बेस्ट फॉर : जो लोग म्युचुअल फंड्स और स्टॉक्स में कम खर्च में इन्वेस्ट करना चाहते हैं और एक सिंपल ऐप से सब कुछ मैनेज करना पसंद करते हैं, उनके लिए Paytm Money एक बढ़िया विकल्प है।
ट्रेडर्स के लिए 3 सर्वश्रेष्ठ ब्रोकर नीचे दिए गए हैं:
1. ज़ेरोधा : ज़ेरोधा भारत का सबसे बड़ा डिस्काउंट ब्रोकिंग प्लेटफॉर्म है, जो अपनी किफायती ब्रोकरेज फीस और भरोसेमंद सर्विस के लिए जाना जाता है। लाखों ट्रेडर्स इसे अपनी पहली पसंद मानते हैं। यहां आपको ट्रेडिंग के लिए कई एडवांस टूल्स मिलते हैं, जैसे Sensibull जो ऑप्शन ट्रेडिंग को आसान बनाता है, Streak जो आल्गोरिदमिक ट्रेडिंग की सुविधा देता है, और KITE जो एक पावरफुल वेब और मोबाइल ऐप है। साथ ही, इसकी एजुकेशनल साइट Varsity नए ट्रेडर्स के लिए सीखने का बेहतरीन माध्यम है।
2. पॉकेटफुल (Pocketful) : पॉकेटफुल एक नया लेकिन तेजी से लोकप्रिय हो रहा फिनटेक प्लेटफॉर्म है, जो बिना किसी इक्विटी डिलीवरी फीस के ट्रेडिंग का मौका देता है। इसे पेस फाइनेंशियल ग्रुप ने बनाया है, जिनका 30 से ज्यादा सालों का अनुभव इस प्लेटफॉर्म की विश्वसनीयता को बढ़ाता है। पॉकेटफुल का यूज़र-फ्रेंडली इंटरफेस और विविध निवेश विकल्प इसे नए और अनुभवी दोनों तरह के इन्वेस्टर्स के लिए आकर्षक बनाते हैं।
3. अपस्टॉक्स : अपस्टॉक्स भी किफायती ब्रोकरेज के साथ ट्रेडर्स को एक स्मूद और तेज़ ट्रेडिंग एक्सपीरियंस देता है। इसमें एडवांस चार्टिंग टूल्स के साथ Tick-by-Tick Engine नामक फीचर है, जो आपको लाइव मार्केट डेटा और ऑर्डर बुक की गहराई दिखाता है। यह सुविधा पहले सिर्फ बड़े संस्थागत निवेशकों के लिए थी, लेकिन अब हर रिटेल ट्रेडर इसका फायदा उठा सकता है।
इन्वेस्टर्स के लिए सबसे बढ़िया 3 विकल्प
इन्वेस्टर्स के लिए 3 सर्वश्रेष्ठ ब्रोकर नीचे दिए गए हैं:
1.पॉकेटफुल : अगर लॉन्ग-टर्म इन्वेस्टमेंट करना है तो पॉकेटफुल एकदम सही चॉइस है। ये मॉडर्न फिनटेक प्लेटफॉर्म है जिसमें ना कोई अकाउंट ओपनिंग फीस है, ना AMC (एनुअल मेंटेनेंस चार्ज) और ना ही डिलिवरी फीस। पॉकेटफुल की टेक्नोलॉजी बहुत एडवांस्ड है, जिसे 27+ साल के एक्सपीरियंस वाले एक्सपर्ट्स ने डेवलप किया है। यहाँ से आसानी से मल्टिपल एसेट क्लासेज़ में इन्वेस्टमेंट कर सकते हैं, जिससे यूजर एक्सपीरियंस स्मूद और बेहतर होता है।
2. मोतीलाल ओसवाल : मोतिलाल ओसवाल भारत के सबसे भरोसेमंद और अनुभवी ब्रोकर्स में से एक है। यहाँ आपको सिर्फ ट्रेडिंग ही नहीं, बल्कि पोर्टफोलियो मैनेजमेंट, एडवाइजरी सर्विसेज और गहरी रिसर्च रिपोर्ट्स भी मिलती हैं। इनकी सर्विस खासकर उन इन्वेस्टर्स के लिए सही है जो लंबी अवधि के लिए स्मार्ट और सूझ-बूझ से निवेश करना चाहते हैं। इनके मोबाइल ऐप और वेबसाइट दोनों पर यूज़र-फ्रेंडली इंटरफेस मिलता है, जिससे निवेश करना बेहद आसान हो जाता है।
3. आईआईएफएल (India Infoline Finance Limited) : आईआईएफएल उन इन्वेस्टर्स के लिए एक बढ़िया विकल्प है जो रिसर्च और एडवाइजरी को बहुत महत्व देते हैं। कंपनी उन्नत ट्रेडिंग प्लेटफॉर्म के साथ-साथ नियमित मार्केट अपडेट्स और मुफ्त एजुकेशनल सेशंस भी प्रदान करती है। ये खासकर उन लोगों के लिए परफेक्ट है जो मार्केट को समझकर, सूचनाओं के आधार पर अपने निवेश फैसले लेना चाहते हैं।
डीमैट अकाउंट के फायदे
डीमैट अकाउंट के फायदे नीचे दिए गए हैं:
तेजी से ट्रांजैक्शन: ट्रेडिंग के दौरान शेयरों की खरीद-फरोख्त तुरंत होती है, जिससे आप मार्केट के मौकों का लाभ बेहतर तरीके से उठा सकते हैं।
आसान निगरानी: सभी निवेश एक ही डिजिटल प्लेटफॉर्म पर नजर आते हैं, जिससे अपनी पोर्टफोलियो को मैनेज करना सरल होता है।
कम धोखाधड़ी का खतरा: इलेक्ट्रॉनिक रिकॉर्ड होने की वजह से स्टॉक्स चोरी या गुम होने की संभावना लगभग न के बराबर हो जाती है।
खर्चों में बचत: पेपर वर्क न होने के कारण लेन-देन से जुड़ी कई अतिरिक्त फीस बच जाती है।
डीमैट अकाउंट के बिना स्टॉक मार्केट में निवेश करना आज के जमाने में न केवल मुश्किल है, बल्कि जोखिम भी बढ़ जाता है। इसलिए एक भरोसेमंद और सुविधाजनक डीमैट अकाउंट निवेश की शुरुआत करने वालों के लिए सबसे जरूरी टूल है।
अपनी जरूरत के हिसाब से सबसे अच्छा डीमैट अकाउंट कैसे चुनें?
जब डीमैट अकाउंट खोलने की बात आती है, तो हर किसी की जरूरतें अलग होती हैं। इसलिए सही अकाउंट चुनना बहुत जरूरी होता है ताकि आपका निवेश सफर आसान और फायदेमंद रहे।
नीचे कुछ अहम बातों का ध्यान रखें जो आपकी पसंद को सही दिशा देंगे:
फीस और चार्जेस: अकाउंट खोलने और मेंटेन करने की फीस अलग-अलग ब्रोकर्स पर अलग हो सकती है। अपने बजट के हिसाब से ऐसा विकल्प चुनें जो ज्यादा महंगा न हो लेकिन अच्छी सेवा दे।
ट्रेडिंग और इन्वेस्टिंग की सुविधाएं: कुछ डीमैट अकाउंट सिर्फ ट्रेडिंग के लिए बेहतर होते हैं, तो कुछ में म्यूचुअल फंड्स और अन्य निवेश विकल्प भी शामिल होते हैं। अपने निवेश के प्रकार के अनुसार अकाउंट चुनें।
ग्राहक सेवा: जब भी आपको कोई सवाल या समस्या हो, तो ग्राहक सेवा की मदद जल्दी और असरदार मिलनी चाहिए। भरोसेमंद ब्रोकर्स का चुनाव करें जो समय पर सहायता देते हों।
ट्रेडिंग प्लेटफ़ॉर्म की आसानी: तकनीकी ज्ञान के बिना भी आपको अपनी निवेश गतिविधियां सहजता से करनी चाहिए। इसलिए ऐसा प्लेटफ़ॉर्म चुनें जो सरल और समझने में आसान हो।
रिसर्च और एडवाइजरी: अगर आप मार्केट की जानकारी लेकर ही निवेश करना पसंद करते हैं, तो ऐसे ब्रोकर्स चुनें जो अच्छे रिसर्च और सलाह देते हों।
इन बातों को ध्यान में रखकर आप अपनी ज़रूरतों और निवेश के तरीके के अनुसार सही डीमैट अकाउंट चुन सकते हैं, जो आपके लिए लंबी अवधि में फायदे का सौदा साबित होगा।
निष्कर्ष
इस ब्लॉग में हमने भारत के प्रमुख डीमैट अकाउंट्स और उनके खास फीचर्स पर विस्तार से चर्चा की है। सही डीमैट अकाउंट चुनना आपके निवेश सफर की सफलता के लिए बेहद जरूरी है। हर निवेशक की जरूरत और प्राथमिकताएं अलग होती हैं, इसलिए आपको अपने निवेश के तरीके, फीस स्ट्रक्चर, और उपलब्ध सेवाओं को ध्यान में रखकर निर्णय लेना चाहिए। टेक्नोलॉजी, ग्राहक सेवा, और रिसर्च सपोर्ट भी अकाउंट चुनते समय अहम रोल निभाते हैं। उम्मीद है यह जानकारी आपको समझदारी से अपने लिए सबसे उपयुक्त डीमैट अकाउंट चुनने में मदद करेगी और आपके निवेश को बेहतर बनाएगी।
डीमैट अकाउंट क्या होता है?
डीमैट अकाउंट एक डिजिटल अकाउंट होता है जिसमें आपके शेयर और सिक्योरिटीज इलेक्ट्रॉनिकली स्टोर होते हैं।
डीमैट अकाउंट खोलने के लिए क्या डॉक्युमेंट्स लगते हैं?
पैन कार्ड, आधार कार्ड, बैंक स्टेटमेंट और एक पासपोर्ट साइज फोटो की ज़रूरत होती है।
क्या डीमैट अकाउंट खोलना फ्री होता है?
कई ब्रोकर्स फ्री अकाउंट ओपनिंग ऑफर करते हैं, लेकिन कुछ में एएमसी (अकाउंट मेंटेनेंस चार्जेस) लग सकते हैं।
क्या एक व्यक्ति के पास मल्टीपल डीमैट अकाउंट्स हो सकते हैं?
हाँ, एक व्यक्ति अलग-अलग ब्रोकर्स के साथ मल्टीपल डीमैट अकाउंट्स रख सकता है।
बिगिनर्स के लिए बेस्ट डीमैट अकाउंट कौन सा है?
बिगिनर्स के लिए पॉकेटफुल, अपस्टॉक्स और ज़ेरोधा जैसे ईज़ी-टू-यूज़ प्लेटफॉर्म्स बेस्ट माने जाते हैं।
Open Free Demat Account
Join Pocketful Now
You have successfully subscribed to the newsletter
There was an error while trying to send your request. Please try again.