Equity markets have a history of being highly volatile during periods of adverse geopolitical events, unfavorable economic conditions, etc., due to which every investor prefers to allocate some portion of their portfolio to Gold as it is considered a safe haven. There are various modes through which one can invest in digital Gold. The two most popular options to invest in gold are Gold ETFs and Gold Mutual Funds.
In this blog, we will give you an overview of both Gold Mutual Fund and Gold ETFs, along with their similarities and differences.
Key Differences Between Gold Mutual Fund and Gold ETFs
The major difference between Gold Mutual Fund and Gold ETFs is as follows:
| Particular | Gold Mutual Fund | Gold ETF |
|---|---|---|
| Mode | It can be purchased through Asset Management Companies, online platforms, etc. | It can be easily bought and sold on the stock exchange. |
| Demat Account | A Demat account is not required to invest in the Gold Mutual Fund. | It is mandatory to have a demat account for investment in a Gold ETF. |
| Expenses | It generally has a high expense ratio as it includes the charges of both the ETF and mutual fund’s expense ratio. | It typically has a lower expense ratio than the Gold Mutual Fund. |
| Price | The price of the Gold Mutual Fund is adjusted at the end of the day and is known as NAV. | The prices of Gold ETFs can be tracked in real-time during trading hours. |
| Investment Timing | Investment can be made at any time during the day. | Investment and redemption can be done during the trading hours only. |
| Exit Load | Some Gold Mutual Funds may have an exit load, which is decided by the AMC. | There is no exit load applicable in the Gold ETF. |
Similarities Between the Gold Mutual Fund and the Gold ETF
There are various similarities between Gold Mutual Fund and Gold ETF; a few of such similarities are mentioned below:
- Investment in Gold: Both Gold ETF and Gold Mutual Funds invest the amount in physical Gold directly or indirectly through exchange-traded derivatives. Their returns are dependent on how the domestic gold prices have performed.
- Zero Risk: Investing in both Gold ETFS and Gold Mutual Funds offers peace of mind as here is no risk of theft or storage costs.
- Tax Treatment: Both the Gold Mutual Fund and the Gold ETF are taxed in the same manner.
- High Liquidity: Gold ETFs and Gold Mutual Funds are highly liquid and can be converted easily into cash.
- Well Regulated: Both investment options are well regulated by the Securities and Exchange Board of India (SEBI).
What is a Gold Mutual Fund?
Gold Mutual Fund is a type of mutual fund that collects money from the general public, and the fund managers invest the accumulated amount into gold, gold-related assets, and gold ETFs to generate returns similar to gold. It is a type of open-ended fund in which anyone can invest and withdraw money at any point in time. If investors do not have a demat account, they can invest in the Gold Mutual Fund and can earn returns similar to those of physical gold.
Features of the Gold Mutual Fund
The significant features of the Gold Mutual Fund are as follows:
- Portfolio Diversification: One can easily diversify their portfolio through gold mutual funds.
- No Demat Account: You can invest in Gold mutual funds even if you do not have a demat account.
- Net Asset Value: In a Gold mutual fund, you can invest based on their daily NAV, which is updated at the end of each trading day.
- SIPs: One can easily invest in Gold mutual funds through monthly SIPs.
What is a Gold ETF?
Gold ETF or Gold Exchange Traded Fund is an investment option which allows an investor to invest in ETF units that tracks the domestic price of physical gold. As gold ETF tracks the performance of physical gold, its returns are similar to that of physical gold. Gold ETFs can be easily bought and sold on the stock exchange like any other ordinary share. There is another term which is very famous among investors: Gold BEES, which is one of the oldest and well-known Gold ETFs in India. It was launched on 8 March 2007 and is managed by Nippon India Mutual Fund.
Features of Gold ETF
The key features of Gold ETF are:
- Physical Gold: The Gold ETF is backed by physical gold; hence ensures that investors get returns similar to that of physical gold.
- Exchange Traded: The ETFs are traded on the stock exchange, like any other share, which means you can easily buy and sell the units of the Gold ETF during the trading session.
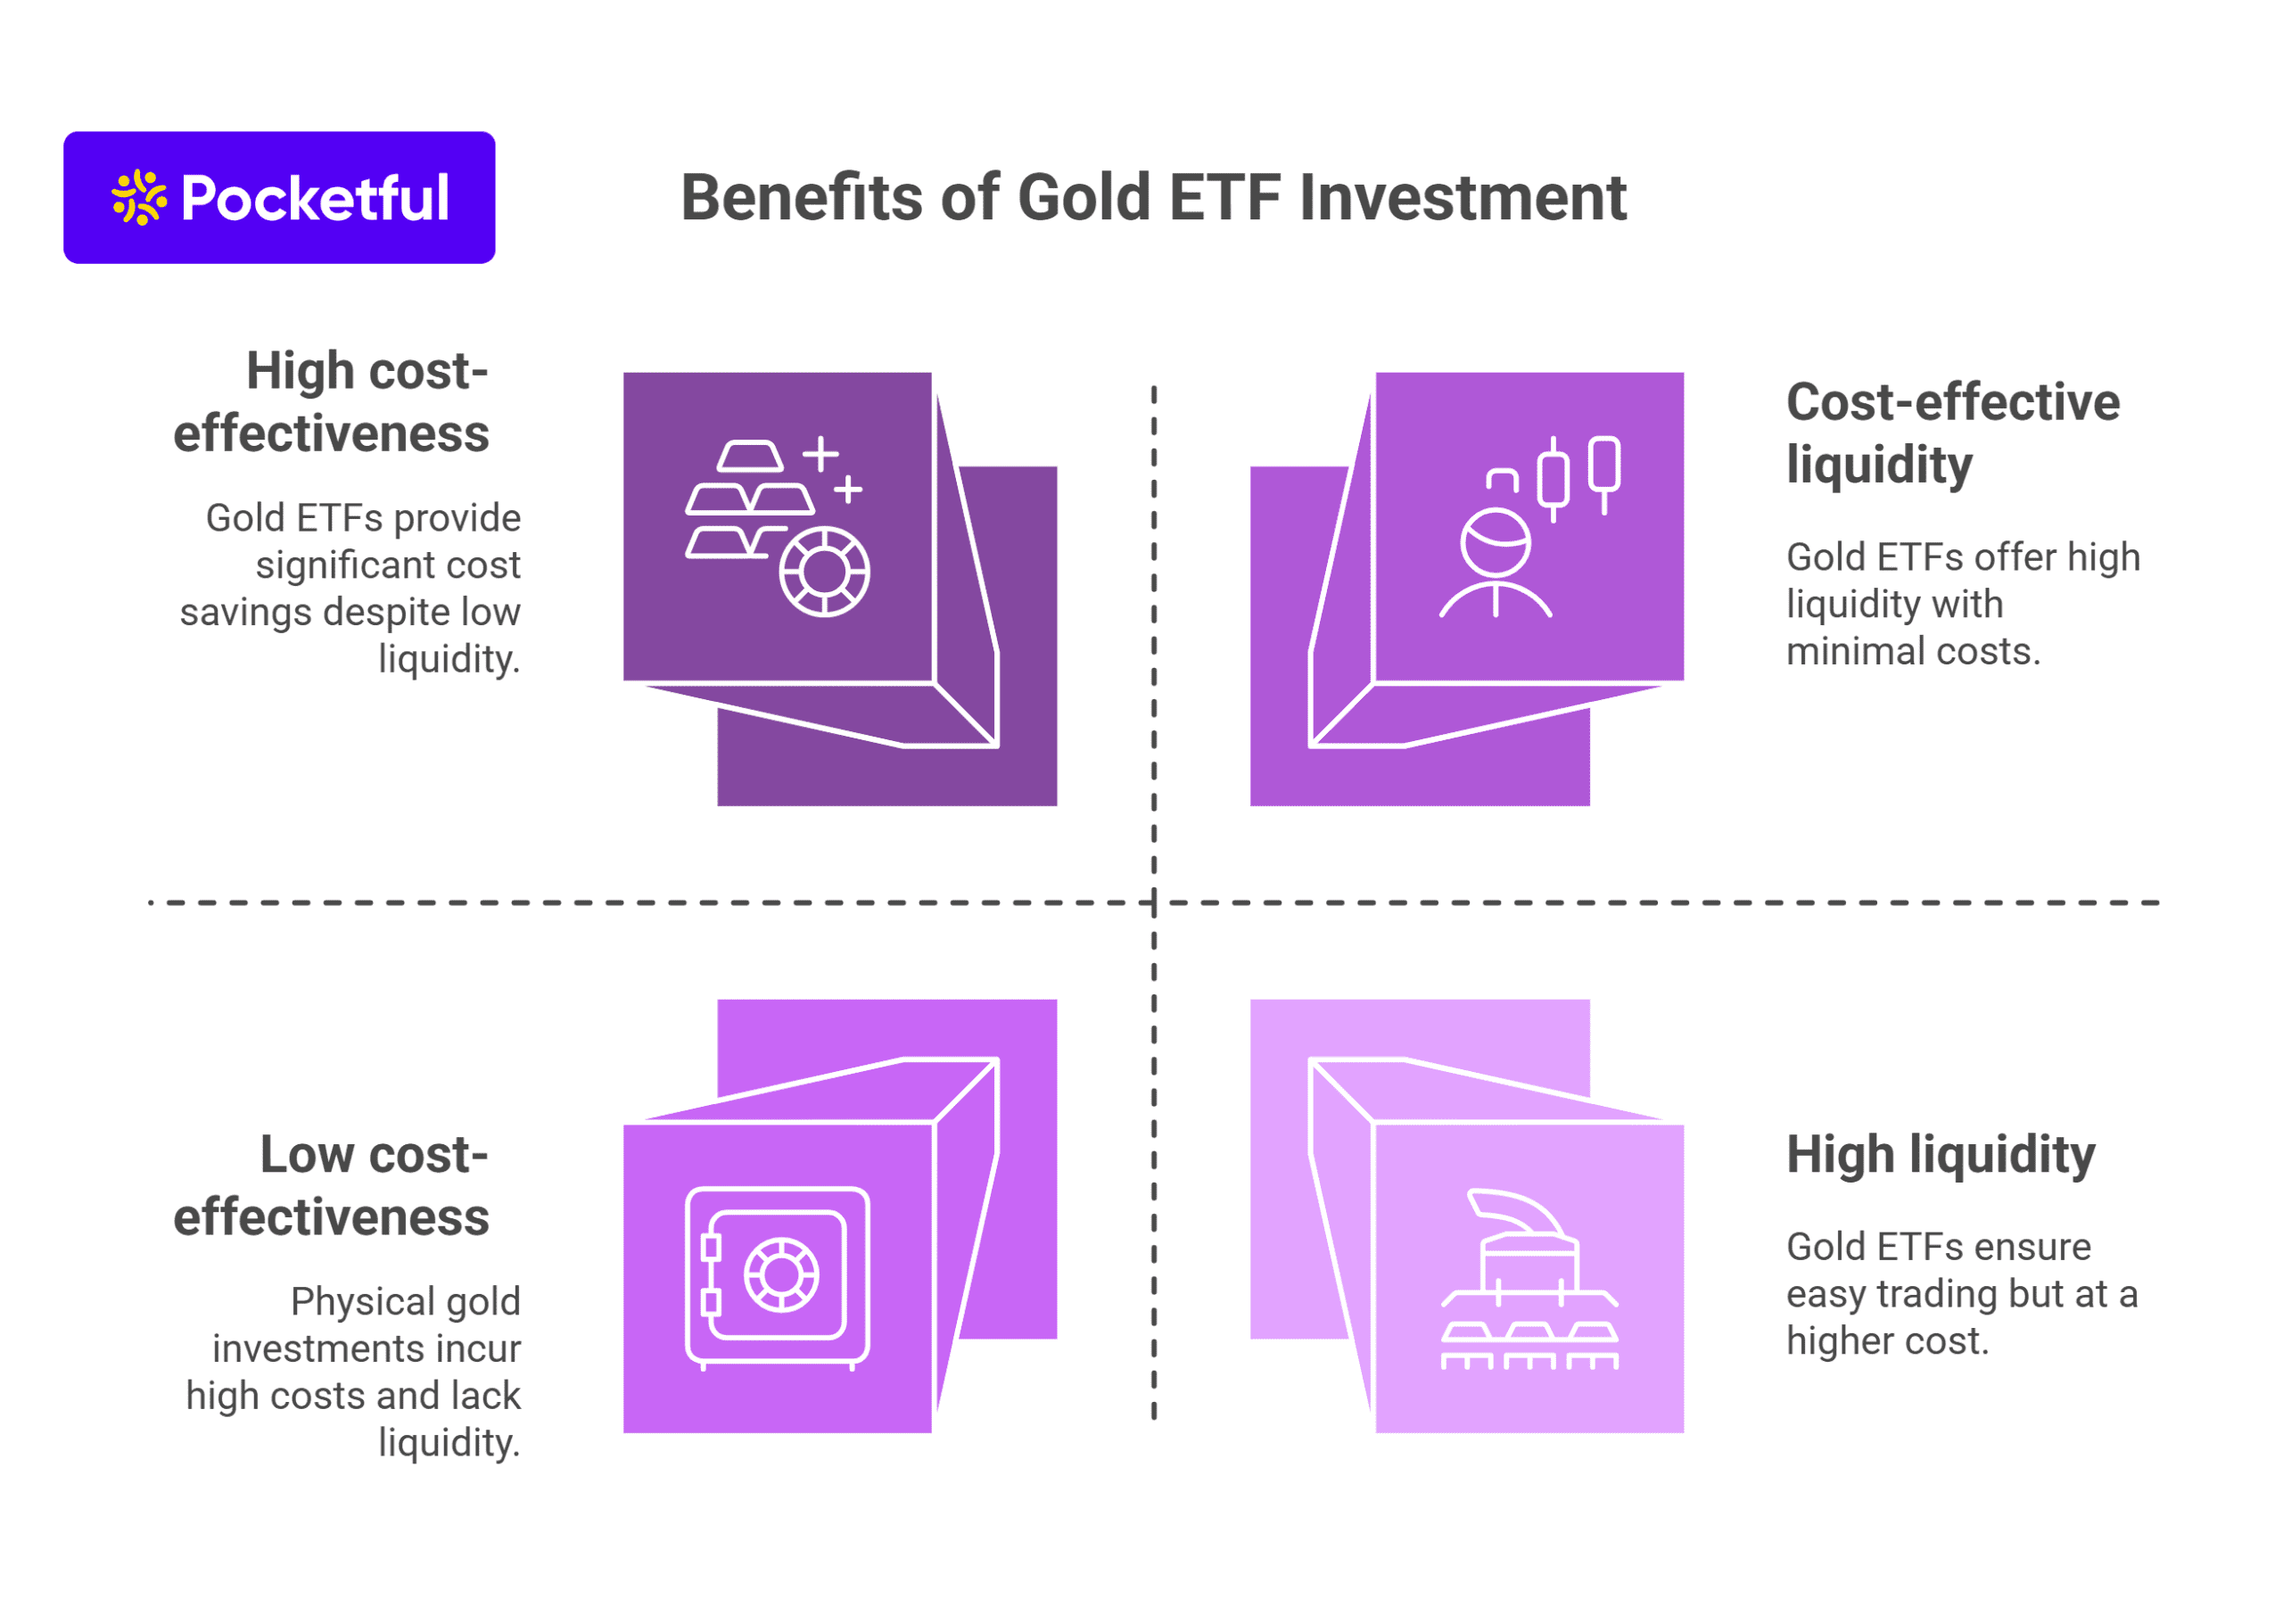
- Low Cost: Investors in gold ETF only incur a nominal expense ratio and do not incur storage costs or risk of theft associated with owning physical gold.
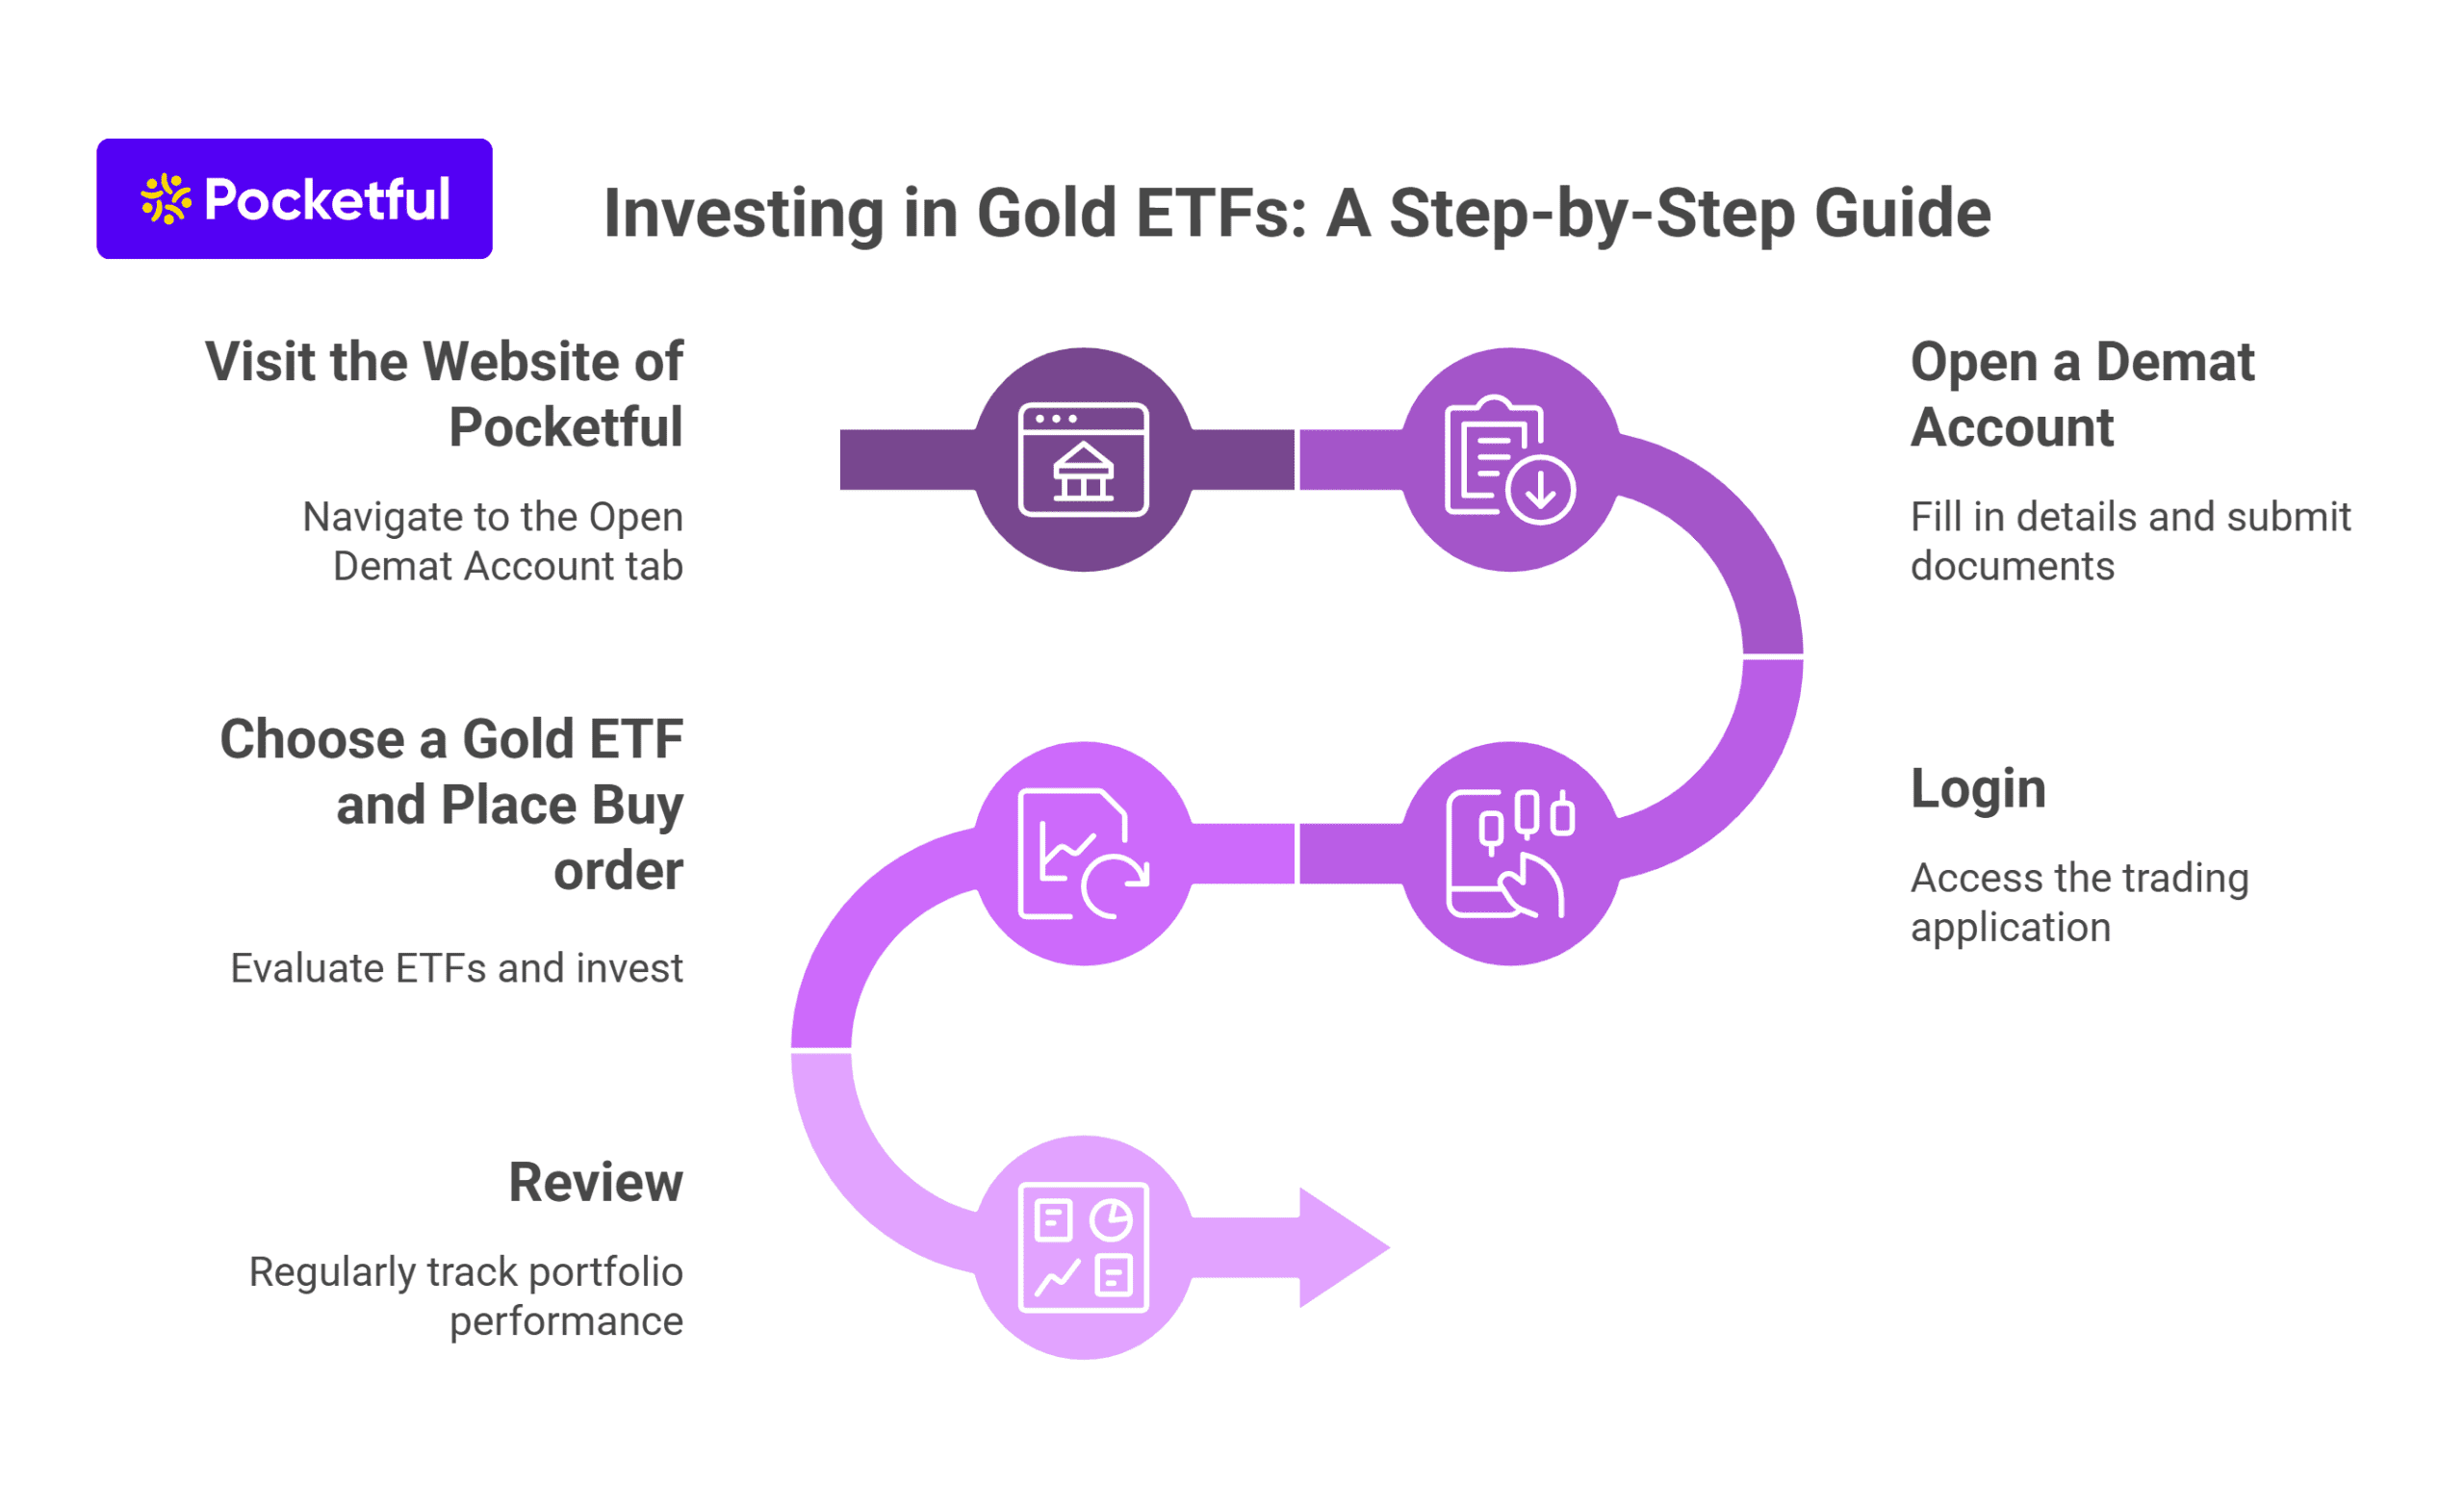
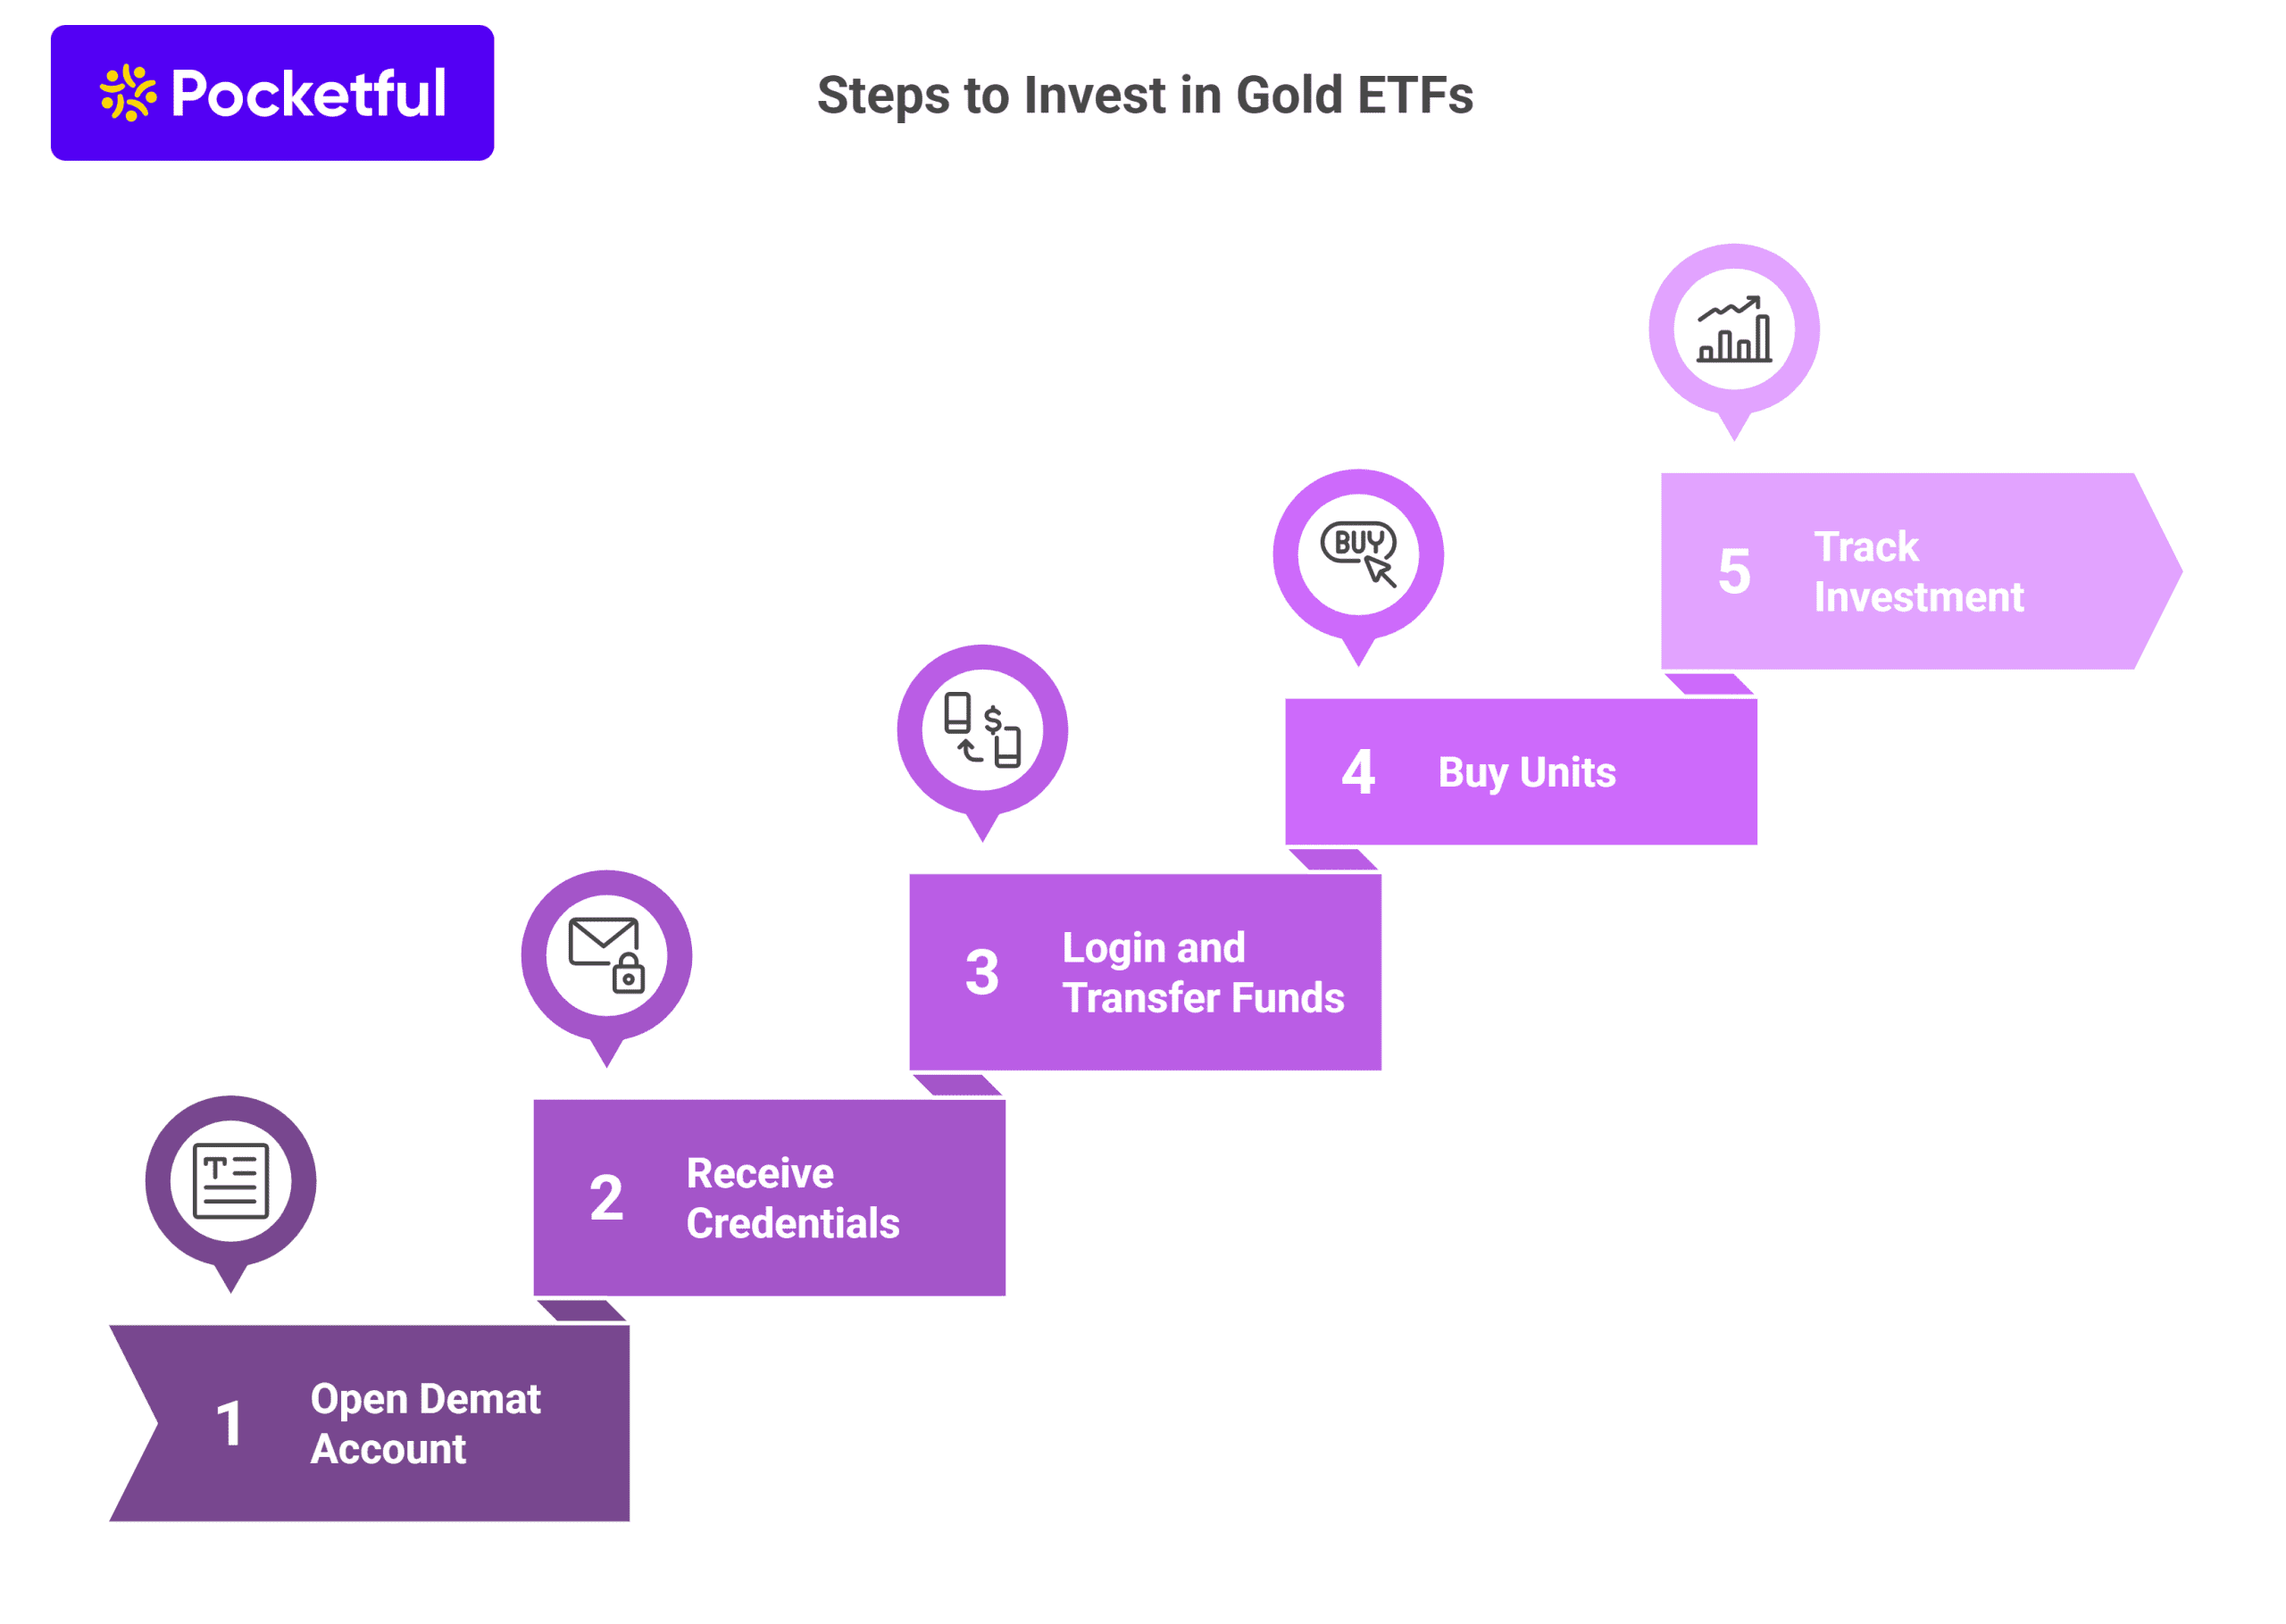
- Demat Account: To invest in Gold ETF, you must have a demat and trading account with a stockbroker which facilitates the buying and selling of Gold ETF.
Read Also: How to Invest in Gold ETF – Benefits, Risks and Charges
Which one is Better for You?
If you do not wish to have a demat and trading account, then you can easily invest in a Gold Mutual Fund. It does not require constant monitoring and regular investments can be made using SIP, etc. However, it carries higher expense ratios and exit loads as compared to Gold ETFs. On the other hand, if you want to actively track, buy and sell, then you can easily invest in a Gold ETF. To invest in Gold ETF, you are required to open a trading and demat account where you can hold Gold ETFs. Both of the options are equally good for all types of investors; choosing among them depends on individuals’ preferences and choices.
Read Also: Gold BeES vs Gold ETF: Meaning, How It Works, Taxation
Conclusion
On a concluding note, Gold ETFs and Gold Mutual Funds are suitable for investors who wish to invest in digital Gold. Those who prefer to invest in Gold through a Demat account can opt for investing in a Gold ETF, and those who don’t have a Demat account can invest in a Gold Mutual Fund. Both of these are backed by physical Gold and their returns depend on the domestic price of Gold. It is advisable to consult your investment advisor before making any investment in Gold.
Frequently Asked Questions (FAQS)
Which has a lower expense ratio between the Gold ETF and the Gold Mutual Fund?
Gold ETFs generally have a lower expense ratio when compared to Gold Mutual Funds, as it has additional costs such as fund management fees along with the charges of its underlying Gold ETFs.
Is a demat account required to invest in the Gold Mutual Fund?
No, a demat account is not required to invest in the Gold Mutual Fund, however, it is mandatory to have a demat and trading account if you wish to invest in Gold ETF.
Are the returns of both the Gold Mutual Fund and the Gold ETF similar to the returns of physical Gold?
The returns of both the Gold Mutual Fund and the Gold ETF may vary slightly from the return of physical gold because of tracking error.
Is it safe to invest in a Gold ETF and a Gold Mutual Fund?
Yes, investment in Gold ETF and Gold Mutual Fund can be considered safe, as both of them are regulated by the Securities and Exchange Board of India (SEBI).
What is the major difference between a Gold ETF and a Gold Mutual Fund?
A Gold ETF can be traded on the stock exchange and requires a Demat account to invest, whereas investing in Gold mutual funds can be done through asset management companies.