Water is indispensable for human survival and essential for sustaining economic growth. Rising industrial activities and changing weather patterns have made efficient water management now more important than ever. But have you heard about listed companies that are involved in wastewater management and associated processes?
Water-related stocks are gaining growing attention from investors who are not only seeking strong returns but also aiming to make a meaningful environmental impact. In this blog, we will analyze the top 10 water-related companies in India and their performance so as to effectively guide your investment decisions.
What are Water Stocks?
Water-related stocks represent the companies that are involved in various activities concerning water, such as:
- Water treatment
- Construction of water distribution systems (such as pipes and water storage, dams, and reservoirs).
- Pumps, valves and other water control mechanisms.
- Managing wastewater.
- Desalination.
Investing in these shares can offer substantial long-term returns while supporting water availability and quality, aligning both economic and ecological interests.
Top 10 Water-Related Stocks to Buy for the Long Term
Here’s a curated list of the top 10 water-related stocks in India for 2026 based on market capitalization:
| Company Name | Current Market Price (₹) | Market Capitalization (₹ Crores) | 52 Week High (₹) | 52 Week Low (₹) |
|---|---|---|---|---|
| Thermax Ltd | 2,972 | 35,411 | 4,247 | 2,743 |
| Welspun Corp Ltd | 739 | 19,485 | 995 | 664 |
| Shakti Pumps (India) Ltd | 711 | 8,771 | 1,207 | 548 |
| Praj Industries Ltd | 308 | 5,668 | 807 | 293 |
| Va Tech Wabag Ltd. | 1,197 | 7,458 | 1,680 | 1,109 |
| Ion Exchange (India) Ltd | 352 | 5,156 | 658 | 331 |
| Jash Engineering Ltd | 405 | 2,547 | 699 | 398 |
| EMS Ltd | 380 | 2,110 | 875 | 380 |
| Indian Hume Pipe Company Ltd | 395 | 2,083 | 490 | 281 |
| Felix Industries Ltd | 181 | 312 | 220 | 108 |
Overview of the Top 10 Water-Related Stocks in India
An overview of the top 10 water-related stocks in India is:
1. Thermax Ltd
Thermax is headquartered in Pune; their services include water treatment, wastewater recycling, liquid waste elimination (zero liquid discharge), and desalination through their plants, which are equipped with the latest technologies. This company also designs, builds and commissions large boilers for steam and power generation, turnkey power plants and waste heat recovery systems. This company sets itself apart in the market through innovation and overcoming challenges related to the sustainability of clean water sources, resulting in an increased demand for its services.
Know the Returns:
| 1Y Return (%) | 3Y Return (%) | 5Y Return (%) |
|---|---|---|
| -21.68% | 49.79% | 189.51% |
2. Welspun Corp Ltd
As a primary supplier of large diameter pipes, The Welspun Group is engaged in water transportation projects within the country and abroad. The company’s product lines include SAWL, SAWH, HFW pipes, and ductile iron pipes, which are used in the oil & gas and water industries. Through its excellent quality and innovative products, Welspun ensures dependable infrastructure for the water distribution systems.
Know the Returns:
| 1Y Return (%) | 3Y Return (%) | 5Y Return (%) |
|---|---|---|
| 0.85% | 240.39% | 437.98% |
3. Shakti Pumps (India) Ltd
Shakti Pumps is a well-known manufacturer of energy-efficient pumps specializing in solar-powered and electric pumps. The company also provides submersible, solar, and pressure booster pump systems for agricultural, industrial, and domestic use. Shakti Pumps’ renewable energy initiatives further support India’s sustainable water management goals.
Know the Returns:
| 1Y Return (%) | 3Y Return (%) | 5Y Return (%) |
|---|---|---|
| -38.78% | 945.22% | 1.058.52% |
4. Praj Industries Ltd
From its outset, Praj Industries has been involved in bioenergy generation and water treatment, specializing in wastewater treatment and zero liquid discharge (ZLD) systems. The company designs ZLD systems utilizing multiple methods, including recycling, reuse, evaporation, and crystallization. Praj’s emphasis on sustainable water management practices corresponds with the growing concern for the environment and the efficient treatment of wastewater.
Know the Returns:
| 1Y Return (%) | 3Y Return (%) | 5Y Return (%) |
|---|---|---|
| -57.74% | -13.12% | 143.75% |
5. Va Tech Wabag Ltd
Va Tech Wabag is one of the few companies worldwide with expertise in transforming seawater into condensed reusable water via treatment plants. This company has operations in more than 63 countries with over 6,500 projects spanning across the globe, serving over 88 million people.
Wabag focuses on municipal and industrial water treatment using energy-neutral wastewater treatment plants and advanced desalination technologies. Their commitment to sustainable water management strengthens their position in the global context.
Know the Returns:
| 1Y Return (%) | 3Y Return (%) | 5Y Return (%) |
|---|---|---|
| 18.45% | 253.94% | 450.44% |
6. Ion Exchange (India) Ltd
Ion Exchange is a pioneer in the water treatment industry, providing services that include water purification as well as wastewater treatment. The company has an impressive international presence and has provided services for numerous sectors for more than 60 years. Ion Exchange is known for its focus on technological innovations as well as environmentally sustainable practices. Their sharp focus ensures effective and eco-friendly water management.
Know the Returns:
| 1Y Return (%) | 3Y Return (%) | 5Y Return (%) |
|---|---|---|
| -43.78% | 26.23% | -81.38% |
7. Jash Engineering Ltd
Jash Engineering focuses on manufacturing of water control gates and valves for water treatment plants, irrigation systems, and hydropower plants. The company has five modernized manufacturing plants that produce penstocks, flap gates, and knife gate valves. Jash Engineering has clients in over 45 countries due to their constant quality services and products and innovative engineering.
Know the Returns:
| 1Y Return (%) | 3Y Return (%) | 5Y Return (%) |
|---|---|---|
| -34.90% | 140.83% | 770.11% |
8. EMS Ltd
EMS Ltd initially focused on providing wastewater treatment, which broadened to sewage treatment and solid waste management. The company designs and constructs water supply and sewerage systems including construction of pressure pipeline networks, water treatment plants, and reservoirs. EMS’s innovative solutions effectively balances the growing need of urban infrastructure needs with sustainability.
Know the Returns:
| 1Y Return (%) | 3Y Return (%) | 5Y Return (%) |
|---|---|---|
| -52.62% | 34.75% | 34.75% |
9. Indian Hume Pipe Company Ltd
Indian Hume Pipe Company (IHPL) has specialized in manufacturing and supply of pipelines for water supply and irrigation since 1926. IHPL has contributed significantly in the water sector by completing numerous water and sewerage projects all over India, and has played an integral role in facilitating efficient water supply systems throughout the nation. They are widely regarded as the one of the most dependable companies in India manufacturing reliable infrastructure and maintaining quality standards.
Know the Returns:
| 1Y Return (%) | 3Y Return (%) | 5Y Return (%) |
|---|---|---|
| 15.99% | 162.83% | 89.14% |
10. Felix Industries Ltd
Focusing on wastewater recycling, Felix Industries offers complete wastewater solutions inclusive of effluent treatment and recycling. The company has undertaken more than 100 sustainable development projects in India and the UAE, which have helped in conservation of the environment. Industrial wastewater recycling by Felix Industries is attuned to the strategies to sustain freshwater resources.
Know the Returns:
| 1Y Return (%) | 3Y Return (%) | 5Y Return (%) |
|---|---|---|
| 7.51% | 77.82% | 436.89% |
Key Performance Indicators (KPI)
| Company Name | Diluted EPS (₹) | Operating Margin (%) | ROE (%) | ROCE (%) |
|---|---|---|---|---|
| Thermax Ltd | 57.28 | 9.45 | 14.53 | 16.24 |
| Welspun Corp Ltd | 42.32 | 8.39 | 19.83 | 18.49 |
| Shakti Pumps (India) Ltd | 76.91 | 15.27 | 18.75 | 27.35 |
| Praj Industries Ltd | 15.42 | 11.17 | 22.23 | 26.96 |
| Va Tech Wabag Ltd. | 39.49 | 14.37 | 13.50 | 16.97 |
| Ion Exchange (India) Ltd | 165.34 | 11.90 | 19.25 | 23.47 |
| Jash Engineering Ltd | 54.55 | 18.30 | 19.01 | 25.32 |
| EMS Ltd | 29.38 | 26.85 | 19.10 | 25.18 |
| Indian Hume Pipe Company Ltd | 15.00 | 12.05 | 9.36 | 18.36 |
| Felix Industries Ltd | 5.77 | 20.02 | 7.60 | 10.61 |
Considerations Before Investing in Water-Related Stocks in India
Before you invest in water-related stocks in India, there are a few factors you must consider for making an informed investment decision:
- Government Policies on Infrastructure Development: The Government of India has put in place favorable policies like the Jal Jeevan Mission, Namami Gange, and Smart City initiatives that benefit companies through developing water infrastructure projects. Not only do these policies cater to the long-term water requirements, but they also ensure project funding.
- The Core Business of the Company and Diversification Level: Companies only involved in niche operations stand to gain high returns if the sector expands, but have more sector-specific risks. On the other hand, profits of diversified companies, with multiple business segments, experience low volatility during economic slowdowns, but also deliver slow returns.
- Order Book and Revenue Pipeline: The completion of the order book for Indian Hume Pipe and Jash Engineering is strongly dependent on their future earnings and funding from government and private sectors. Tracking timelines is equally critical as an unanticipated cancellation of the project or execution delays can impact profitability.
- Technological Edge and Innovation: More R&D spending in water treatment and recycling technologies such as smarter pumping and zero-liquid discharge systems is required for better scalability & margin growth.
- Export Capabilities and Global Presence: An Increase in exports operations provides more shield against domestic slowdowns which in turn adds stability. Additionally, contracts from other countries are often more profitable if the foreign currency appreciates.
- Environment, Social, and Governance (ESG) Focus: Some investors believe in impact investing and constantly search for companies with operations addressing ESG issues. Companies focused on the areas of wastewater recycling, industrial effluent treatment, and green energy solutions will likely benefit from ESG portfolio shifts.
- Financial Ratios and Balance Sheet Strength: Evaluating a firm’s health before investing is prudent. One should assess the
- Debt-to-equity ratio – lower is better,
- Profit margins, Return on Equity (RoE),
- Revenue growth consistency over a period of 3 to 5 years.
Advantages and Disadvantages of Investing in Water-Related Companies
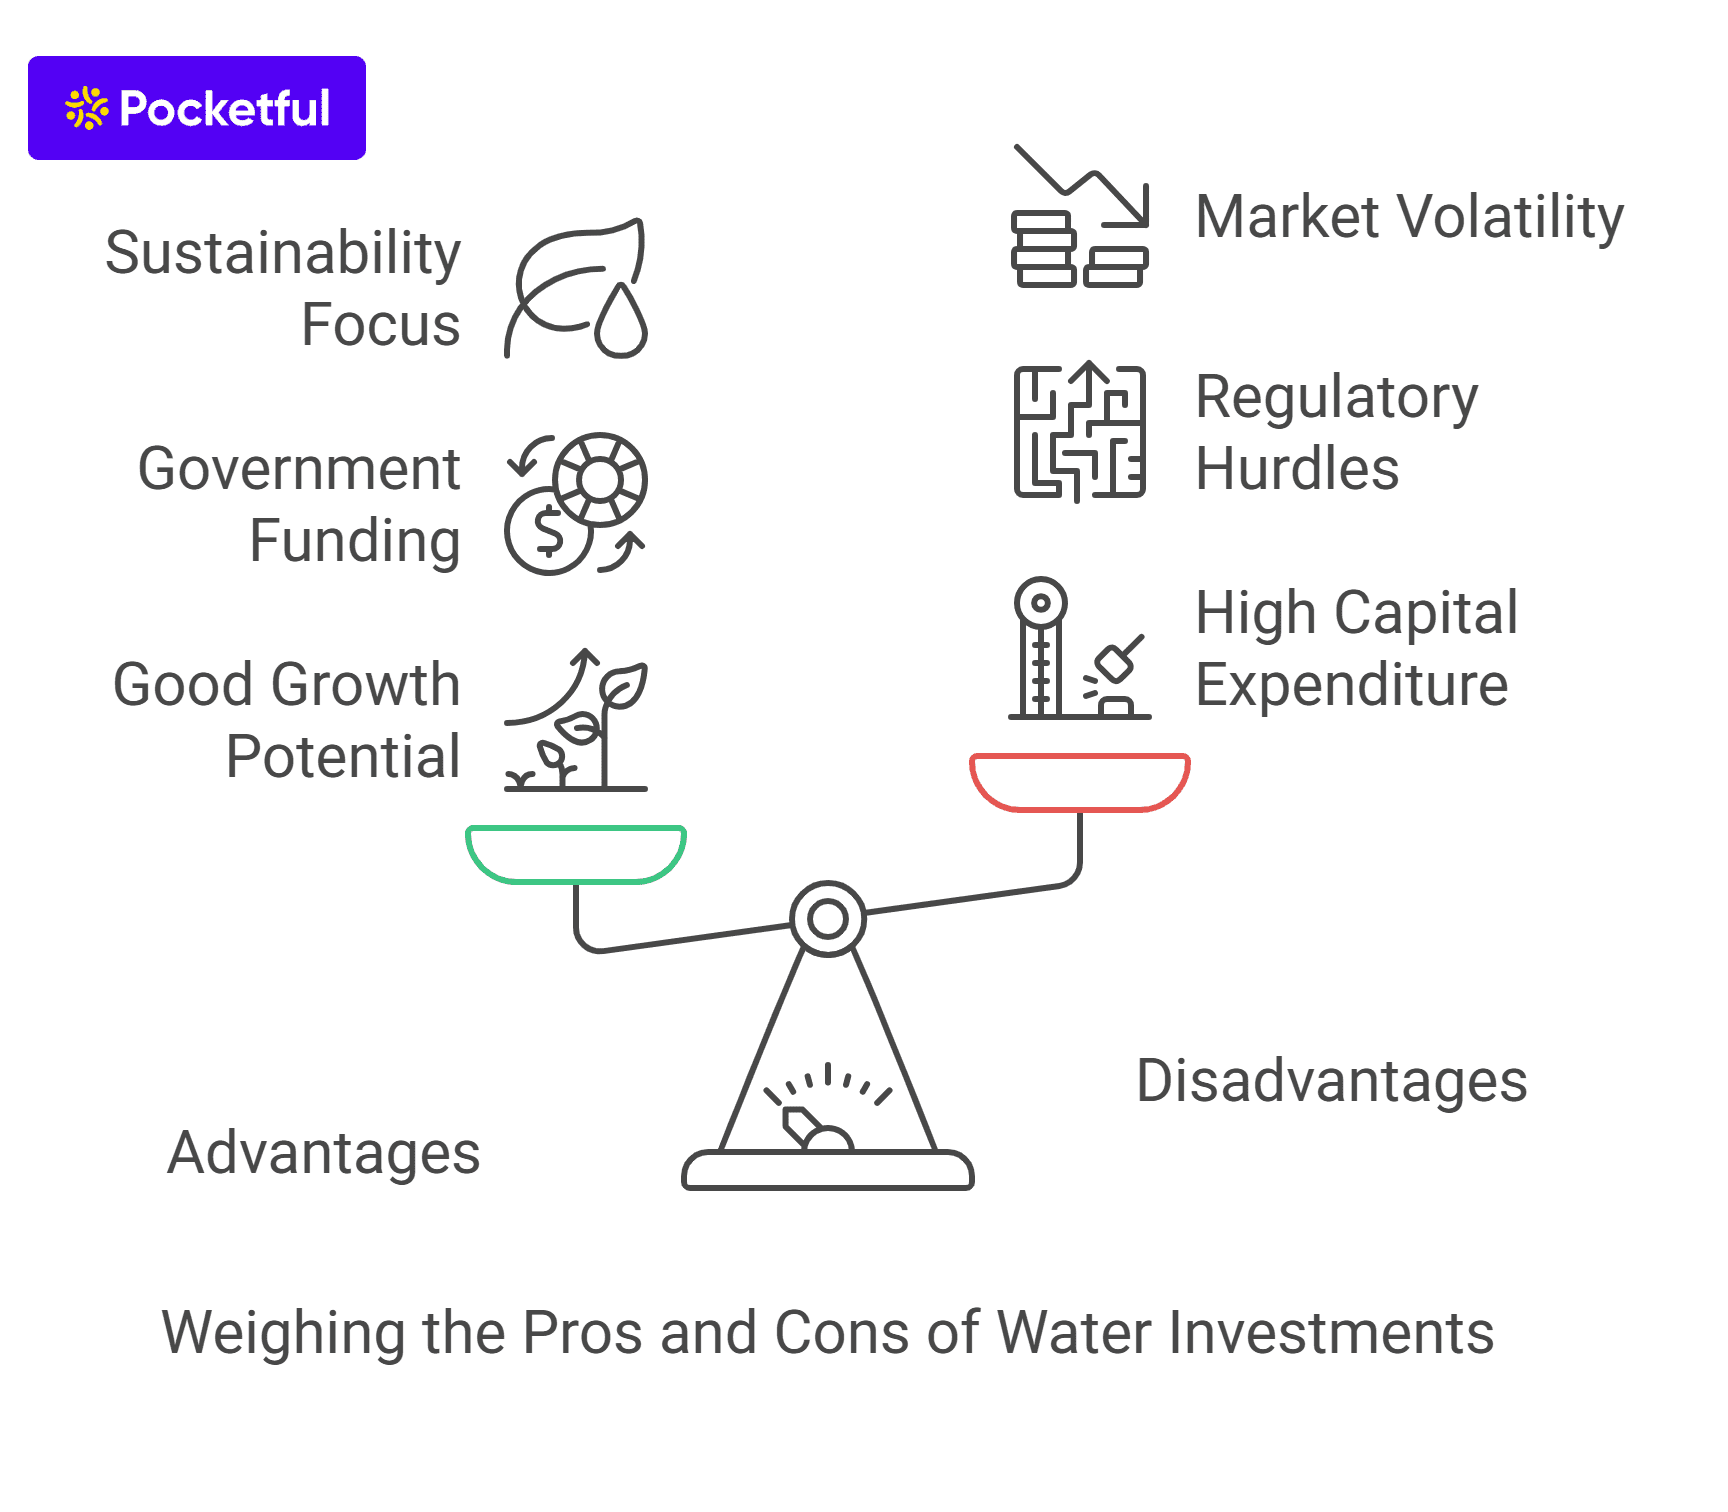
Advantages
- Water Related Stocks have a Good Growth Potential: Water is a critical resource, especially in metropolitan and urban regions, where the demand for the resource is expected to rise substantially in the years to come. Companies such as Va Tech Wabag and Ion Exchange are strategically positioned to meet this long-term demand, showing potential growth opportunities.
- Government Funding of Water Projects: Initiatives such as Jal Jeevan Mission and Smart Cities Program are positively working toward funding the water industry.
- Sustainability Focus: With the rapid growth in ESG investing, companies related to water naturally fit within ESG frameworks making them sustainable for the future.
- Export Opportunities: Several of these companies, such as Ion Exchange and Thermax, have an international presence which lessens reliance on domestic markets. A diversified clientele provides additional strength during periods of economic slowdowns.
Disadvantages
- High Capital Expenditure: Establishing pumping stations or water treatment plants incurs high capital costs, which might affect cash flows of smaller companies like Felix Industries during slow-growth phases.
- Regulatory Hurdles: Strict regulations often create operational challenges due to compliance concerns and impact project timelines.
- Market Volatility: Some water-related stocks are very volatile, especially small-cap companies like EMS Ltd or Jash Engineering. Conservative investors may consider it risky to have their portfolios tied up in equities that have higher price fluctuations than established blue-chip stocks.
- Technology Obsolescence: Failure to invest in the latest solutions can erode a company’s competitive edge. Without innovation in a fast-changing industry, profitability and investor confidence wanes over time.
Conclusion
In India’s infrastructure and sustainable development narrative, water emerges as the next key area of focus. In light of growing environmental concerns and public spending, water equities in India become more pertinent than ever in 2025.
For those willing to invest in water-related stocks in India, the Pocketful offers you the facility to buy these shares through their easy to use stock market mobile application.
Frequently Asked Questions (FAQs)
What companies constitute water-related stocks, and what is the reason for their prominence in 2025?
Water-related stocks refer to companies that deal with the treatment, distribution, storage, or management of water resources. In 2025, these stocks are gaining prominence due to the private sector’s growing involvement and concern about water scarcity, along with government initiatives like Jal Jeevan Mission.
Which sectors fall under the water investment theme in India?
Core sectors comprise water infrastructure (pipelines, pumps, valves), water treatment (purification, extraction, secondary wastewater treatment), utilities (urban water supply), and industrial services (EPC firms executing water projects).
Identify the most prominent companies in India that deal with water?
Prominent companies are VA Tech Wabag (wastewater treatment and desalination), Ion Exchange (India) Ltd. (water treatment solutions), Engineers India Ltd. (EPC services in water projects), Thermax Ltd. (water and wastewater treatment), Tata Projects / L&T (water infra through EPC contracts).
What initiatives by the government are augmenting growth in this field?
Jal Jeevan Mission, Namami Gange, Smart Cities Mission, and similar flagship schemes are launched by the Government to expand water infrastructure and support water treatment companies.
What are the challenges related to investing in water-related stocks?
Some challenges are project delays because of regulations, too much dependence on government contracts, decreasing profit margins on EPC projects, and scalability limitations in specialized areas.


![Top 10 Cement Penny Stocks in India Below ₹50 [2026 List]](https://cms-resources.pocketful.in/blog/wp-content/uploads/2025/04/cement-penny-stocks-in-india.jpg)