We all know that a Demat account is essential to participate in the Indian stock markets. Each investor has a unique Demat account number, but do you know that the Demat account number is a combination of DP ID and Client ID? DP ID is unique to the Depository Participant, and the client ID is unique to the investor. Each investor’s Client ID is distinct and prevents any confusion with other accounts.
In this blog, we will explain Client ID and DP ID and how to find them. We will also learn about the key differences between them.
What is a Client ID?
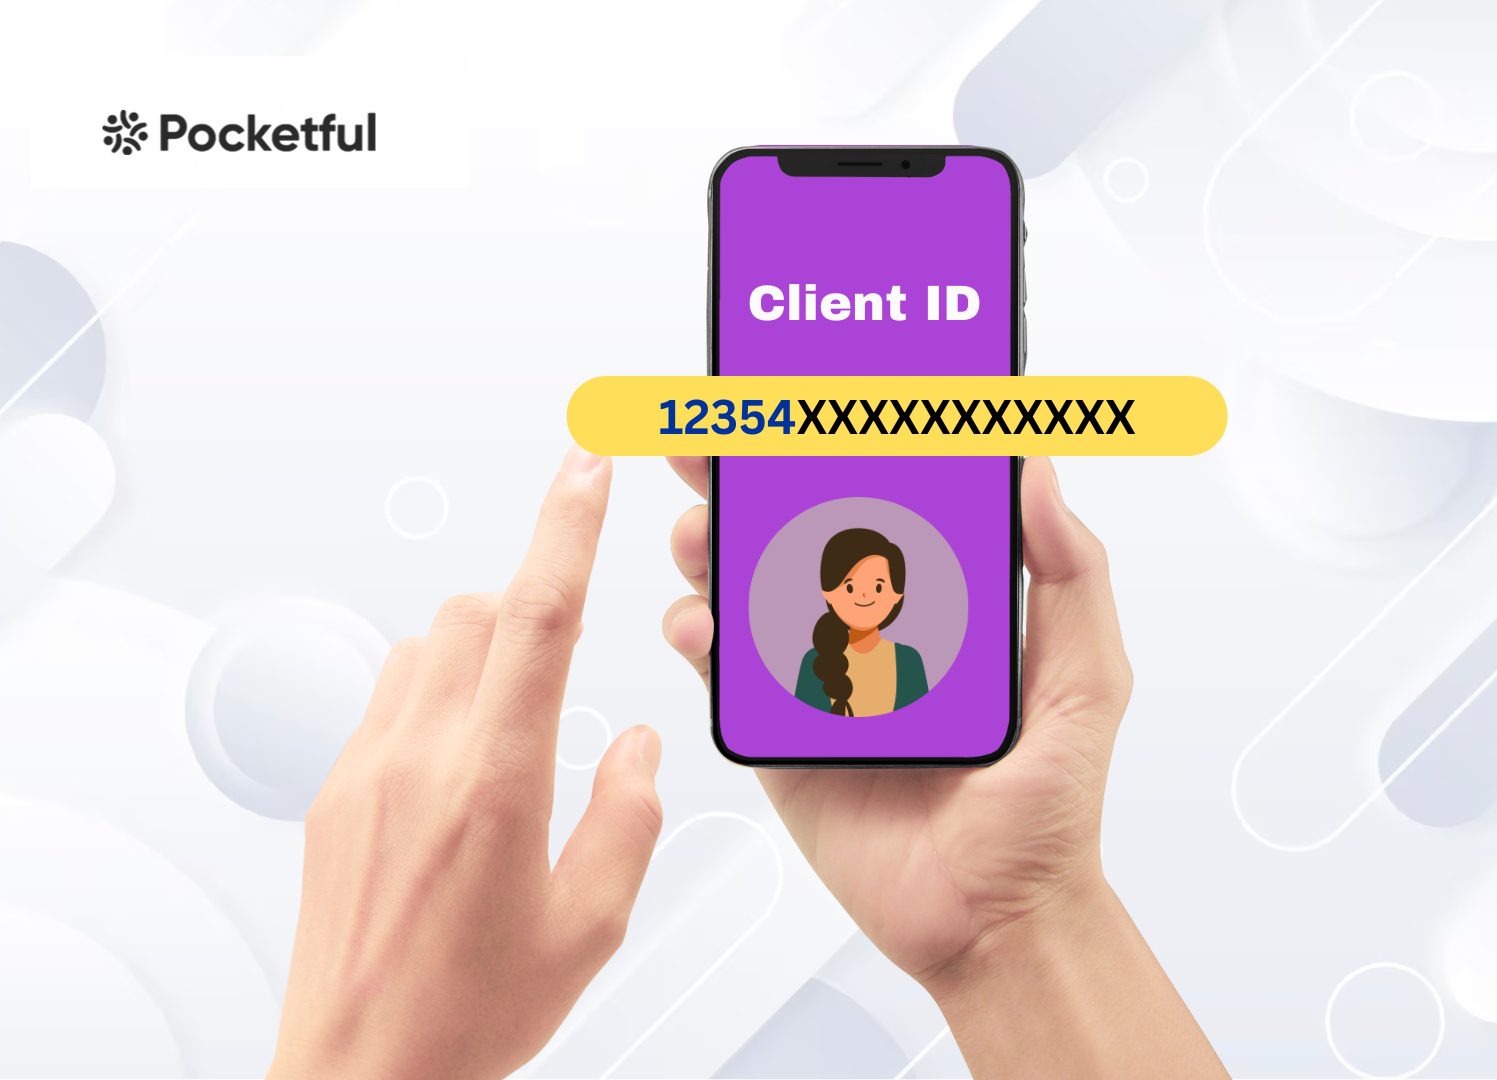
A Client ID in a Demat account is a unique eight-digit identification number assigned to each investor by the depository participant (DP). It serves as an electronic reference for the DP to track the activities and all the services linked to a specific client. A Demat account number is a combination of Client ID and DP ID. The Client ID works alongside the DP ID (Depository Participant ID) to facilitate smooth transactions.
Client ID is essential for maintaining transparency in financial transactions and ensuring that all holdings are accurately recorded under your name. Understanding the importance of client ID is vital for any investor looking to navigate the stock market efficiently, as it plays a key role in safeguarding your investments and streamlining the trading process.
What is DP ID in the Demat Account?
The DP ID or Depository Participant ID is a unique identification number assigned to a depository participant in the Indian securities market. It plays a crucial role in the functioning of a Demat account, which holds the securities in electronic form. The DP ID, along with the Client ID, forms a unique Demat account number.
For example: If your Demat account number is ‘1235469265698452’, then the first eight digits (‘12354692’) represent the DP ID and the remaining eight digits(‘65698452’) is your Client ID.
So, what is the relationship between DP ID and Client ID? While the Client ID is specific to each investor and the DP ID identifies the institution facilitating the Demat services. Understanding the terms “what is Client ID in Demat account” and “what is Client ID” is essential for any investor.
Read Also: How to Open a Demat Account Online?
How To Find Client ID In Demat Account?
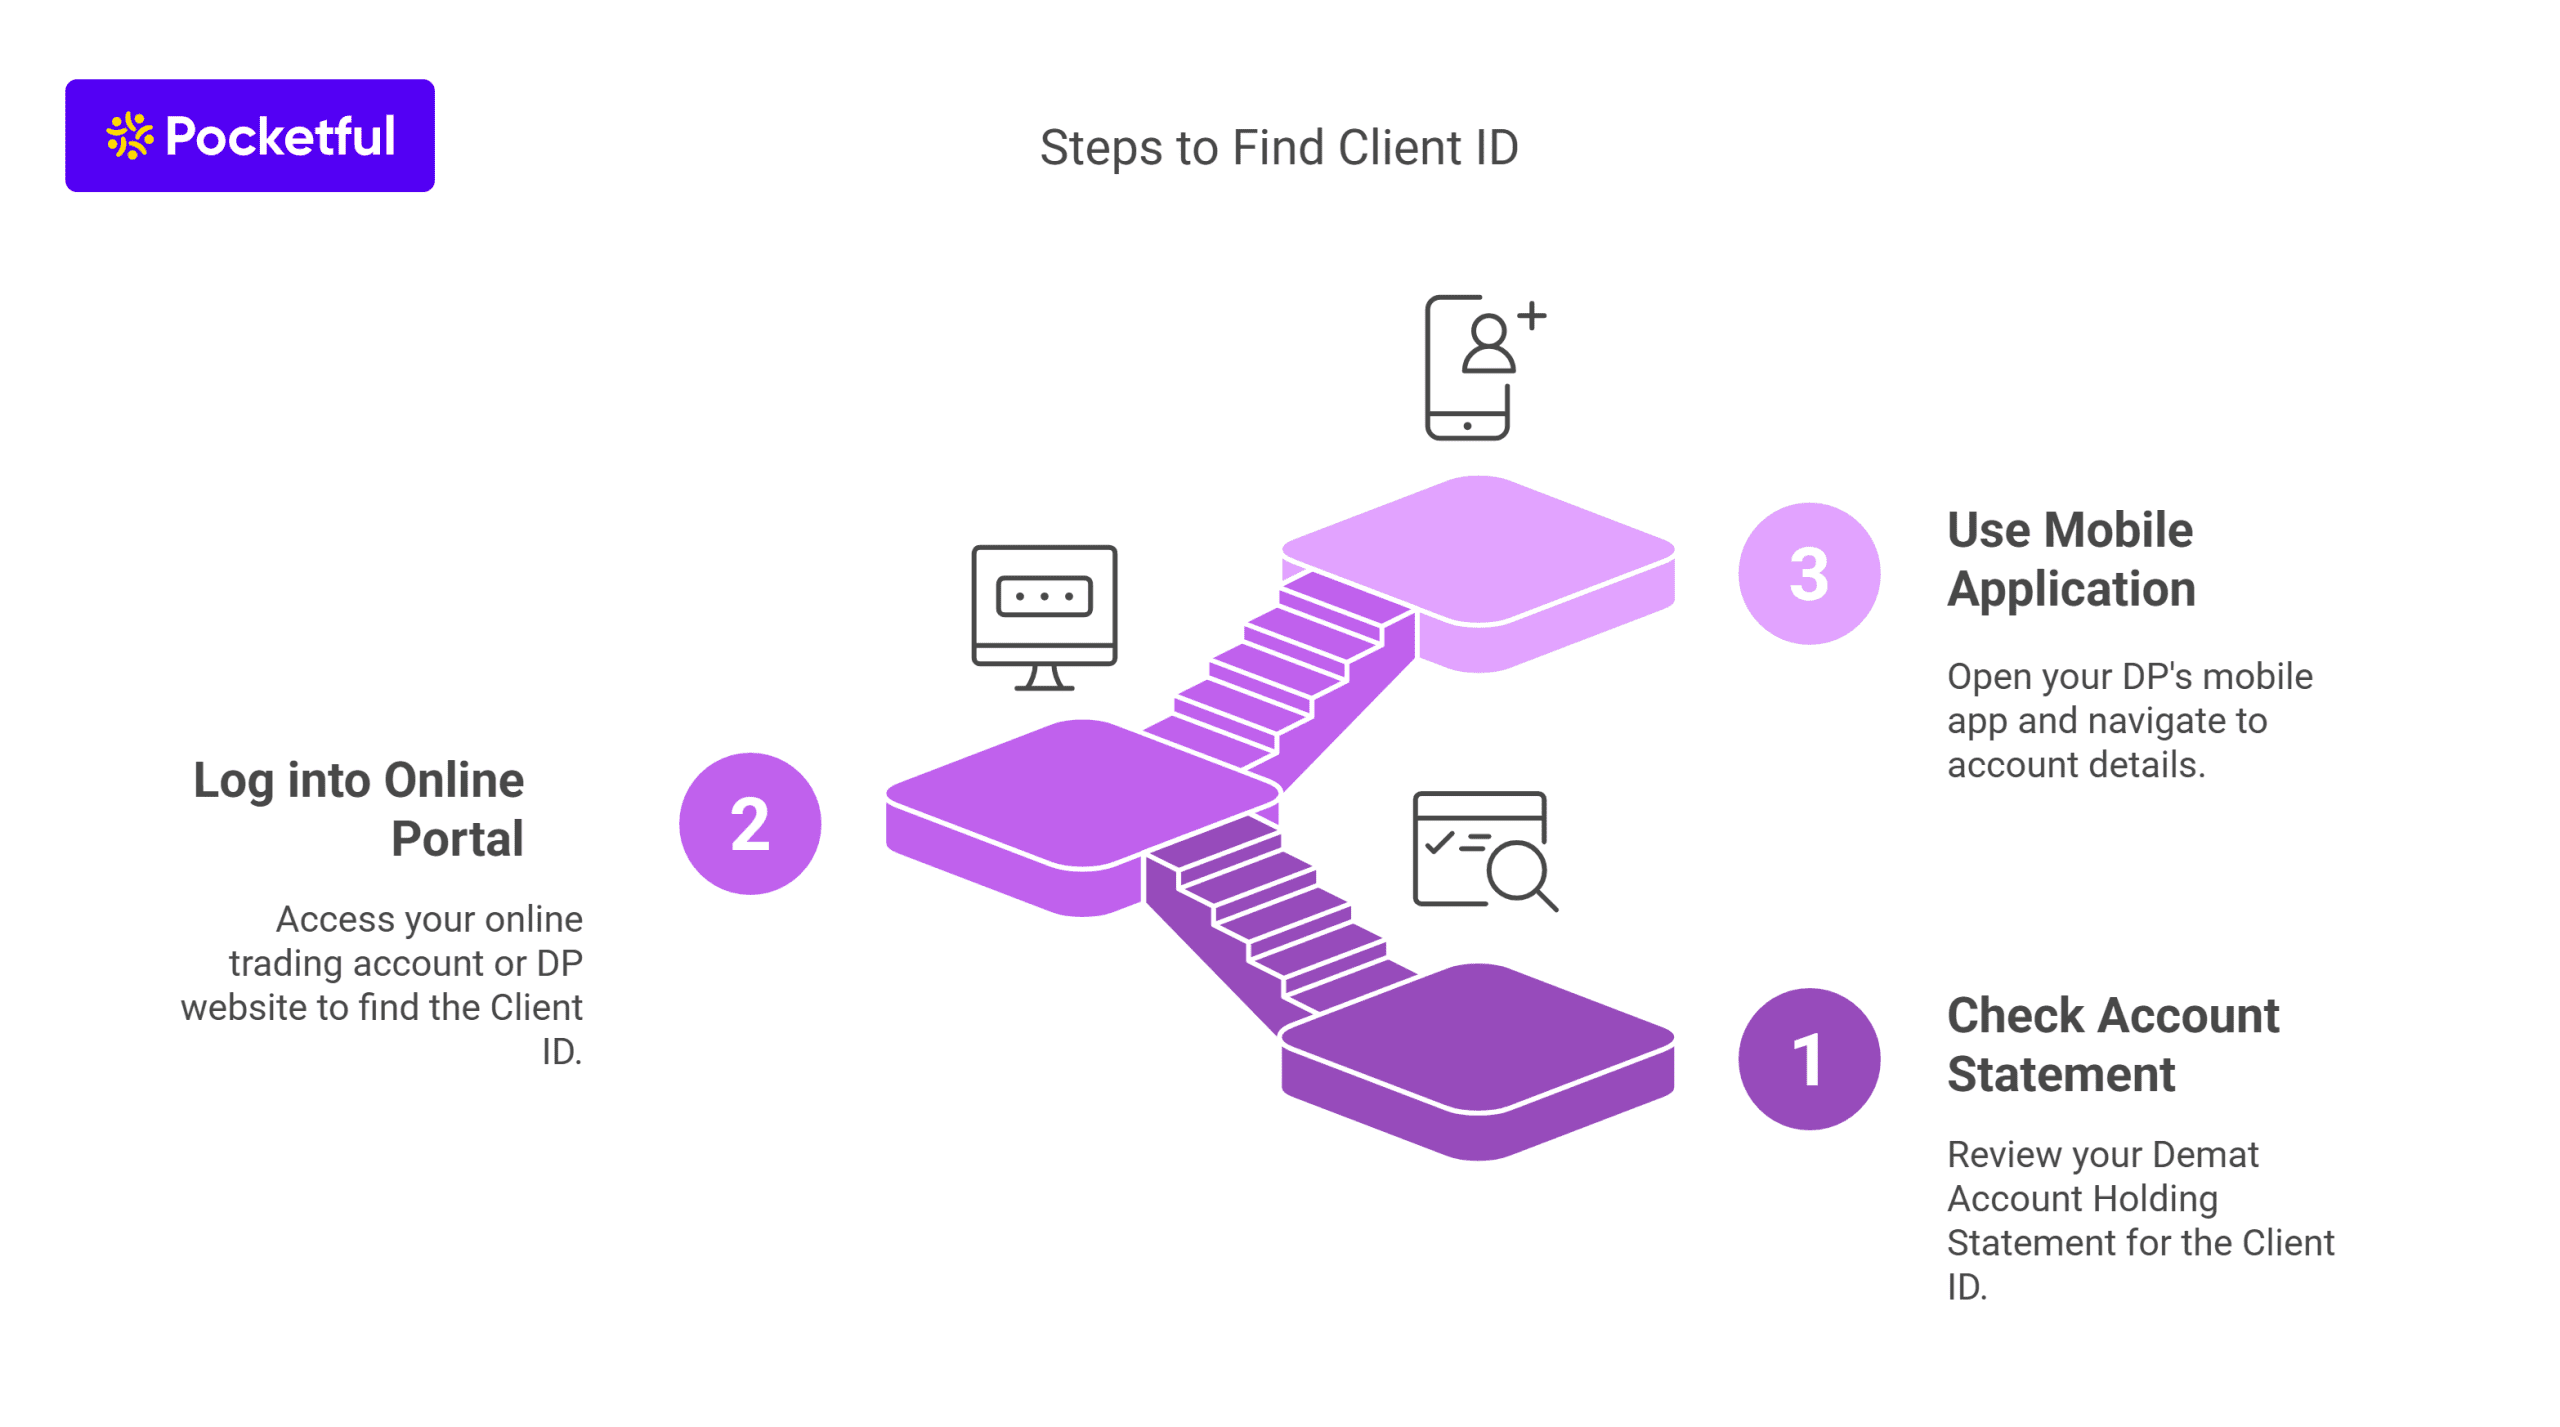
Finding your Client ID in a Demat account is straightforward and essential for managing your investments. To locate your Client ID, you can follow these steps:
- Account Statement: Check your Demat Account Holding Statement which usually contains your Client ID. This document is sent periodically by your depository participant.
- Online Portal: Log into your online trading account or the website of your depository participant. Your Client ID is often displayed on the dashboard or account summary.
- Mobile Application: If your DP offers a mobile application, you can find your Client ID in the account details section.
Understanding what is Client ID in a Demat account is crucial for any investor. It works alongside the DP ID to uniquely identify your securities holdings. By knowing your Client ID and its significance, you can streamline your trading process and ensure secure management of your investments. Always keep this information handy for seamless transactions.
Difference Between Client ID And DP ID In a Demat Account
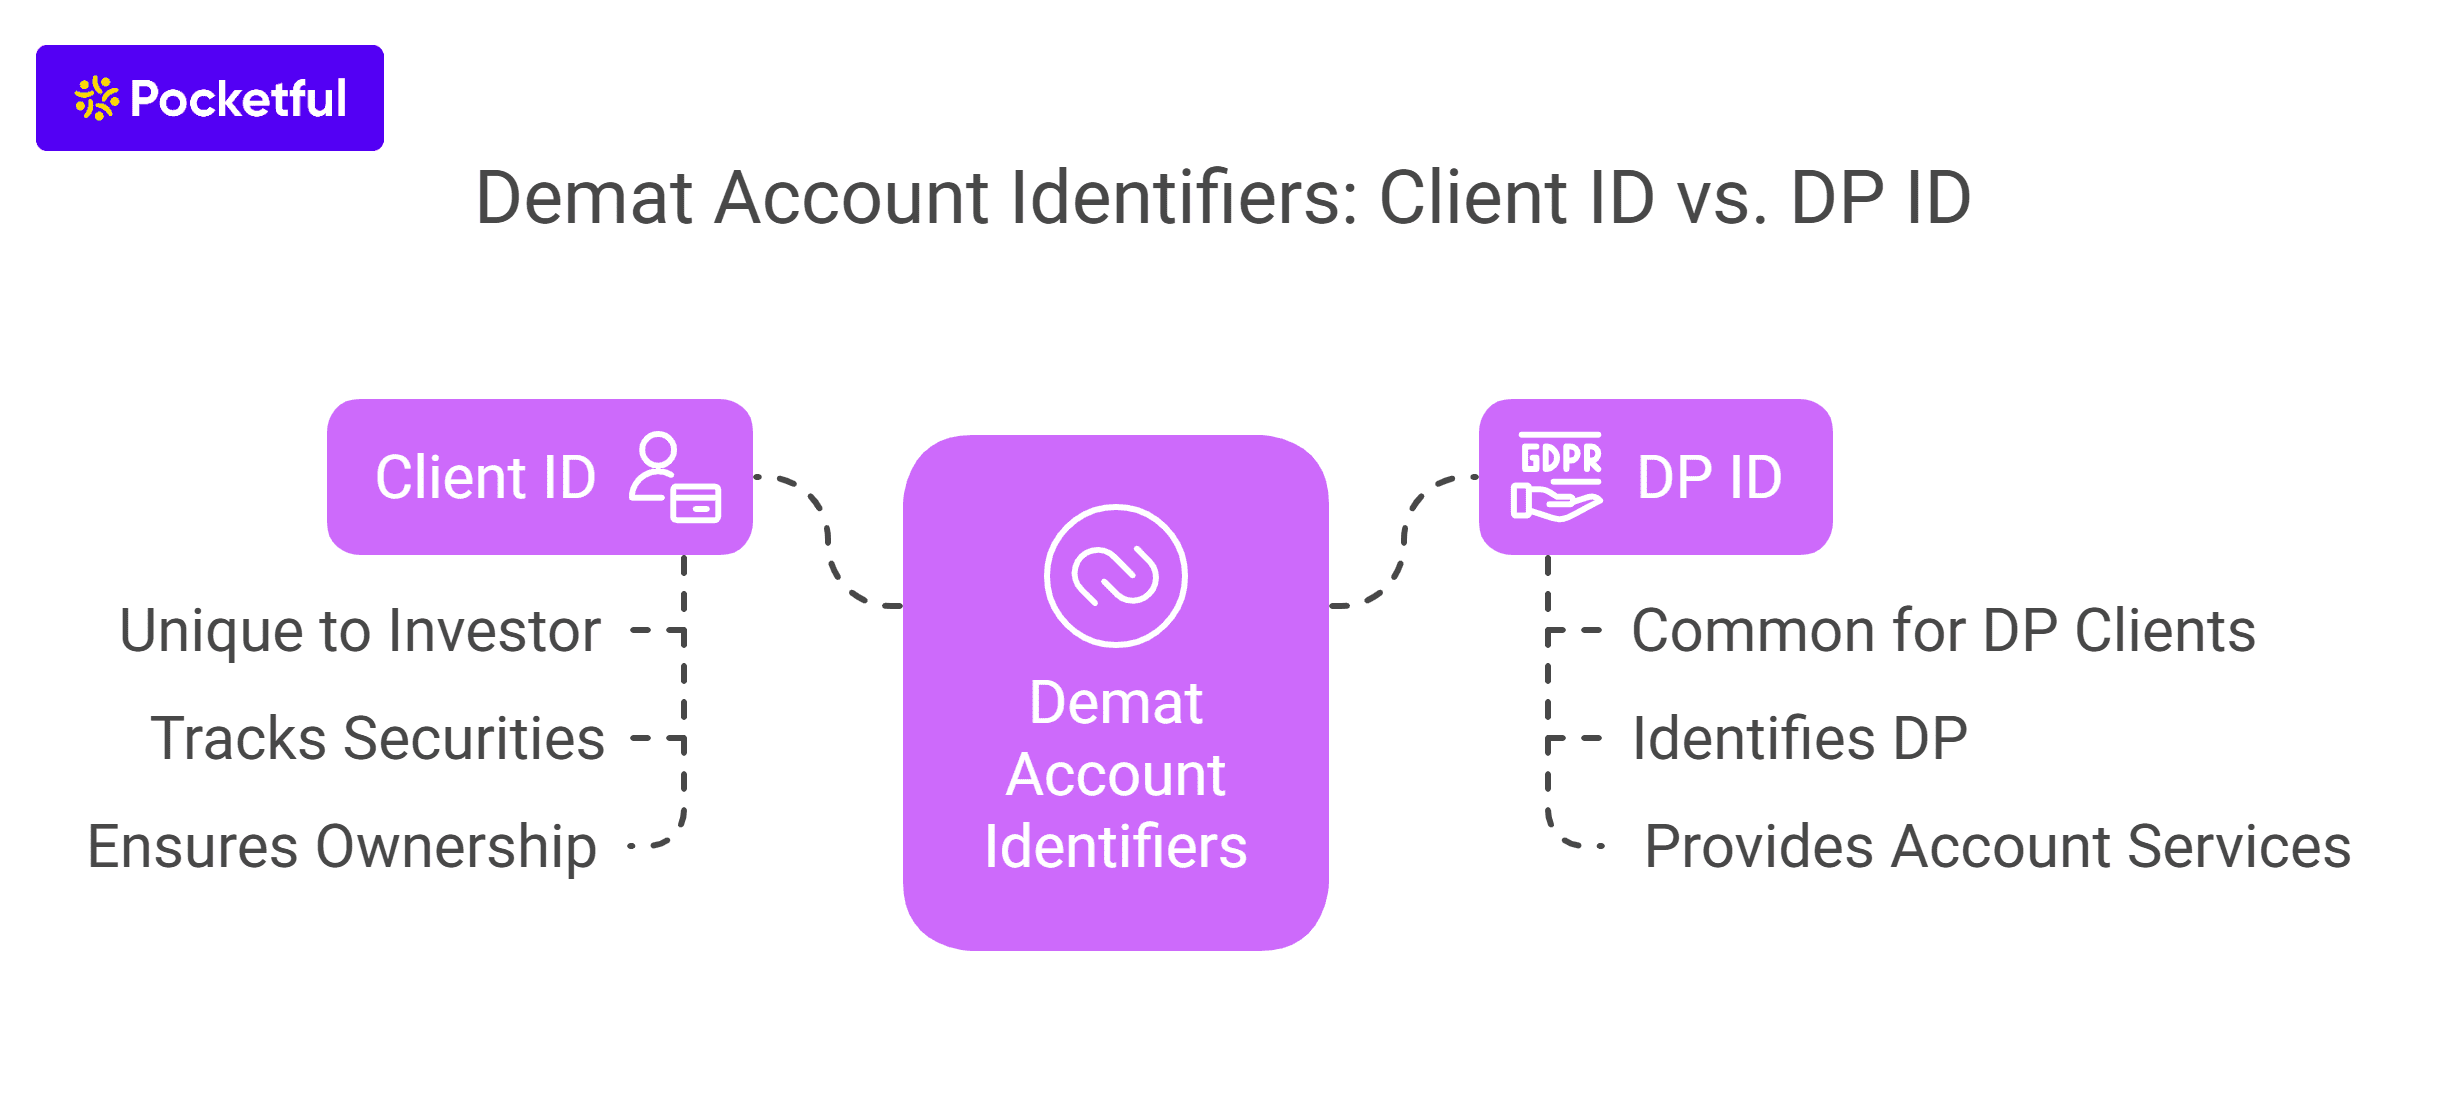
In a Demat account, the Client ID and DP ID serve distinct roles but complement each other.
Client ID is a unique identifier assigned to each investor by the depository. It specifically tracks your securities holdings and transactions, ensuring accurate ownership records. This ID is essential for executing trades and managing your investments efficiently.
On the other hand, DP ID identifies the Depository Participant (DP) that provides Demat account services to investors. Each DP is assigned a unique DP ID, which is common for all clients registered with that depository participant.
In summary, while the Client ID in a Demat account is unique to the investor and linked to their securities, the DP ID represents the DP. Together, they create a secure and organized system for tracking and managing investments in the stock market, ensuring that transactions are processed accurately and efficiently. Understanding this difference is vital for an investor navigating the financial markets.
Read Also: Features and Benefits of Demat Account
Conclusion
In conclusion, understanding the difference between Client ID and DP ID in a Demat account is essential for effective investment management. The Client ID uniquely identifies an investor in the DP’s database and facilitates the accurate tracking of holdings and other services provided to a specific client.
Meanwhile, the DP ID denotes the depository participant that provides Demat account services. Together, these identifiers streamline the trading process and ensure accurate transactions. By recognizing the distinct roles of Demat Client ID and DP ID, the investors can navigate the complexities of the stock market with greater confidence and efficiency, ultimately enhancing their investment experience.
Frequently Asked Questions (FAQs)
What is a Client ID in a Demat account?
A Client ID is a unique identification number assigned to each investor by the depository participant.
How does a Client ID differ from a DP ID?
The Client ID identifies an individual investor in the DP’s system, and the DP ID uniquely identifies a particular Depository Participant. Together, they ensure secure management of securities.
Where can I find my Client ID?
Your Client ID is the last eight digits of your Demat account number, which you can find in the Demat Account Holding Statement, DP’s website, or through the mobile application.
Is the Client ID confidential?
Yes, the Client ID is confidential and should be kept secure as it is crucial for managing your investments and conducting transactions in your Demat account.
Can I change my Client ID?
You cannot change your Client ID and it remains fixed for a Demat account. To get another Client ID, open a Demat account with another DP.