Hyundai stands for innovation and reliability and is steering the future of mobility in India. Hyundai has a large market share due to its focus on innovation, cost-effectiveness, safety, comfort, and sustainable mobility. Hyundai is one of the largest automobile manufacturers in the world and has been listed on the South Korean stock exchange, but did you know that its Indian subsidiary recently launched an IPO, which is India’s biggest IPO to date?
In this blog, we will discuss Hyundai Motor India, the Indian subsidiary of Hyundai. We will give you an overview, business model, and financial data and do a SWOT analysis of the company.
Hyundai Motor India Company Overview
Hyundai Motor India Ltd., a part of the Hyundai Motor Group, was incorporated in 1996. Hyundai is the third largest auto equipment manufacturer in the world and has established itself as one of the world’s leading automakers. The company offers a diverse portfolio of sedans, SUVs, electric vehicles (EVs), and hydrogen fuel cell vehicles.
Hyundai has a robust global presence, with production facilities in many countries and a wide distribution network. The company commits to innovation, which is evident in its development of hydrogen fuel vehicles and autonomous driving technology.
Business Model and Strategy of Hyundai Motor
Hyundai’s business model revolves around a customer-centric approach backed by global expansion, innovation, localization, and technological advancements. Hyundai is committed to sustainability, positioning it as a leader in the global automobile market. Let us understand Hyundai’s business model in more detail:
1. Global operations and sales: Hyundai has manufacturing plants all across the globe and sells a wide range of vehicles. Hyundai’s diversified product range features affordable cars, fuel-efficient cars, electric vehicles (EVs), autonomous cars, plug-in hybrid vehicles, and hydrogen-powered cars, catering to various consumer segments and markets.
2. Globalization and Localization: Hyundai operates in more than 200 countries worldwide and has manufacturing capacities in major key markets. Hyundai also has plants in India, helping it source a major portion of its components locally and cater to the demand for affordable vehicles.
3. Technology and Innovation: Hyundai invests heavily in research and development to maintain its position as a major market player. The company aims to develop eco-friendly electric vehicles, autonomous driving and hydrogen fuel cell technology to align with the government’s push for green mobility.
4. Sustainability: Hyundai is making efforts to remain environmentally friendly through its innovative product offerings. It is committed to sustainability and has set targets to achieve carbon neutrality by 2045, reducing emissions and carbon footprint.
5. Financial Services: Hyundai provides a range of financial services, including leasing and financing options, through its subsidiaries. This service helps attract customers by offering flexible purchasing options, hence contributing to its overall revenue.
6. After-Sales Service and Customer Focus: Hyundai gives importance to customer satisfaction through its extensive after-sales service network, including warranty packages, vehicle maintenance, and repair services. It also focuses on delivering a smooth digital experience, offering apps and online platforms to enhance customer engagement.
7. Strategic Partnerships and Acquisitions: Hyundai has formed strategic alliances and partnerships with technology companies, governments, and other manufacturers to drive innovation in autonomous driving, mobility solutions, and hydrogen fuel cell infrastructure. This approach enables Hyundai to remain competitive in a rapidly evolving industry.
Financial Data of Hyundai Motor
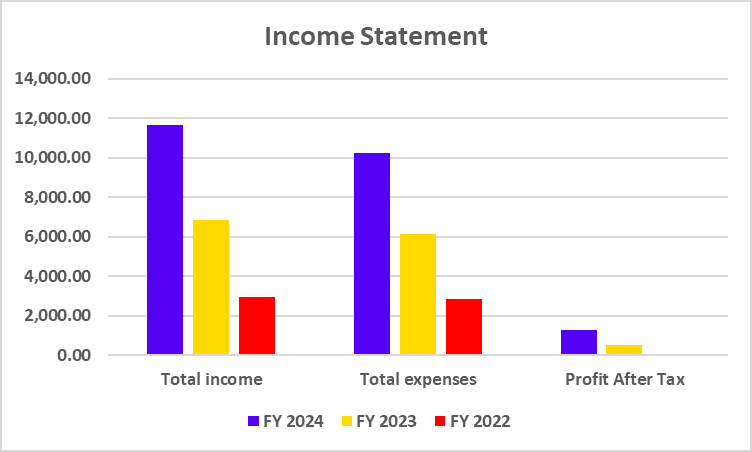
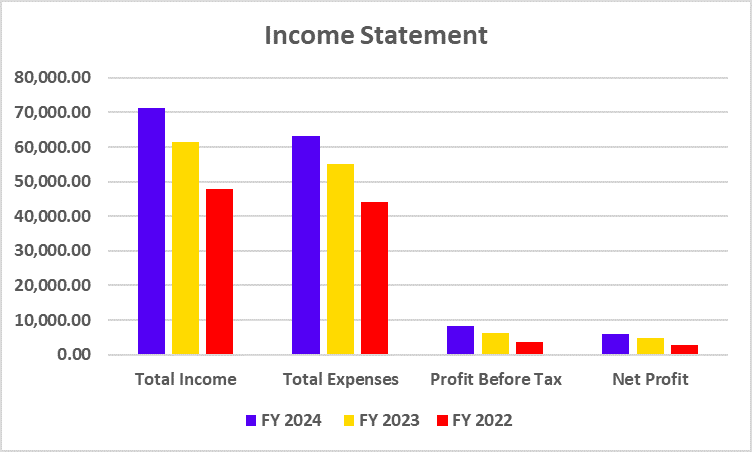
Income Statement
| Particulars | FY 2024 | FY 2023 | FY 2022 |
|---|---|---|---|
| Total Income | 71,302.33 | 61,436.64 | 47,966.05 |
| Total Expenses | 63,062.45 | 55,091.07 | 44,193.84 |
| Profit Before Tax | 8,239.87 | 6,345.58 | 3,772.21 |
| Net Profit | 6,060.04 | 4,709.25 | 2,901.59 |
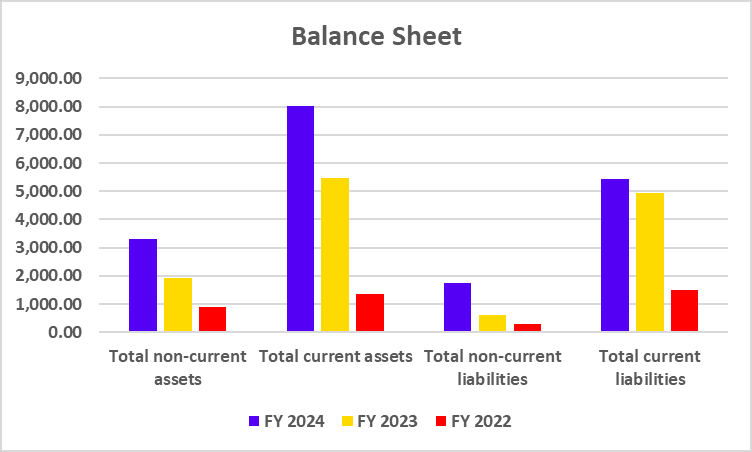
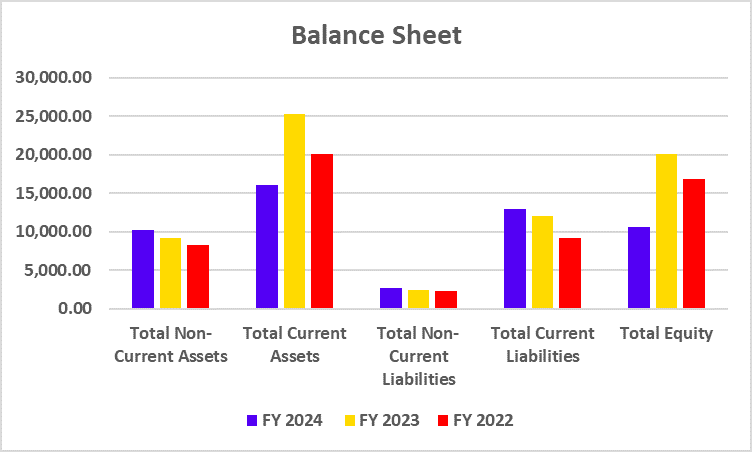
Balance Sheet
| Particulars | FY 2024 | FY 2023 | FY 2022 |
|---|---|---|---|
| Total Non-Current Assets | 10,225.20 | 9,211.37 | 8,278.22 |
| Total Current Assets | 16,124.04 | 25,361.97 | 20,079.84 |
| Total Non-Current Liabilities | 2,686.40 | 2,513.01 | 2,309.57 |
| Total Current Liabilities | 12,997.19 | 12,005.52 | 9,192.24 |
| Total Equity | 10,665.66 | 20,054.82 | 16,856.26 |
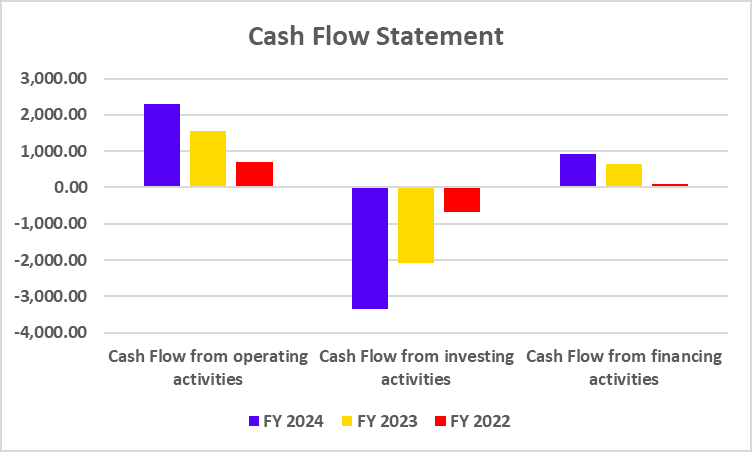
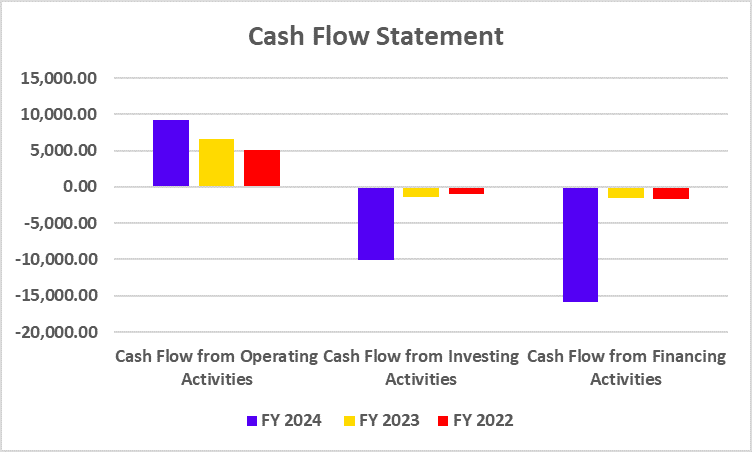
Cash Flow Statement
| Particulars | FY 2024 | FY 2023 | FY 2022 |
|---|---|---|---|
| Cash Flow from Operating Activities | 9,251.96 | 6,564.26 | 5,138.41 |
| Cash Flow from Investing Activities | -10,090.47 | -1,411.62 | -905.29 |
| Cash Flow from Financing Activities | -15,930.07 | -1,579.23 | -1,662.04 |
Key Performance Indicators
| Particulars | FY 2024 | FY 2023 | FY 2022 |
|---|---|---|---|
| EBITDA Margin (in %) | 13.08 | 12.52 | 11.58 |
| EBIT Margin (in %) | 9.92 | 8.89 | 7 |
| ROCE (in %) | 62.9 | 28.75 | 20.37 |
Read Also: Vedanta Case Study: Business Model, Financial Statement, SWOT Analysis
SWOT Analysis of Hyundai Motor India
Strengths
- Hyundai has a strong global presence and brand recognition. It is one of the leading automotive companies with a significant market share.
- It is a leader in technological innovation, especially in EV and hydrogen fuel cell technology.
- It is a key player in the automobile industry with a product portfolio including SUVs, hybrids, EVs, and fuel-cell cars. The diversified product portfolio helps diversify risks from fluctuations in specific market segments.
- It has operations across the globe, with production facilities in countries like South Korea, India, China, and the U.S., allowing for cost efficiency, economies of scale, and the ability to serve local markets effectively.
- It manufactures environment-friendly vehicles.
Weaknesses
- The company’s sales depend on key markets like China, Korea and the US. Any regulatory change will affect the overall sales of the company.
- The company fails to compete in the luxury segment with established players like Audi, BMW and Mercedes-Benz.
- The company has faced issues in the past related to vehicle’s lower build quality and reliability.
Opportunities
- Expansion in developing markets will help the company increase its sales.
- The company can become the market leader in the EV segment by catering to the growing demand for sustainable mobility solutions.
- It has formed several partnerships with other firms to build autonomous cars and innovate with AI and machine learning.
- Hyundai is exploring ways to reduce its environmental impact by adopting sustainable practices such as energy-efficient technologies and hydrogen fuel cells.
Threats
- The global automotive industry is highly competitive, with strong players like Toyota, Volkswagen, and Tesla in the EV space. Hyundai faces constant pressure to innovate and stay cost-competitive.
- The automotive industry is highly regulated and is subject to strict regulations related to pricing, emissions standards, and tariffs.
- Supply chain disruptions, particularly for semiconductor chips, have affected automobile production in the past. Any further disruptions could lead to production delays, increased costs, or inventory shortages.
- Managing operational costs while maintaining high-quality products remains a constant challenge as the industry is capital-intensive and requires regular investments.
- The economic slowdown could lead to reduced consumer spending on automobiles, and inflation and political instability could further impact profitability.
Read Also: TCS Case Study: Business Model, Financial Statement, SWOT Analysis
Conclusion
Hyundai Motor India’s financial health, strong brand presence, and growth prospects make it a promising candidate for an IPO. The company is well-positioned to benefit from positive trends in the automobile space, such as rising demand for SUVs, increasing export percentages, and the adoption of EVs in India.
Hyundai Motor India has a history of stable operations and a competitive advantage in innovation & technology, due to which the company has the potential for long-term growth. However, there are challenges related to competition and regulatory changes which could affect its financial performance. It is advised to consult a financial advisor before investing.
Frequently Asked Questions (FAQs)
What was the IPO size in India of Hyundai Motors?
The IPO is worth ₹27,870 crores, making it the biggest in India’s history.
What are the Key Risks in the valuation of Hyundai Motors?
The company has been unable to increase its market share for some time and has been facing stiff competition from Tata Motors, M&M, etc.
How will the company use the IPO proceeds?
The IPO proceeds will go to the promoters selling their shares.
What would be the benefits of investing in Hyundai Motor India?
Hyundai Motor India’s brand reputation, future growth and expansion plans make it a good investment opportunity. However, investors must consult a financial advisor before investing.
Hyundai was established in which country?
Hyundai is a South Korean automobile manufacturer and was established in 1967.