Traders use various patterns to understand market behavior and base their investment strategies on them. These patterns are an effective tool to form a calculated investment decision that translates into attractive returns. One such tool is swing trading patterns, which are extremely useful if you follow the swing trading approach in the financial markets.
Using these patterns wisely can be a roadmap to finding the right stocks at the right time. This must have astonished you often how some people probably know the perfect moment to buy or sell stocks. It seems they know exactly when to trade and when not to. This is not a fluke, but it happens due to strategic trades that are backed by these chart patterns.
By understanding trading patterns, you can determine when to put your money in and when to cash out. Let us try to understand this in detail through this blog, where we will go through various swing trading concepts. We will also learn about the best chart patterns for swing trading.
What is a Swing Trading Pattern?
A swing trading pattern is a chart pattern most effective in predicting market trends, including reversals and continuations for swing trading. These patterns are established through historical price data, which reflects how the stock price has behaved in the past.
Swing trading is a little different from day trading. In intraday, trades are executed with the aim of holding the positions for a few minutes to a few hours. In swing trading, a trader holds trades for a few days to several weeks. Patterns form the basis for making informed decisions about entry and exit points. They help traders identify moments when the price is likely to shift in their favor, whether it’s a bullish move or a bearish move.
In order to master the swing trading strategy, you need to recognize and understand these swing trading chart patterns. In the simplest terms, a swing trading pattern refers to a distinct formation or shape that manifests on stock charts, signaling potential future price movements. If you look at them closely, these patterns will provide you with visual indicators, offering signals about the future direction of a stock’s price, whether it may increase or decrease. By carefully analyzing these chart patterns, you can gain insights into market behavior. It helps you decide when to buy or sell a stock based on your understanding of the anticipated movement. Incorporating these patterns into your trading strategy can take your trading game to the next level.
Read Also: What is the Best Time Frame for Swing Trading?
List of 8 Best Swing Trading Patterns
When it comes to swing trading, there are some chart patterns that every trader should be familiar with. Below is a cheat sheet of swing trading patterns that have proven their reliability over time:
- Head and Shoulders Pattern
- Double Top and Double Bottom Patterns
- Cup and Handle Pattern
- Flag Pattern
- Ascending and Descending Triangle Patterns
- Symmetrical Triangle Pattern
- Rounding Bottom Pattern
- Rising and Falling Wedge Patterns
Overview of Best Swing Trading Patterns
All the above-mentioned chart patterns for swing trading hold their significance. You can use one or multiple to create your trading strategy. For example, the Head and Shoulder Pattern is highly reliable in case of reversals. Whereas, Flag Pattern might be ideal for predicting a continuation.
The best idea is to use these chart patterns once you have substantial knowledge, which is provided below.
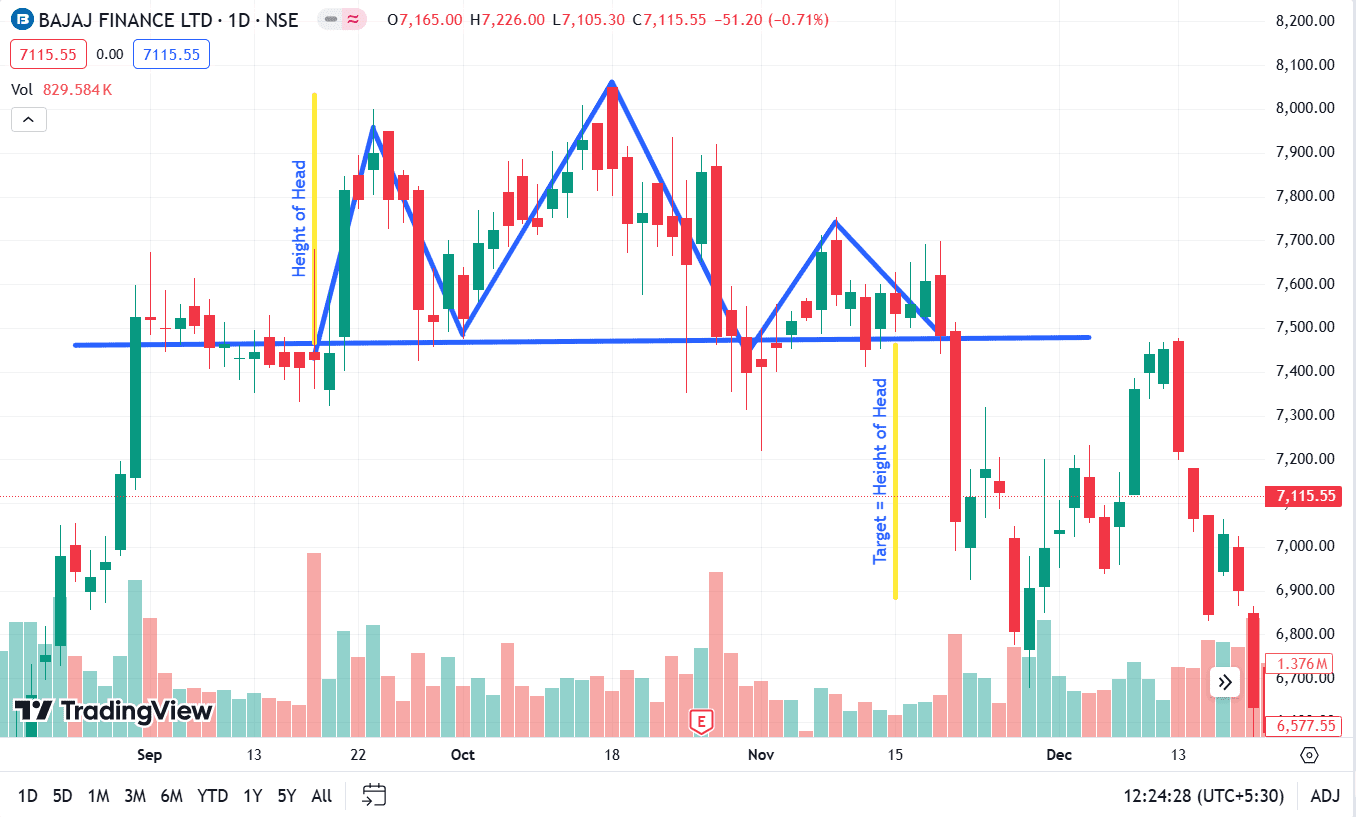
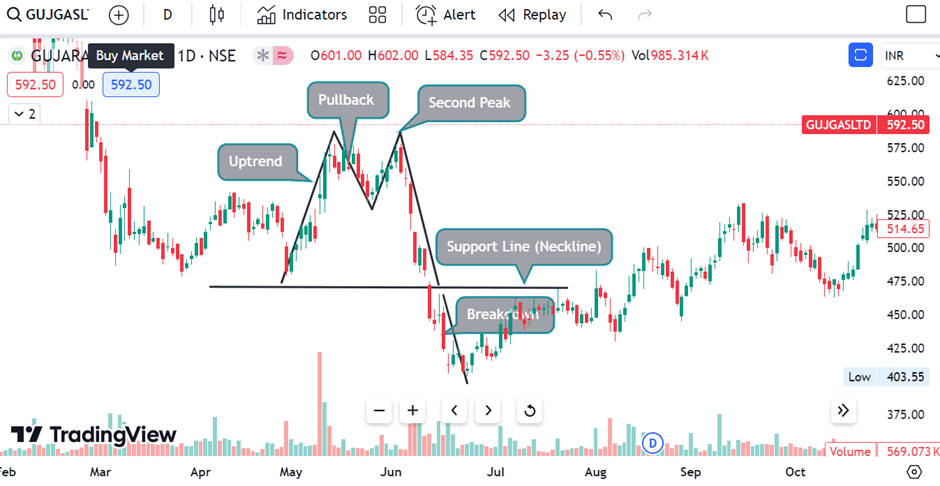
1. Head and Shoulders Pattern
It is one of the most popular swing trading patterns and indicates a bearish reversal. The Head and Shoulder Pattern consists of three peaks- a higher middle peak (the head) flanked by two lower peaks (the shoulders). When the price breaks below the neckline (the support line that connects the two shoulders), it signifies the beginning of a bearish trend.
How to trade: One should wait for the price to break below the neckline before creating a short position. A stop-loss can be placed just above the neckline and targets near the major support levels.
Key Points
- This pattern often indicates the end of a bullish trend.
- Traders can create a short position when the price breaks below the neckline.
Example: Head & Shoulders example of Bajaj Finance Ltd.
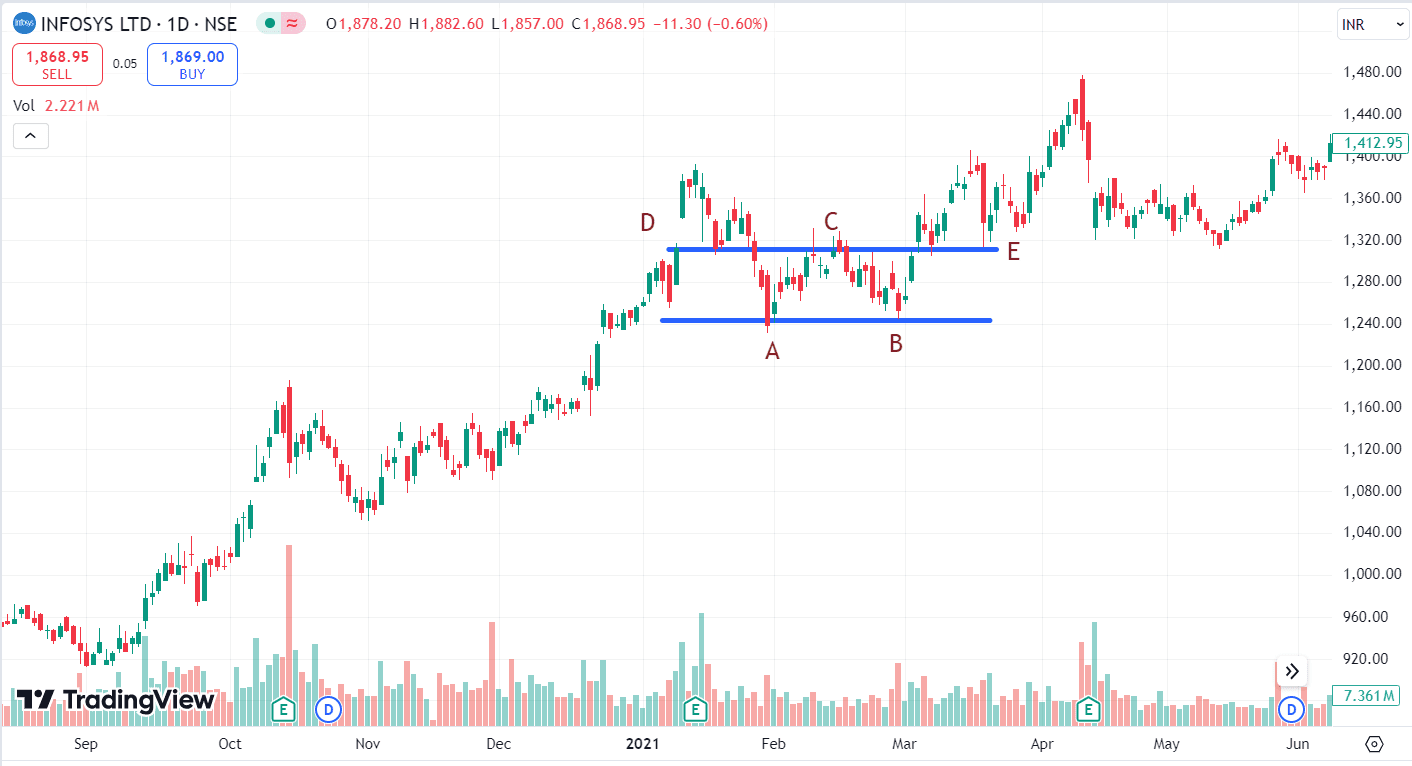
2. Double Top and Double Bottom Patterns
The Double Top is a bearish reversal pattern that forms after an asset price reaches a similar price level twice in an uptrend. However, the asset price declines moderately in between. If the price moves below the support level, it is a signal that the market will decline further.
On the contrary, the Double Bottom is a bullish reversal pattern. It forms when the price hits a similar low level twice in a downtrend. The breakout above the neckline confirms the uptrend.
How to trade: For the Double Top pattern, sell or create a short position once the price breaks below the support level. For a Double Bottom, buy or create a long position once the price moves above the resistance level.
Key Points:
- The Double Top signals a bearish reversal, while the Double Bottom signals a bullish reversal.
- They are commonly used for short to medium-term trades.
Example: Double Top
Example: Double Bottom
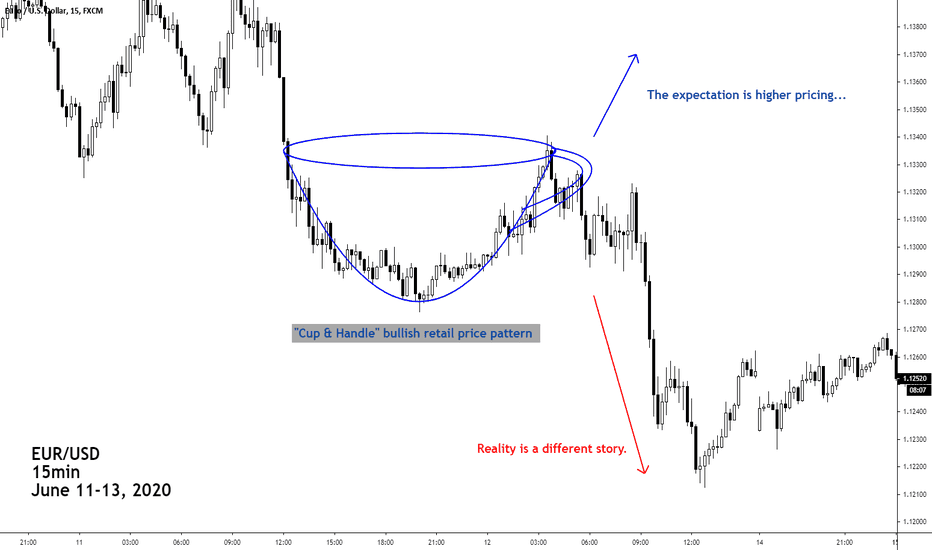
3. Cup and Handle Pattern
It is a bullish continuation pattern. It signals a possible upward movement after a consolidation period. The “cup” resembles a “U” shape, followed by a handle formation after a slight downward drift. In this pattern, we see a consolidation and an upward movement once the asset price moves above the resistance level.
How to trade: You should closely monitor the resistance level above the top of the handle. If the price gives a breakout above this, it is probably the best time to enter.
Key Points:
- It’s a bullish continuation pattern indicating the continuation of an uptrend.
- Traders can enter a long position once the price gives a breakout.
Example: Cup and Handle Pattern
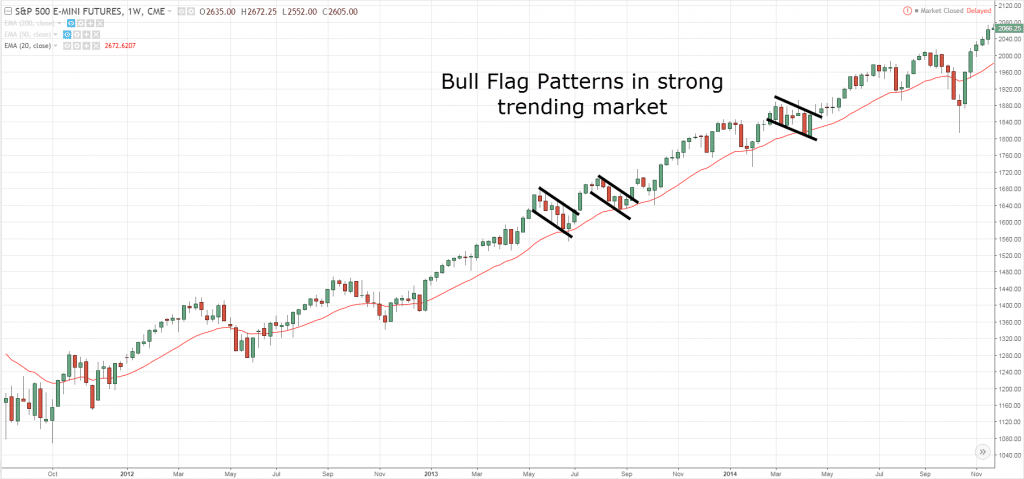
4. Flag Pattern
It is a continuation pattern as the asset price moves in the same direction as the prior trend after a slight consolidation period. The flag pattern occurs after a strong price movement, either bullish or bearish. Henceforth, the price moves within a narrow range, forming a flag shape. Many traders use this pattern to form their trading strategy. You can also consider this for better results.
How to trade: If the price gives a breakout in the direction of the previous trend, it is suggested to create a position to profit from the continuation of the prior trend. Also, the breakout backed by higher volume indicates a higher probability that the trend will continue further.
Key Points:
- The flagpole represents the initial strong price movement, while the flag represents the consolidation phase.
- Traders often look for a breakout above or a breakdown below the flag to confirm trend continuation.
Example: Flag Pattern
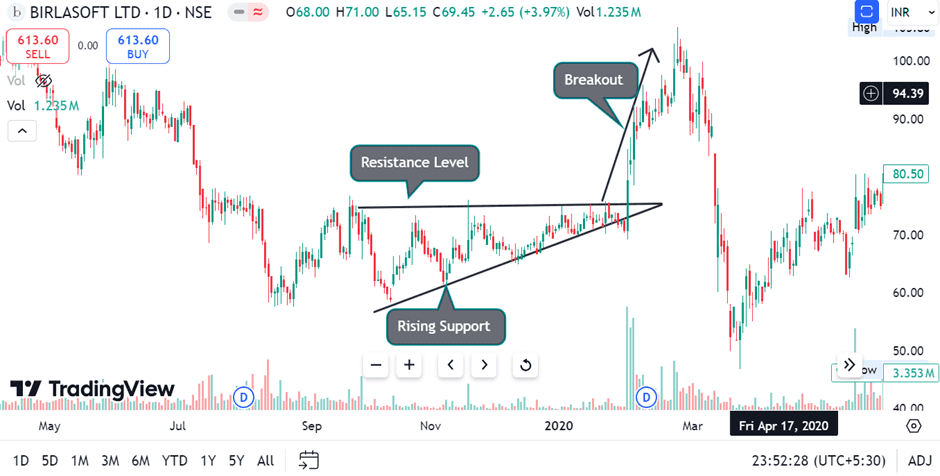
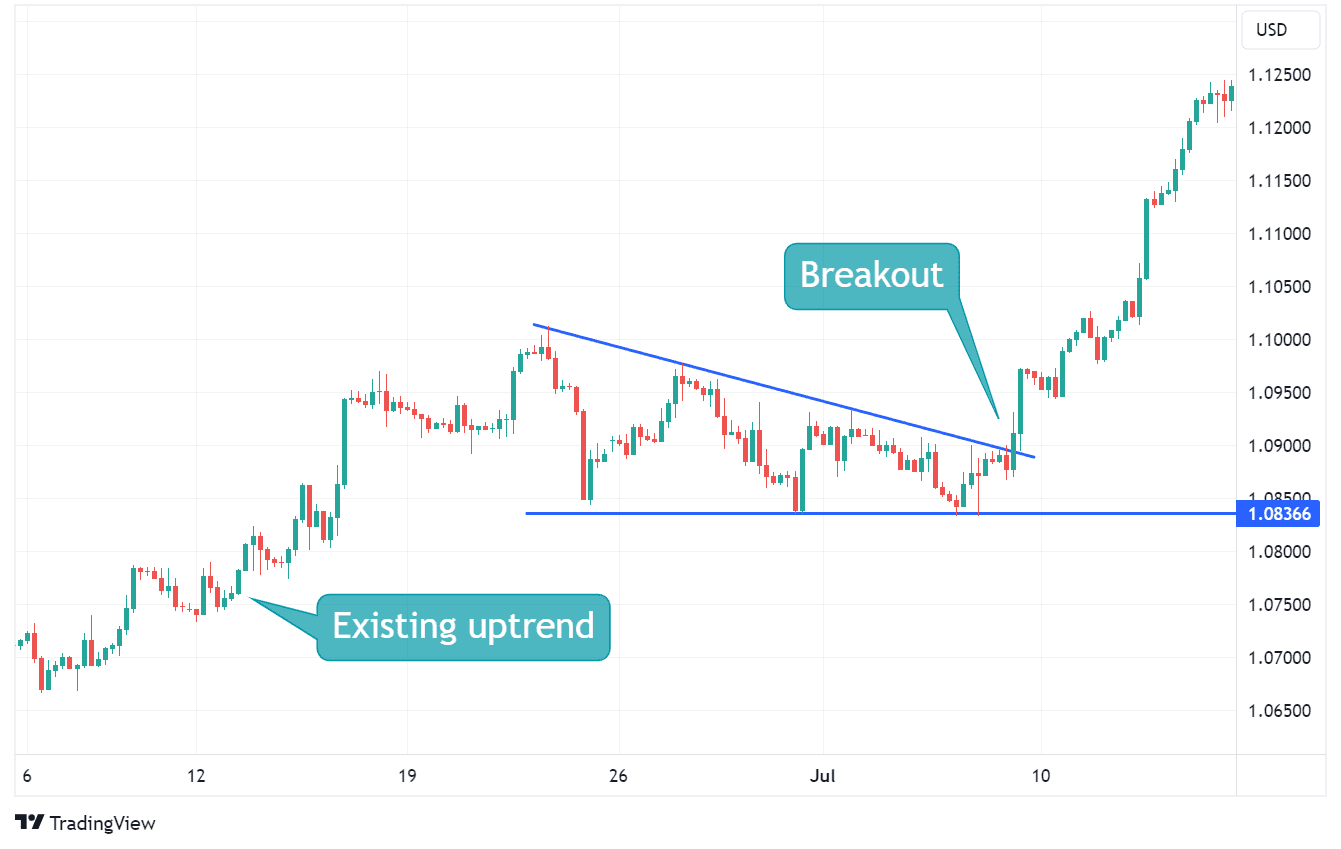
5. Ascending and Descending Triangle Patterns
The Ascending Triangle is a bullish continuation pattern characterized by a horizontal resistance line and an ascending trendline. If you analyze the chart, you will see the lower lows, creating an ascending line, while the highs are similar. The price repeatedly tests the resistance level, indicating buying pressure. If you encounter a breakout above the resistance level, it signals a bullish trend continuation.
On the contrary, the Descending Triangle is a bearish continuation pattern with a horizontal support line and a descending trendline. The price repeatedly tests the support level, and a breakdown below this support indicates a bearish trend continuation.
How to trade: If you are using the Ascending Triangle pattern, a breakout above the resistance line can be the right time to buy. Whereas, in the Descending Triangle pattern, sell or create a short position if the price moves below the support line.
Key Points:
- Ascending Triangles are bullish patterns, while Descending Triangles are bearish.
- They are most effective when combined with volume analysis to confirm the breakout.
Example: Ascending Triangle Patterns
Example: Descending Triangle Patterns
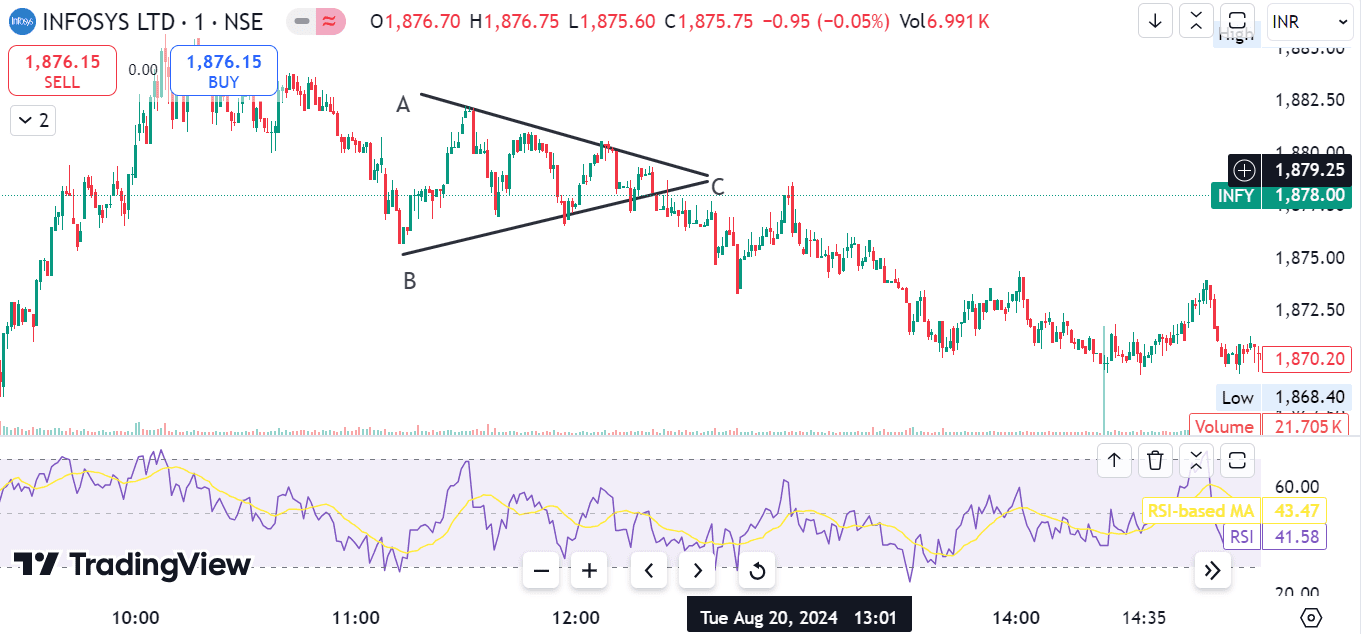
6. Symmetrical Triangle Pattern
It is one of the best swing trading patterns. The Symmetrical Triangle is a neutral continuation pattern, as it suggests that the price can give a breakout in either direction. It forms when the price makes lower highs and higher lows, converging into a point. Traders often wait for a breakout above or below either trendline to confirm the future trend direction.
How to trade: Since it is a neutral pattern, you should wait for the breakout to occur before making a move. If you see a breakout above the upper trendline, it can be the right time to buy. Whereas, a breakout below the lower trendline may indicate short positions or selling is beneficial.
Key Points:
- It’s important to wait for confirmation before entering a trade since the breakout can be in any direction.
- This pattern is commonly seen during periods of consolidation.
Example: Symmetrical Triangle Pattern
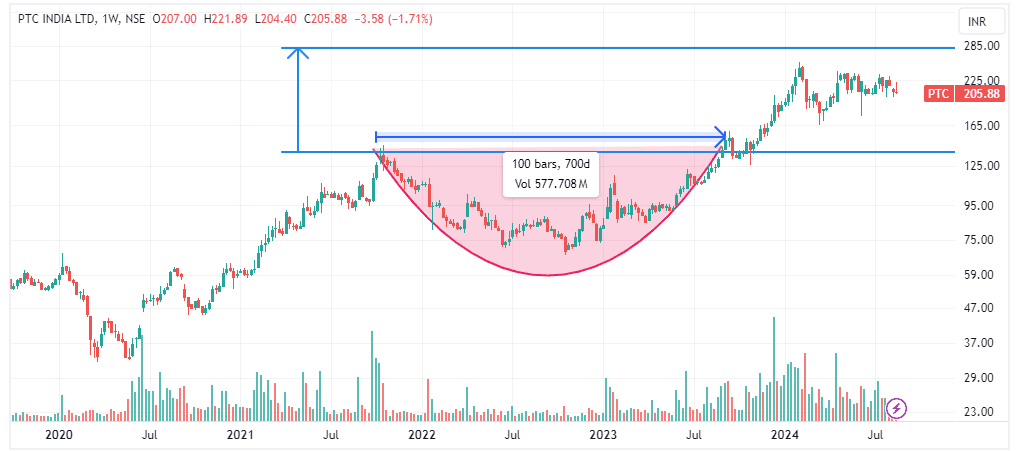
7. Rounding Bottom Pattern
Rounding Bottom Pattern is a bullish reversal pattern, indicating a gradual shift from a bearish to a bullish trend. It forms over a longer time frame, and the curve resembles a “U” shape. Once the price breaks above the resistance level formed by the upper part of the rounding bottom, it signifies the beginning of an uptrend.
How to trade: A breakout above the resistance level indicates an upward trend. You can utilize it to create a log position. Additionally, place a stop-loss right below the breakout point to manage the risk in case of a false breakout.
Key Points:
- It’s a long-term reversal pattern, signaling the end of a bearish trend and the start of a bullish trend.
- This pattern can provide good entry points for long-term swing trades.
Example: Rounding Bottom Pattern
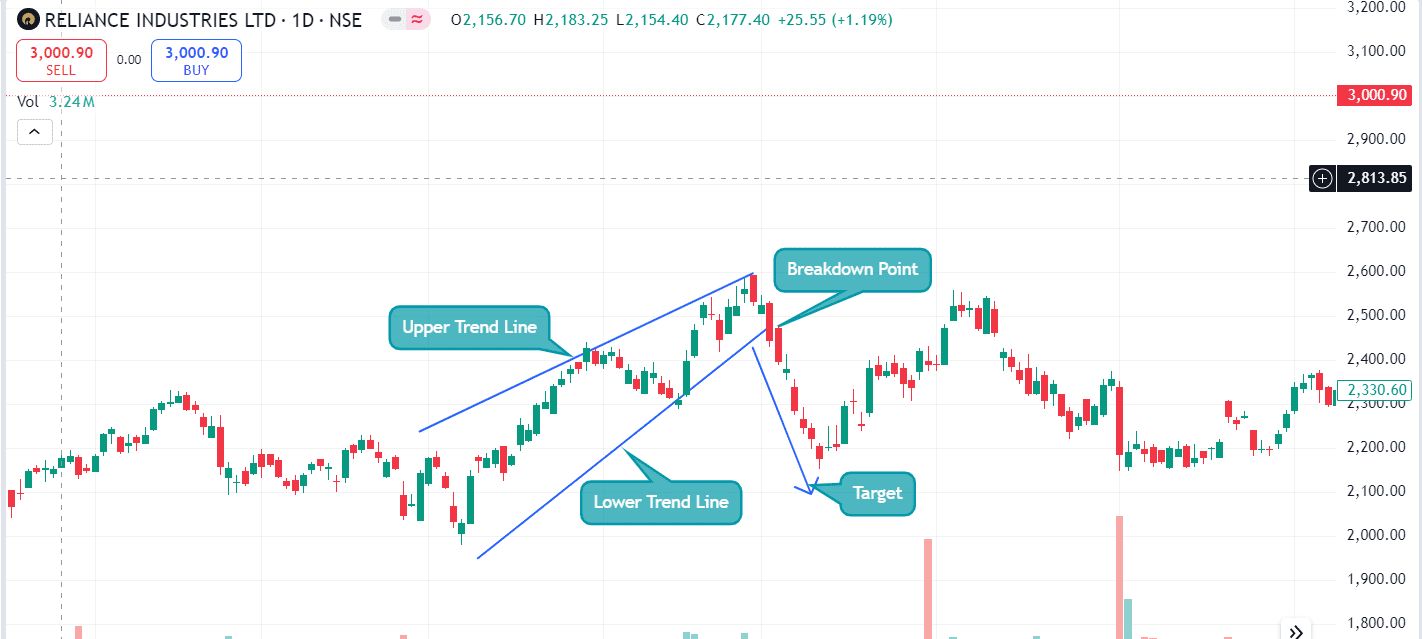
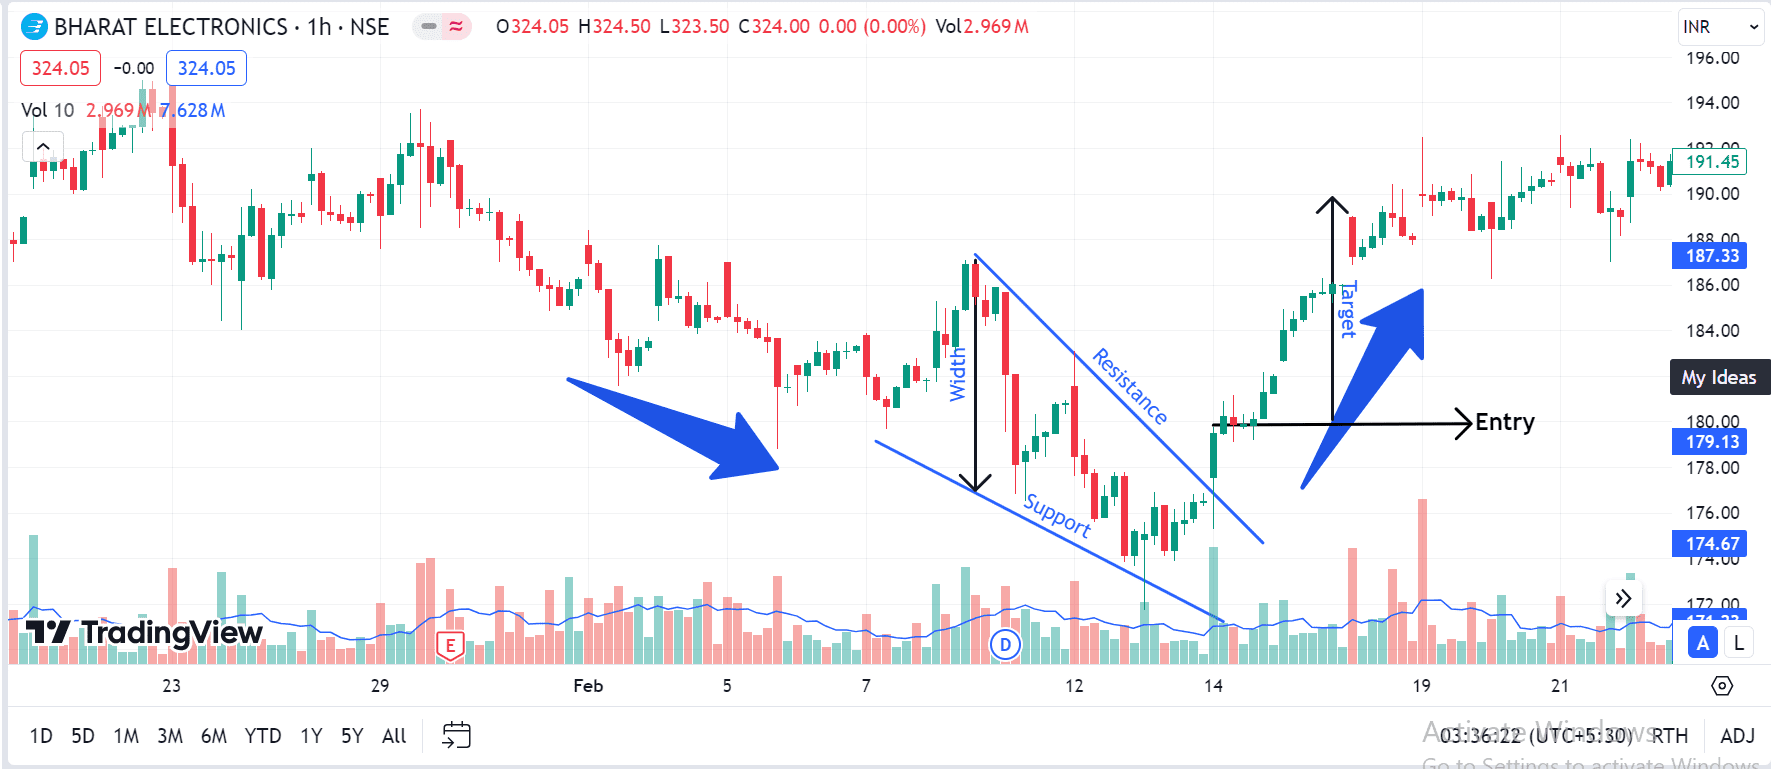
8. Rising and Falling Wedge Patterns
It is another bearish reversal pattern. The Rising Wedge pattern forms when the price makes higher highs and higher lows. If the price breaks below the lower trend line of the wedge, it indicates a bearish trend.
The Falling Wedge is formed when the price makes lower highs and lower lows. A breakout above the resistance line or upper trend line of the wedge indicates a bullish trend.
How to trade: In the Rising Wedge pattern, the price moving below the lower trend line confirms a bearish reversal. You can sell or create a short position, as the price might decline from here.
In the Falling Wedge pattern, use the opposite technique. Wait for a breakout above the upper trendline, which signals a bullish reversal. Following this trend, you can buy as the price might rise from here.
Key Points:
- The Rising Wedge pattern signals a bearish movement, while the Falling Wedge pattern signals a bullish movement.
- These patterns are useful for early prediction of upcoming market trends.
Example: Rising Wedge Patterns
Example: Falling Wedge Patterns
The Importance of Swing Trading Patterns
Understanding the signals of swing trading patterns will give you a better idea of market behavior and help you trade more strategically. The most important aspect of these patterns is that they provide you with a roadmap about when and what to do.
Swing trading is more than just buying and selling based on market whims. You can leverage these patterns to identify price movements that others might miss. Here’s why these patterns are important:
- Identifying Trend Reversals
Certain chart patterns signal when a current trend is losing strength. It can be a clear signal that you should prepare for a reversal. Moreover, syncing your entry with the signals generated by the chart pattern gives you optimum results. The exit point is also crucial for locking in profits before the market shifts in the opposite direction.
- Predicting Continuations
Knowing how long to hold on to your investment is equally important as when to sell them. Patterns also indicate when a price trend is likely to continue, enabling traders to hold investment positions longer for maximum gains.
- Providing Entry and Exit Points
As mentioned earlier in the blog, an accurate interpretation of swing trading patterns can give you precise points for entering and exiting trades. It will help you minimize risks and maximize returns.
- Risk Management
Patterns assist in setting stop-loss levels and reducing potential losses when the market moves against your position. When you interpret these patterns closely and strategize your trades around them, you can anticipate market behavior in a better way. It will definitely reduce the risk of making unnecessary and risky trades and help you get the optimum results.
After learning the importance and the fundamental mechanism of swing trading and related patterns, it is essential to get acquainted with different aspects of these patterns. There are several chart patterns for swing trading. Let’s discuss this group of chart patterns in detail.
Using Technical Indicators with Patterns
Swing trading patterns are highly popular among traders for their flexibility and reliability. However, experts suggest that using them with other technical indicators may enhance your chances of success. Indicators such as Moving Averages, Relative Strength Index (RSI), and MACD (Moving Average Convergence Divergence) can provide additional confirmation for pattern breakouts or reversals.
For example, suppose the asset price makes an Ascending Triangle pattern and gives a breakout above the resistance level formed by similar highs. Look at other indicators such as Moving Averages, volume, and RSI for confirmation. If the asset price is taking support from the Moving Average line, RSI reading is below 30 and the breakout occurred with high volume, then there are high chances of a bullish trend.
Advantages of Swing Trading
The best way of trading is to find the perfect balance between risk and reward. You should always focus on keeping the risk lower than the expected reward. This is where a swing trading pattern can be highly useful. It has multiple benefits that may make your trading journey smooth and pleasant. Here are a few of them:
- Flexibility: Swing trading allows traders to maintain a regular job or lifestyle while holding onto strategic trades over a few days or weeks.
- Fewer Trades: Unlike day trading, swing traders don’t need to place multiple trades daily. This results in lower transaction costs and less time consumption.
- Higher Profit Potential: In swing trading, you hold onto your positions for long durations. Thus, there is more time to capture big price moves, increasing the chances of higher profits.
- Clear Trend Identification: Swing trading patterns make it easier to spot trends and reversals, which are vital for making timely and informed decisions.
- Less Time-Consuming: You don’t need to monitor your trading account constantly. Instead, you can set alerts or automate trades based on specific pattern breakouts.
Read Also: 5 Must-Read Best Swing Trading Books for Trader
Conclusion
Swing trading can be an ideal choice for those who seek a balance between trading and long-term investment. By learning the different swing trading patterns mentioned in the blog, you can make better trading decisions and maximize your profit. However, it is advisable not to blindly rely on one pattern. Also, backing up these patterns with other technical indicators may increase accuracy and bring better results. However, it is advised to consult a financial advisor before making any trading decisions based on the above patterns. So, open a trading account and give your trading passion wings to fly.
Frequently Asked Questions (FAQs)
What is a Swing Trading pattern?
A swing trading pattern refers to chart patterns that are useful in doing swing trading. These patterns help traders predict future price movements, such as reversals or continuations, and allow them to make informed decisions about when to buy or sell stocks.
What are the most common swing trading patterns?
Some of the most common swing trading patterns include the Head and Shoulders pattern, Double Top and Double Bottom, Cup and Handle, Flag pattern, Ascending and Descending Triangles, Symmetrical Triangle, Rounding Bottom, and Wedge pattern.
How can swing trading patterns help manage risk?
It allows traders to identify crucial entry and exit points. Consequently, they can set stop-loss levels according to the pattern signals to minimize potential losses.
What are the advantages of swing trading compared to day trading?
Unlike intraday trading, swing trading allows traders to hold positions for several days or weeks. Thus, they can trade without stressing their daily routine much.
Can swing trading patterns be combined with technical indicators?
Yes, combining swing trading patterns with technical indicators can provide additional confirmation and increase the accuracy of trades.
How do I know when to enter or exit a trade using swing trading patterns?
Swing trading patterns provide visual cues for determining optimal entry and exit points. For example, in the Head and Shoulders Pattern, a trader can enter when the price breaks below the neckline and exit the position near the major support level.