Dragonfly Doji represents a situation where bearish momentum fades out, and bulls take control. It is one of the most common and simple candlestick patterns in technical analysis. The pattern is a good indicator of market reversals and can signal a price reversal in either a bullish or bearish direction. However, the pattern gives more accurate results if it appears after the end of a downtrend and indicates a bullish reversal.
In this blog, we will discuss the Dragonfly Doji pattern, its interpretation, advantages and limitations. Furthermore, we will look at an example to understand the trading setup better.
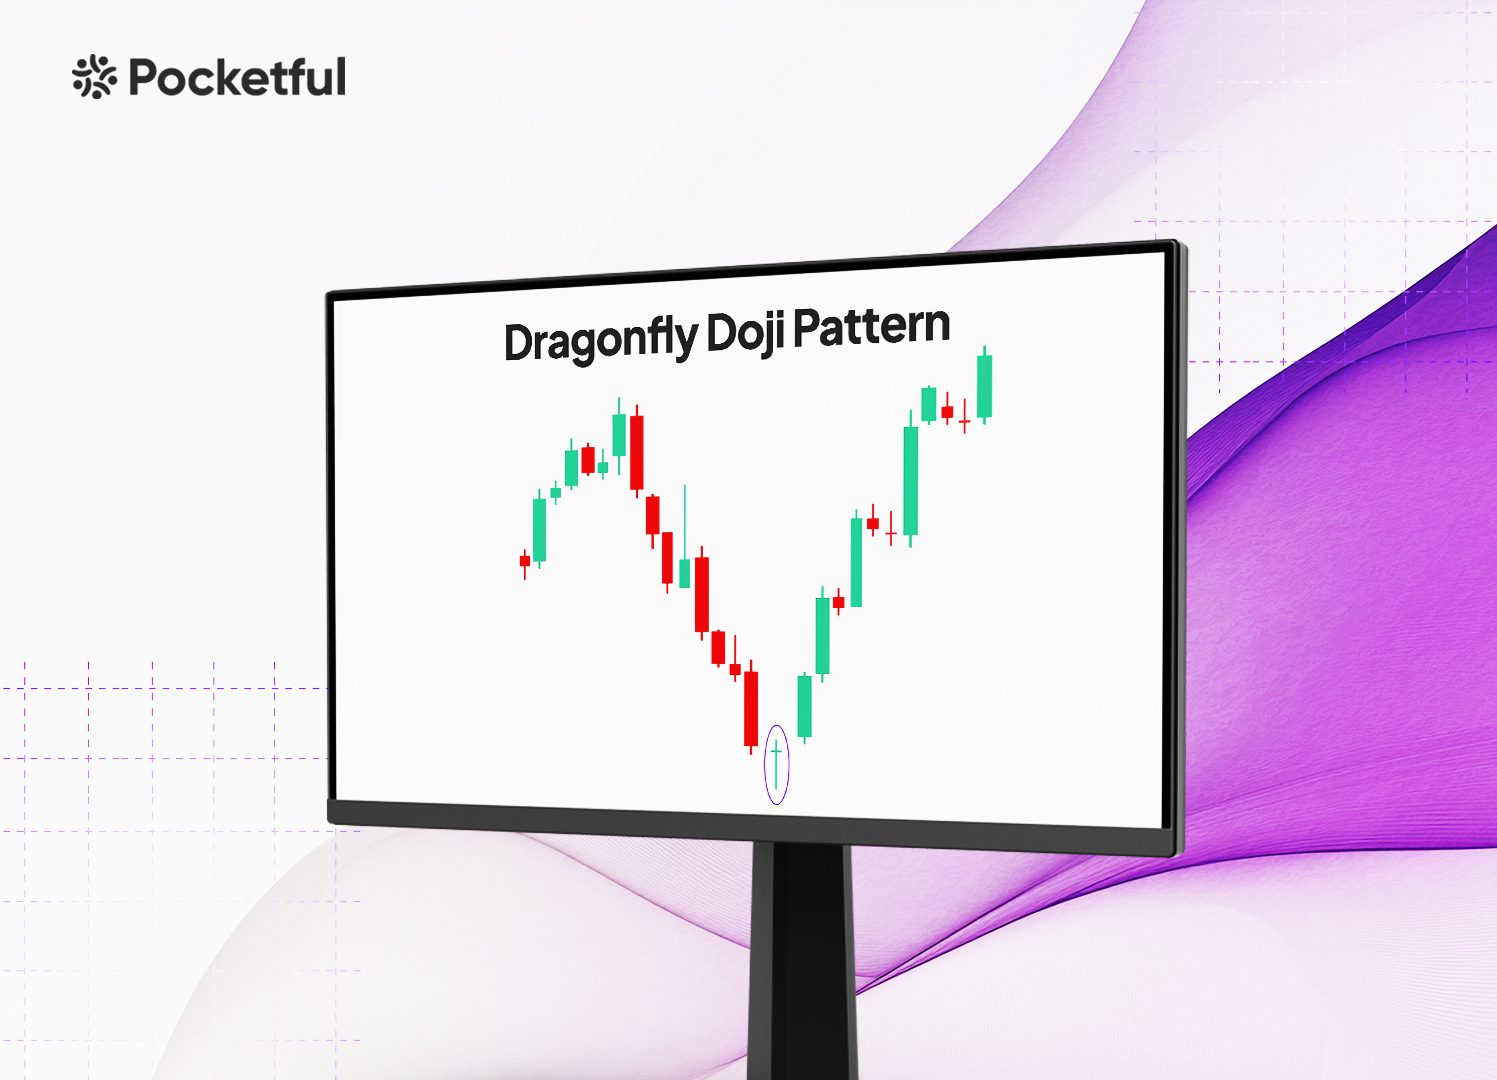
What is the Dragonfly Doji Pattern?
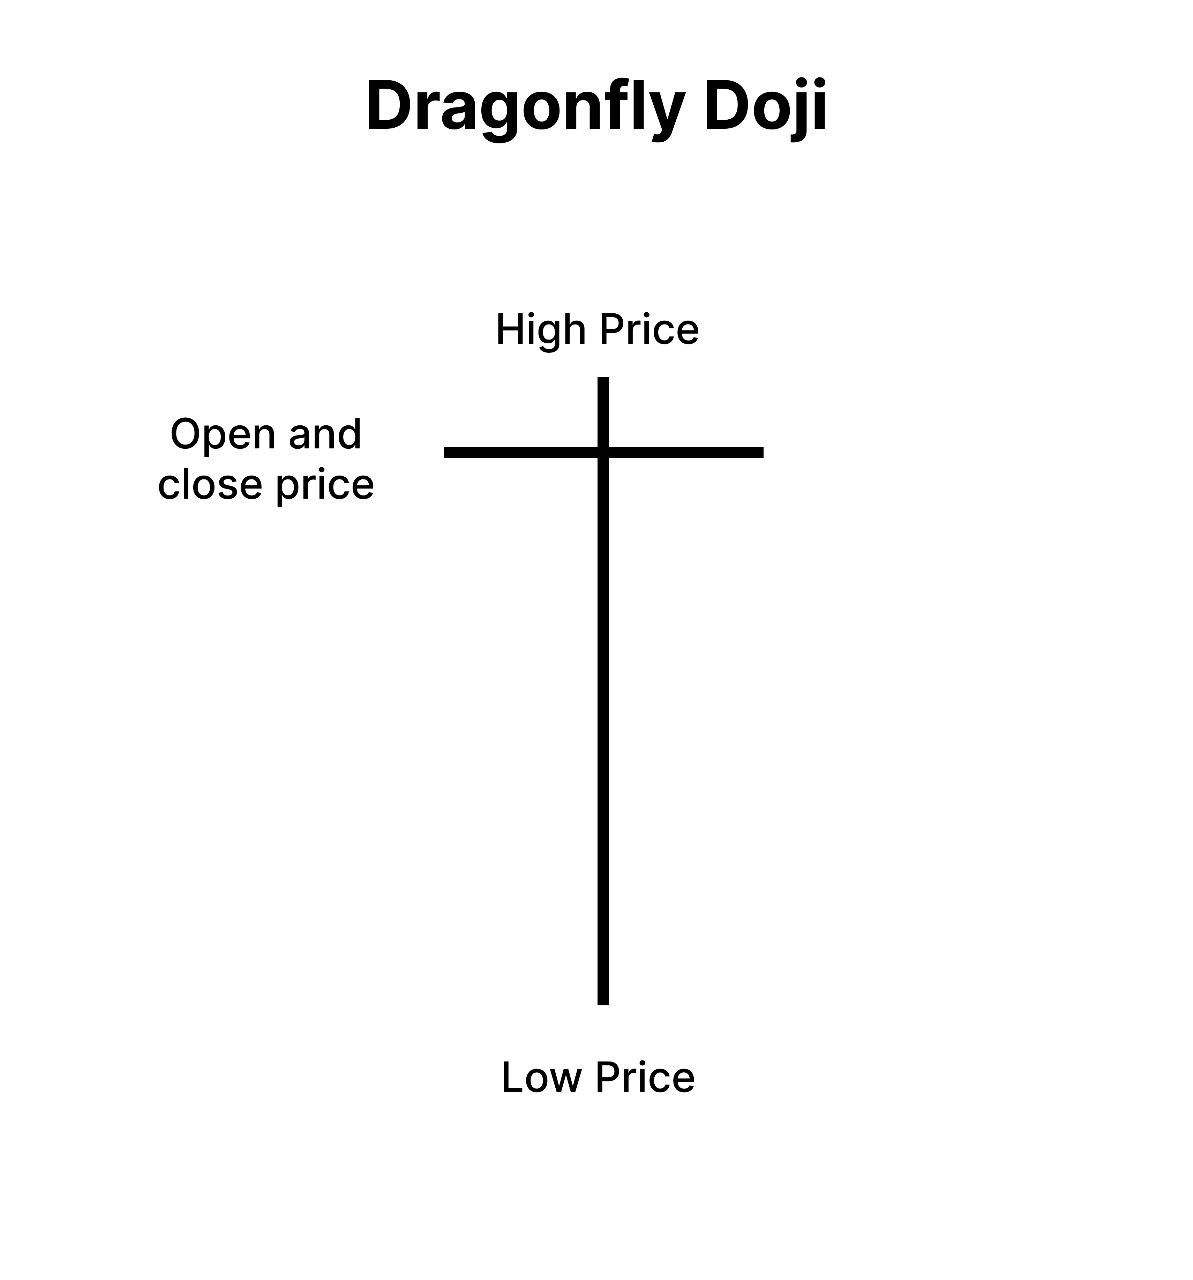
The Dragonfly Doji is a type of chart pattern that consists of a single candlestick, characterized by a long lower wick with little or no upper shadow and a small to no real body. The real body is negligible as open and close prices of the candlestick are at or near the same level. The pattern signals a potential reversal in price direction.
The Dragonfly Doji pattern is a technical analysis candlestick chart that signals possible reversals in market direction. If the pattern appears after a downturn and near key support levels, it signals a bullish reversal, and if it appears after an uptrend, then it signals a potential bearish reversal. However, the pattern is more effective in predicting uptrends and is thus considered a bullish reversal pattern by many traders.
Characteristics of the Dragonfly Doji Pattern
The characteristics of the Dragonfly Doji pattern are:
- Formation: The pattern can occur after a downtrend or an uptrend. The pattern consists of only one candle as it has a long lower shadow, resembling the shape of a Dragonfly.
- Location: Generally found near key support levels at the bottom of a downtrend.
- Appearance: It looks like an English alphabet ‘T’ with a smaller body and a longer lower wick.
- Psychology: The pattern has a long lower shadow, which means the sellers tried to push the price lower, but near the end of the trading session, the buyers pushed the price back up near the opening price, which indicates a potential shift in sentiment from bearish to bullish.
- Risk Management: As the pattern appears after a downtrend, a confirmation is required. Using proper stop-loss and risk-management strategies is crucial for success in the financial markets.
Trading Setup
Traders can use the below-mentioned setup to trade the Dragonfly Doji pattern:
- Entry Point: The trader can enter the trade when the asset price gives a breakout above the high of the Doji candle, meaning the next candle should be a bullish candle. A trader should wait for a bullish candle and take confirmation from an increase in volume for a strong reversal signal.
- Stop-Loss: A stop-loss should be placed below the lowest point of the Dragonfly Doji candlestick to have meaningful stop-loss and manage risk.
- Target: The target can be determined as the nearest resistance level or Fibonacci levels, or a risk-to-reward ratio can be used to calculate targets.
Read Also: Bullish Doji Star Pattern
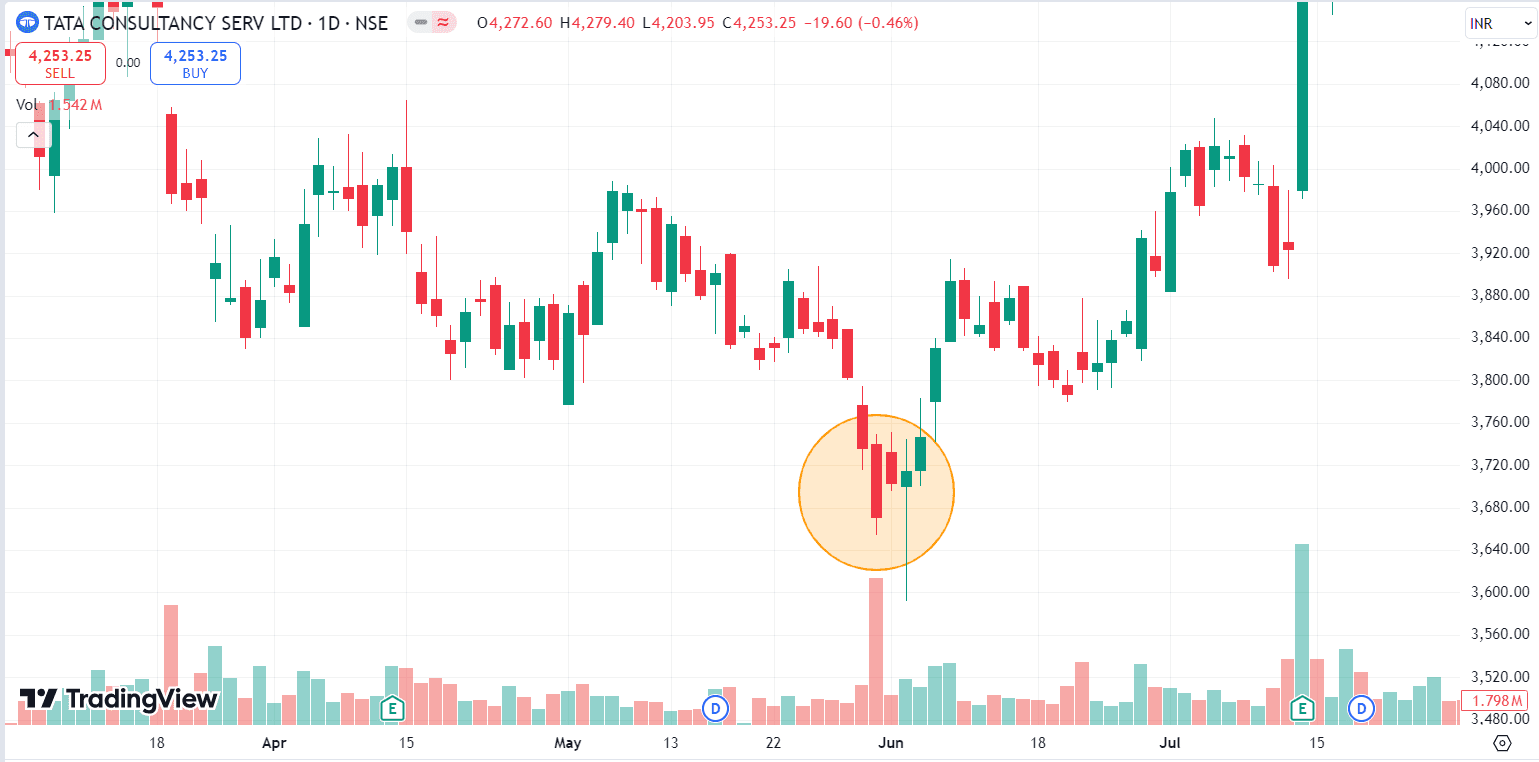
Example: Dragonfly Doji pattern of HDFC Bank Ltd.
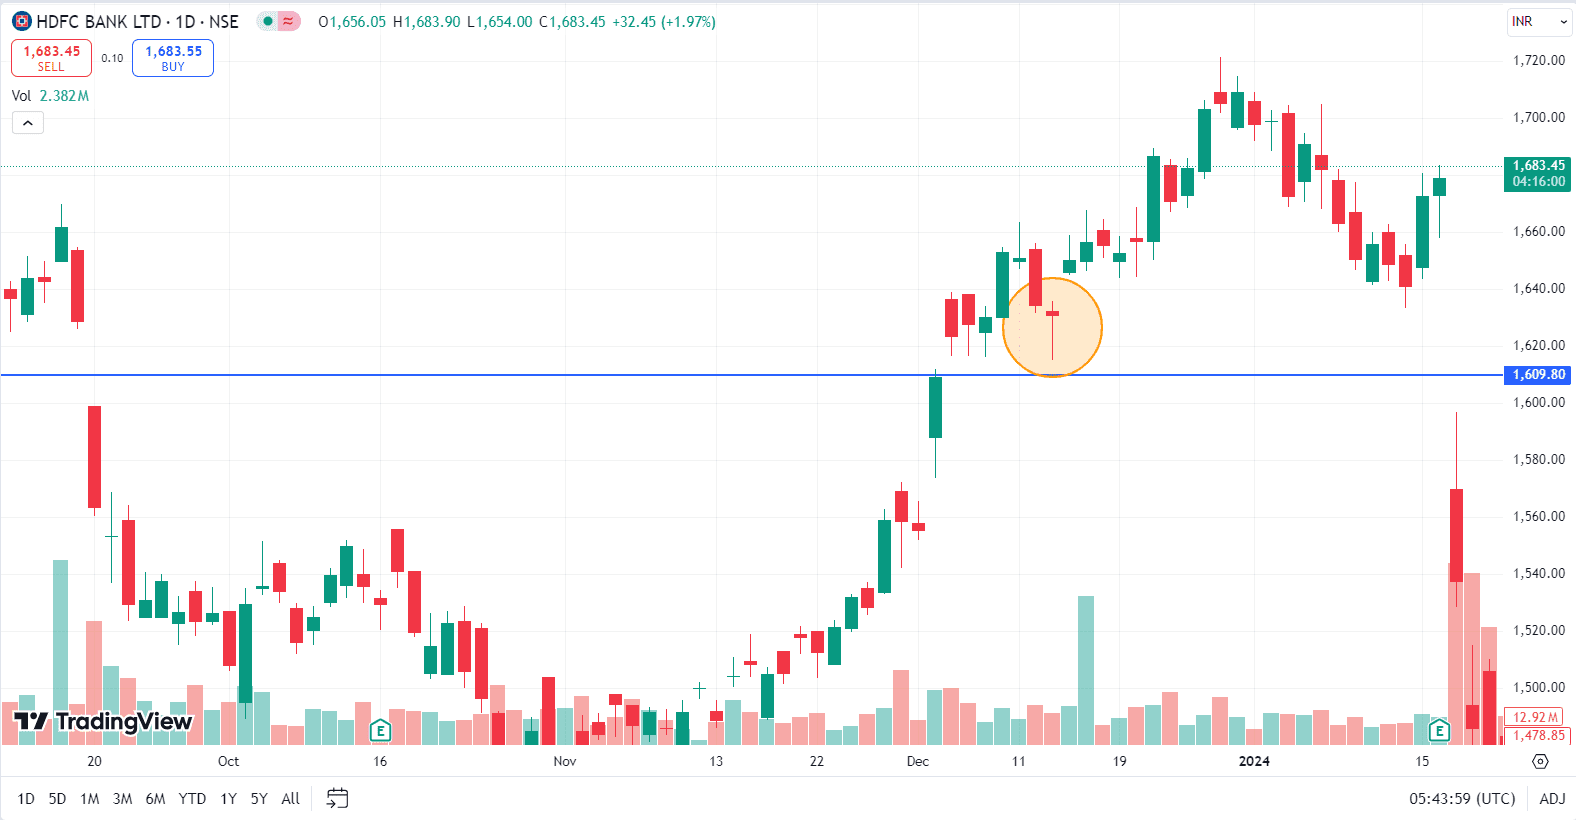
The above image shows the daily price chart of HDFC Bank Ltd. The stock made a Dragonfly Doji pattern on 13 December 2023. The low of the candle was INR 1,615, and the high was INR 1,636. The price level of INR 1,609 was a major support level previously, which was broken on 5 December 2023, thus making it a support level for future price actions. On 14 December 2023, the stock closed at INR INR 1,650, i.e. above the high of the Dragonfly Doji pattern. We can also notice a sharp increase in volumes on the next day, thereby confirming the expected bullish movement. The low of the Dragonfly Doji candle will serve as a stop-loss, and the target could be the nearest resistance zone. The stock price moved upwards and made a high of INR 1,721 on 28 December 2023.
Advantages of Dragonfly Doji Pattern
The advantages of the Dragonfly Doji pattern are:
- The pattern works in any market, such as equity, currency, commodity markets, etc.
- The pattern works in any time frame, but its appearance in a bigger time frame means strong trend reversal is expected.
- The pattern is a good reversal signal indicator.
- It is an effective tool in identifying support levels.
- It’s a very simple pattern to identify.
- This pattern gives a complete setup for stop-loss and target.
- The pattern allows effective risk management as it gives clear stop-loss levels.
- This pattern gives quite accurate results if the breakout above the high of the Dragonfly Doji candlestick occurs with strong volumes.
Limitations of Dragonfly Doji Pattern
The limitations of the Dragonfly Doji pattern are:
- The pattern cannot be used as a standalone indicator as it requires confirmation in the form of a bullish candle or an increase in volume.
- The pattern is of limited use in a strong downtrend.
- The pattern could give a false breakout, which can result in losses.
- This pattern could be affected by various market factors like volatility, news, policy change, political instability or any other factor.
Read Also: Long-Legged Doji Candlestick Pattern
Conclusion
Dragonfly Doji chart pattern is a powerful technical tool for investors and traders, though it requires confirmation as it occurs after a downtrend and indicates a potential change in trend. Generally, the Dragonfly Doji pattern works as a bullish reversal pattern if it appears after a downtrend and a bearish reversal pattern if it appears after an uptrend. However, the pattern generally signals a bullish reversal. It is characterized by a single candlestick with a long wick and a small or no real body, as at the end of the trading session, the price closes near open. It is important to understand the pattern’s characteristics, trade setup, risk management, and strategies before trading to make informed decisions and improve the chances of success in the markets.
Frequently Asked Questions (FAQs)
What Does the Dragonfly Doji pattern indicate?
It suggests a potential reversal of the prevailing trend. If it appears after a downtrend, it suggests a potential bullish reversal; if it appears after an uptrend, it suggests a potential bearish reversal.
What is the success rate of the Dragonfly Doji pattern?
The success rate or accuracy of the Dragonfly Doji pattern depends upon the market conditions and time frames. In a short-term time frame, it generates a weak reversal signal if not confirmed by volume or any other indicators and in a longer time frame (weeks, months, or years), the success rate is higher once confirmed by volume and other studies.
Can the Dragonfly Doji pattern fail?
Like any other chart pattern, this pattern also can fail, particularly if the breakout above the high of the pattern candlestick is not supported by a bullish candle or increase in volumes or if market conditions and news are against the pattern.
Is it easy to identify the Dragonfly Doji pattern?
Yes, it’s easy to identify this pattern, and it is one of the simplest patterns to trade.
Does the position of the Dragonfly Doji in the chart matter?
Yes, the location of the Dragonfly Doji pattern is important. If a Dragonfly Doji pattern appears after a downtrend near a key support level, it suggests a potential bullish reversal. If it appears after an uptrend near resistance, it may signal weakening upward momentum or a possible bearish reversal.