Each individual needs to exercise to stay healthy, and if you’re a health nut, then you must be spending a lot of time in the gym. However, comfortable exercise gear is essential, and “Adidas” is one of the first names that pop up when someone talks about sports shoes. Do you know the history of Adidas, one of the most popular shoe brands in the world?
In this blog, we’ll discuss Adidas and show you how it went from being a shoe producer to becoming the most popular sportswear brand worldwide.
Company Overview: Adidas
Adolf and his brother Rudolf Dassler created the Adidas company in 1924 under the name “Dassler Brothers Shoe Factory.” At first, the company’s primary concentration was on producing athletic footwear. In 1949, a dispute between the brothers resulted in the division of the business. Adolf Dassler went on to create Adidas, while his brother Rudolf founded Puma. Adidas shoes became popular when the German team wore them with screw-in studs and won the 1954 Football World Cup. This helped Adidas become a household name. The business became well-known over time when it was chosen as the official footwear partner of the World Cups. Due to fierce competition from Nike in the 1990s, the brand began producing fashion-oriented footwear and sportswear. The corporation has made several significant acquisitions, but the acquisition of Reebok in 2005 is seen as one of the most important ones since it allowed Adidas to compete with Nike and grow their market share in North America. The company established a digital presence and introduced a range of environmentally friendly products manufactured from recycled materials. The firm sold the Reebok brand in 2021 and started concentrating on its leading Adidas brand due to the COVID-19 pandemic and the tough economic conditions.
Adidas’s business Model is essential to its success. The following are the main components of their business model:-
Sponsorships – The company’s brand visibility is enhanced by sponsoring significant global events, such as FIFA and the Olympics.
Endorsements – The company endorses athletes like Mohamed Salah and Lionel Messi, which helps increase the popularity of the brand.
Collaborations – Adidas collaborates with influencers, artists, and celebrities, including David Beckham and Kayne West, to promote its brand.
Digital Marketing – The business uses a variety of hashtags and social media ads to promote its brand.
Event Marketing – Adidas also organizes events in many cities around the globe to engage with its target audience and increase brand awareness.
Customer Loyalty Program – This is another incredibly distinctive aspect of the business, whereby it uses several loyalty programs to reward its devoted customers.
Pricing Policy of Adidas
The company gains market share by utilizing a dynamic pricing strategy. Here is a summary of Adidas’ pricing strategy.-
Limited Edition – Adidas releases limited edition products in collaboration with different celebrities, which generates hype in the market.
Innovative Products – The business also specializes in high-performance footwear that uses cutting-edge technologies, such as 4D printing technology, etc. However, these products are expensive.
Value Pricing – The company also offers value-for-money products to draw mid-range customers and expand its market share.
Seasonal Discount – Adidas uses promotional offers, stock clearance deals, and seasonal reductions to move out of its inventory.
Geographical Pricing – The company’s pricing strategy varies depending on the location. For instance, prices in developed countries will be greater than in less developed countries.
Pricing Segment – Adidas categorizes its products into entry-level, mid-range, and luxury segments.
Conclusion
In conclusion, Adidas is one of the most popular shoe brands in the world. Adidas started operations as the “Dassler Brothers Shoe Factory” and was later renamed Adidas by Adolf Dassler. The company is known all over the world for its athletic apparel and sports footwear. As the leader in the athletic footwear industry, the firm maintains its position by using strategic pricing and marketing approaches. The business has also shifted to manufacturing products using eco-friendly and sustainable items.
S.NO.
Check Out These Interesting Posts You Might Enjoy!
Clothing is more than just fabric but is also a form of expression. Stylish clothing is necessary if you want to appear and express yourselves well at both parties and meetings. There are many different fashion labels on the market, and “Zara” is one of them.
In this blog, we will provide an overview of Zara, including their pricing strategy and business approach.
Zara – An Overview
Amancio Ortega and Rosalia Mera launched the business in Spain in 1975. The company was originally named Zorba and was later renamed Zara. Initially, the company sold fashion clothes at lower prices, similar to the designs of high-end fashion brands. Later, in 1980, the company expanded rapidly in Spain and became a well-known name in the fashion industry. The company efficiently manages its supply chain by manufacturing clothes in small batches, which helps in saving inventory costs. In 1988, the company expanded operations outside Spain and opened its first branch in Portugal. In 1990, the business opened several stores in cities like Tokyo, New York, and Paris. In 2001, Zara’s parent company, Inditex, went public and was listed on the Spanish Stock Exchange. Amancio Ortega, the founder, rose to prominence and became one of the richest persons in the world after the IPO. The company began operating its online store in 2010 to take advantage of e-commerce technology. The company launched the “Join Life” campaign, which reflects the company’s promise to utilize only sustainable fabrics by 2025 and use only eco-friendly materials.
Zara has a fashion-centric business model, and the company changes it according to market trends. The main components of Zara’s business model are as follows-
Supply Chain – The business guarantees that the product reaches the consumer on time because the company has an integrated supply chain, which includes distributors located all over the world.
Product Upgrade – The company reacts to the shifting fashion trends by launching new products in two to three weeks.
Designing of Products – With more than 700 internal designers, the organization produces more than 10,000 designs a year.
Production Policy – Due to the company’s restricted production of the dresses, a high turnover ratio is guaranteed as limited supply creates urgency among customers.
Product Policy – The corporation doesn’t manufacture in large quantities, which allows it to increase production if a new product succeeds and restrict output if a product fails.
Customer Satisfaction – The company requests feedback from customers regularly to enhance the quality of its products. Additionally, the company’s stores must submit daily sales reports to the company’s headquarters.
Limited Advertising – The company opens its store in prime locations in the city, relies heavily on word-of-mouth advertising, and spends very little on product advertising.
E-Commerce – The company has invested in developing its e-commerce platforms to further expand its operations in regions where Zara’s physical stores are not present.
A company’s pricing strategy is an essential component of its business model, especially if it is associated with the fashion industry, which can be extremely competitive. Zara’s pricing strategy is mentioned below:
Affordability – The company’s premium goods are accessible to the general public while still giving their customers a feeling of exclusivity due to restricted production.
Market Pricing – The company adjusts the product’s price according to the nations it operates in. For instance, in developed countries, prices are often higher than in developing countries.
Limited Discounts – Zara only offers discounts after the conclusion of a specific season to clear out their inventory. In general, they do not offer frequent discounts in their stores.
Cost Efficient – Zara has control over the production process, which allows them to reduce costs and increase their profit margins.
Conclusion
Zara is an excellent example of how a regional fashion brand can become one of the world’s leading fashion brands through integrated operations, innovative designs, and effective pricing strategies. The company’s strategy to manufacture products in small batches generates urgency among customers and helps it maintain its exclusive image. The company’s commitment to sustainability and the use of eco-friendly materials will be beneficial to the environment and will also help the brand attract new customers.
Frequently Asked Questions (FAQs)
Who founded Zara?
Amancio Ortega and Rosalia Mera founded Zara in 1975.
Is Zara an Indian company?
Zara is a global fashion brand that is owned by the Spanish fashion company Inditex. Tata’s Trent formed a joint venture with Inditex to run Zara stores in India.
When did Zara start their operation in India?
Zara began operations in India in May 2010 when it opened its first location in New Delhi.
Which company owns Zara?
Inditex is a Spanish company that owns Zara.
Who are Zara’s biggest competitors in India?
Zara’s biggest competitors in India include H&M, Reliance Trends, Zudio, GAP, Vero Moda, Marks and Spencer, etc.
Procter & Gamble Hygiene and Health Care, a subsidiary of Procter & Gamble, has played a vital role in the evolution of hygiene standards in India. This blog aims to present a complete case study on P&G Hygiene and Health Care Ltd., including a company overview, business model, and products it provides.
Procter & Gamble Hygiene & Health Care Ltd. Overview
Procter & Gamble Hygiene & Health Care Limited, an Indian subsidiary of US-based multinational company P&G, was incorporated on 20 July 1964 and is headquartered in Mumbai. The company operates in the FMCG sector in India, and its core operations are manufacturing and selling packaged FMCG products like feminine hygiene and health care products. The company has created a reputation for selling high-quality products to meet the ever-changing needs of consumers. P&G Hygiene and Health Care is one of the best FMCG companies in India.
Business Model of Procter & Gamble Hygiene and Health Care Ltd
Procter & Gamble Hygiene and Health Care Ltd. operates a very robust business model centred around product innovation, brand strength, and wide distribution. This results in the company generating revenue through personal care products, such as sanitary napkins, healthcare items, and beauty products, which amount to around 70% of the sanitary protection segment.
Strong brand loyalty and a portfolio of brands like Whisper and Vicks have contributed to its stable revenues. The company uses both conventional retail channels and e-commerce platforms. This helps ensure a very large outreach and accessibility for consumers across all strata of urban and rural society, further strengthening overall sales performances.
Products Portfolio of Procter & Gamble Hygiene and Health Care Ltd
The company operates in two segments: Health care products and Hygiene products. The hygiene products segment consists mainly of feminine hygiene products and other skin care hygiene products, whereas the health care segment comprises ointments and creams, cough drops and tablets, etc.
As of 2024, the company portfolio includes some very familiar brands such as Whisper, with more than 25% market share in sanitary napkins and Vicks, a popular healthcare product. The beauty segment includes Olay, while Gillette products cover the grooming segment. With over 40 different items in various categories, the company has a wide customer base. The company has such a big customer base mainly due to the firm’s line of women’s hygiene, oral care, and health supplements. P&G’s focus on quality and innovation helps the company build a loyal consumer base.
Market Details of Procter & Gamble Hygiene and Health Care
Financial Statements of Procter & Gamble Hygiene and Health Care Ltd
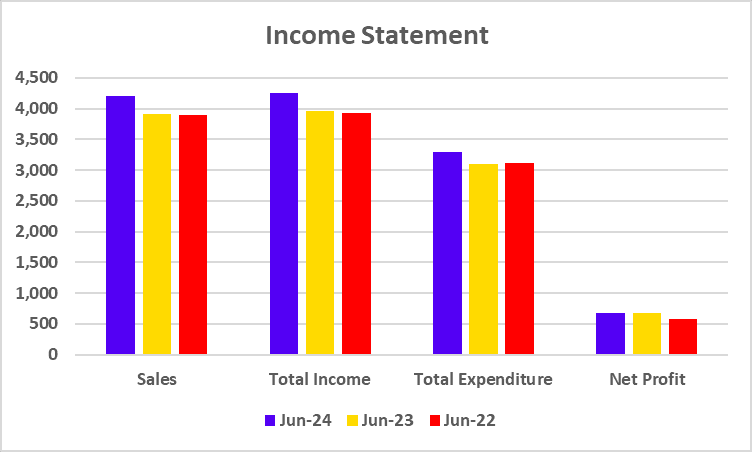
Income Statement
Particulars
June 2024
June 2023
June 2022
Sales
4,205
3,917
3,900
Total Income
4,257
3,958
3,925
Total Expenditure
3,291
3,107
3,123
Net Profit
675
678
575
(The figures mentioned above are in INR crores unless mentioned otherwise)
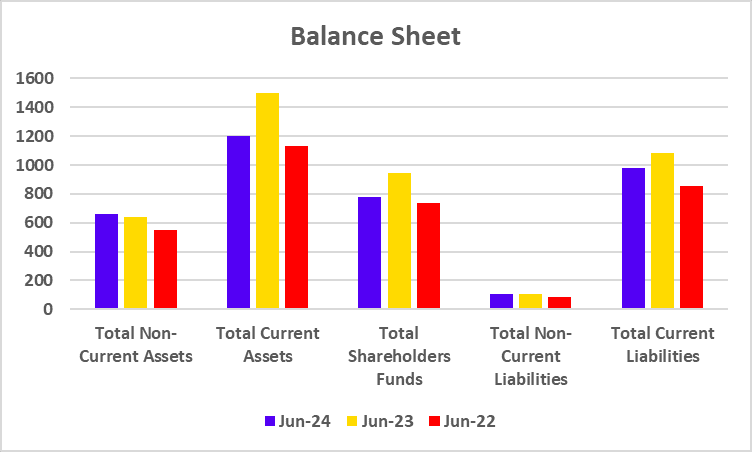
Balance Sheet
Particulars
June 2024
June 2023
June 2022
Total Non-Current Assets
659
642
547
Total Current Assets
1,200
1,496
1,134
Total Shareholders Funds
775
946
738
Total Non-Current Liabilities
103
106
86
Total Current Liabilities
981
1,085
858
(The figures mentioned above are in INR crores unless mentioned otherwise)
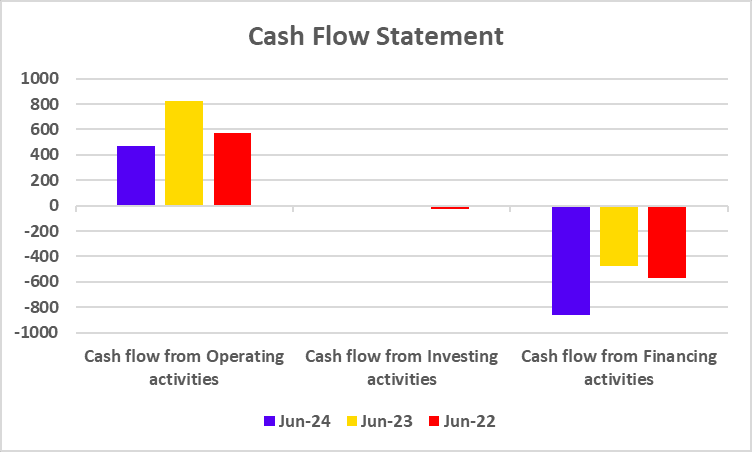
Cash Flow Statement
Particulars
June 2024
June 2023
June 2022
Cash flow from Operating activities
471
825
573
Cash flow from Investing activities
1
-9
-26
Cash flow from Financing activities
-862
-477
-568
(The figures mentioned above are in INR crores unless mentioned otherwise)
Key Performance Indicators (KPIs)
Particulars
June 2024
June 2023
June 2022
Net Profit Margin (%)
16.05
17.30
14.75
Return on Equity (%)
87.11
71.68
78.06
Return on Capital Employed (%)
110.03
80.85
97.31
Current Ratio (X)
1.22
1.38
1.32
EV/EBITDA (x)
52.19
49.99
50.19
SWOT Analysis of Procter & Gamble Hygiene and Health Care Ltd
Strength
Strong Portfolio of Brands: P&G has a broad portfolio of well-known brands around the world, like Whisper and Vicks, that command significant market shares.
Robust R&D Capabilities: The company spends a great amount on R&D, which supports new ideas and the creation of new and better products for its end-users.
Weakness
High Operational Costs: Due to intense competition in these segments, they are experiencing high production and distribution costs, which may affect performance.
Dependence on Mature Markets: Developed countries account for a large portion of P&G’s sales, which makes it susceptible to economic instability in those countries.
Opportunities
Changing Health Constraints: A higher degree of knowledge of hygiene and health will lead to more consumers seeking health-related P&G products.
Expansion in Emerging Markets: Emerging regions are commonly characterized by increased disposable income and, therefore, present a growth opportunity for P&G.
Threats
Regulatory Hurdles: Product safety and environmental concerns have a lot of regulatory rules associated with them that P&G must follow. Strict regulations result in high operating costs and make product development more complex.
Changing Consumer Behaviour: Consumer shifts toward natural and organic products can threaten the existing product lines of the company.
Procter & Gamble Hygiene and Health Care Ltd. stands out due to its strong portfolios of brands, commitment to innovation, and its direction toward sustainability and e-commerce. Even with such harsh conditions coming in the form of intense competition and economic fluctuations, the strategic focus on sustainability and e-commerce development has helped the company grow significantly over the years. Procter & Gamble is in a very great position to continue as a market leader and constantly looks to reach new consumer bases with improved products.
S.NO.
Check Out These Interesting Posts You Might Enjoy!
P&G follows very stringent quality standards through highly advanced research and development as well as aggressive testing on every product.
Is P&G committed to sustainability?
Yes, P&G has a strong commitment towards sustainability. For example, the company aims to use 100% recyclable or reusable packaging by 2030.
What is P&G’s market share in the sanitary napkin category?
P&G has about 25% of the market share in the sanitary napkin category due to its flagship brand, Whisper.
How relevant was P&G’s investment in R&D for the company?
Investments in research and development (R&D) made by P&G led to new product offerings that had positive responses from the market, enhanced customer satisfaction, and strengthened the firm’s competitive advantage.
In what ways did P&G reach out to the consumers regarding the hygiene initiatives?
P&G reached out to consumers by conducting surveys, community programs and social media & feedback pages.
No matter the brand of computer or laptop you own, whether you enjoy playing video games on it or use it for business purposes, most systems are powered by a single US-based manufacturer called “Intel Corporation.”
In this blog, we will delve into an Intel case study, exploring its costs and marketing tactics in Detail.
Intel Overview
Gordon Moore and Robert Noyce, with the help of an investor named Arthur Rock, established Intel in 1968. The company first concentrated on producing memory chips, and in 1971, it unveiled the Intel 4004, the first microprocessor in history. Additionally, they launched the x86 family of microprocessors, which went by the name of Intel’s 8088 chip and was found in nearly all personal computers. The corporation launched a Pentium series of processors during the dot com boom, increasing the value of its brand among customers. The company expanded its product line beyond processors in 2000, adding technologies such as networking, graphics, and mobile computing. AMD is another fierce rival of the corporation in the microprocessor market. The company lost out on a chance to get into the mobile chip business, but thanks to its Xeon processor, it dominated the cloud computing and data center markets. The corporation has purchased numerous companies throughout the world. For example, the company acquired Mobileye in 2017 for $15.3 billion to become a key player in the autonomous driving and advanced driver-assistance systems (ADAS) markets. The company’s CEO unveiled the IDM 2.0 plan in 2020, which calls for the company to manufacture chips for other businesses and consolidate its market position. However, AMD and other players like Apple, with their competitive products, pose a severe threat to the corporation. The headquarters of the corporation are located in California, USA.
The Intel marketing strategy has played a pivotal role in establishing the company as a global leader in the technology sector. The following are some essential components of Intel’s marketing strategies:
Brand Recognition – The business launched a successful marketing effort called “Intel Inside” in 1991, which helped it establish itself as the industry leader. Even today, “Intel” stands for performance and quality.
Segment Marketing – Intel provides various goods to meet the demands of every user. For example, they manufacture processors for laptops and desktops and also make graphic cards for other applications.
Strategic Partnership – The company has partnered with several equipment manufacturers, including Dell, HP, and Lenovo, to supply them with Intel processors.
Digital Marketing – To sell its products, the company also uses digital marketing and collaborates with various tech influencers and reviewers.
Event Marketing – The organization hosts events worldwide on different tech platforms to engage with IT experts, developers, industry professionals, etc.
Pricing Strategies of Intel.
Intel Corporation maintains its leadership position in the market thanks to its pricing methods. The following are their various pricing schemes-
Premium Pricing – High-performance Intel Core i7, i9, and Xeon processors are among the best processors available and are thus priced at a premium.
Segment Pricing – The corporation sets its prices in response to the customers’ requirements. For instance, their mid-range pricing will cover items like i3 and i5 processors; on the other hand, buyers will pay more for their high-end processors, such as K series processors.
Dynamic Pricing – The business has a dynamic price structure and adjusts the prices of its products according to the locations it serves, i.e., offering its products at lower prices in developing nations than in developed ones.
Product-Based Pricing – Intel categorizes its products based on their features and prices them differently. For example, it charges differently for processors than it does for cloud computing and data application solutions.
Finally, Intel has grown from a memory chip producer to the largest microprocessor manufacturer in the world, making it a household name. The company caters to all customer groups by offering high-end processors for gaming and business use, cloud storage, etc. The business is up against fierce competition from recent entrants in the market, such as AMD and Apple. Nevertheless, their marketing approaches have enabled them to establish themselves as the industry leader.
S.NO.
Check Out These Interesting Posts You Might Enjoy!
In today’s fast-paced world, an individual may not find time to visit different stores to buy all the items on his shopping list. What if we told you that there is a superstore that offers everything you need—from groceries to electronics—and that they do it at the most affordable price?
In this blog, we’ll offer an overview of the world’s biggest superstore, “Walmart,” and its marketing tactics.
Walmart Overview
Sam Walton established Walmart in 1962. They established their first location in Arkansas, usually provide their customers with low-cost merchandise, and prioritize effective supply chain management and logistics. In order to fund its expansion, the firm went public in 1970 and was listed on the US Stock Exchange. By the end of the year, it had approximately 250 stores and recorded a $1 billion sale. The company uses cutting-edge technology to manage its supply chain distribution and inventory, and it quickly became one of the USA’s fastest-growing retailers. By 1991, they had opened additional locations in Mexico and Canada, made investments in e-commerce, and developed a website. Walmart grew quickly in the 2000s, entering markets including China, Germany, and the UK, and by that time, they had generated $200 billion in revenue.
Nevertheless, their rare forays into nations like South Korea and Germany proved unsuccessful, forcing them to leave those markets. In order to strengthen their e-commerce operations and market reach, the company purchased Jet.com. In 2018, it also acquired a majority stake in Flipkart. The company was able to grow its online business during the COVID-19 pandemic because most of its physical stores were closed worldwide. At the same time, it introduced contactless shopping and Walmart+, a membership program, to compete with rival Amazon Prime.
The marketing strategy of the company focuses on its core value of offering the lowest price to its customers; a few of its strategies are mentioned below-
Lowest Price – Customers can compare its prices with other stores and see that it continually strives to deliver products at the lowest price.
Promotions and Discounts – The company offers weekly ad circulars with special discounts highlighted in them, as well as online coupons and promo codes.
Loyalty Program – The company provides exclusive discounts and loyalty benefits to its regular customers to keep them as clients for extended periods.
Membership Program – Similar to Amazon, the company offers memberships to its consumers and provides benefits like free shipping and other perks.
Store Experience – The company’s stores have a neat, orderly atmosphere and a variety of amenities. Additionally, their customer service representatives are incredibly polite and helpful to their clients.
Digital Marketing – Walmart’s online marketing team consistently shares interesting information on various social media networks.
Walmart Product Portfolio
The company offers a wide range of products to its customers; the categorization of the products are as follows-
Groceries – The company delivers all types of grocery products, including meat, dairy, snacks, frozen, packaged food, etc., to its consumers. In addition, the corporation provides its clients with private-label brands at affordable prices. Bakery and healthcare products are also available at Walmart locations.
Footwear and Dresses – Besides providing a large assortment of clothing from different brands in their stores, the company also offers private label products in the footwear and clothing categories.
Furniture and Home Décor – A Walmart store also has a variety of other home décor products in addition to furniture.
Electronics – Walmart also offers electrical goods, such as video games, air conditioners, and televisions. Additionally, it sells CCTV and other home security solutions.
Sports Equipment – The company also sells fitness equipment at its stores, like baseball, fishing gear, accessories, and athletic wear.
Finally, it should be noted that Walmart has grown from a bargain retailer to one of the biggest retail chains in the world due to creative marketing strategies and cutting-edge technology. The business has encountered difficulties in a few nations that have forced them to suspend operations. Walmart has a devoted customer base as they have consistently provided the lowest prices on a wide range of products.
Frequently Asked Questions (FAQs)
Is Walmart an Indian Company?
No, Walmart is a US-based multinational retail corporation that operates various retail stores worldwide.
Is Flipkart and Walmart the same company?
No, Flipkart is an Indian online e-commerce platform, and Walmart is a US-based retail store operator. However, in 2018, Walmart acquired a controlling stake of 77% in Flipkart.
Who are the major competitors of Walmart?
Walmart faces intense competition from companies like Amazon, Alibaba, Best Buy, Reliance Retail, Spencer, etc.
Who is the CEO of Walmart?
Doug McMillion is the current CEO of Walmart as of 26 September 2024.
Which company is bigger: Amazon or Walmart?
Walmart recorded $648 billion in revenue for the previous year, while Amazon claimed $575 billion. However, Walmart’s growth rate is only 6%, while Amazon’s is 12%, meaning that Amazon will eventually surpass Walmart.
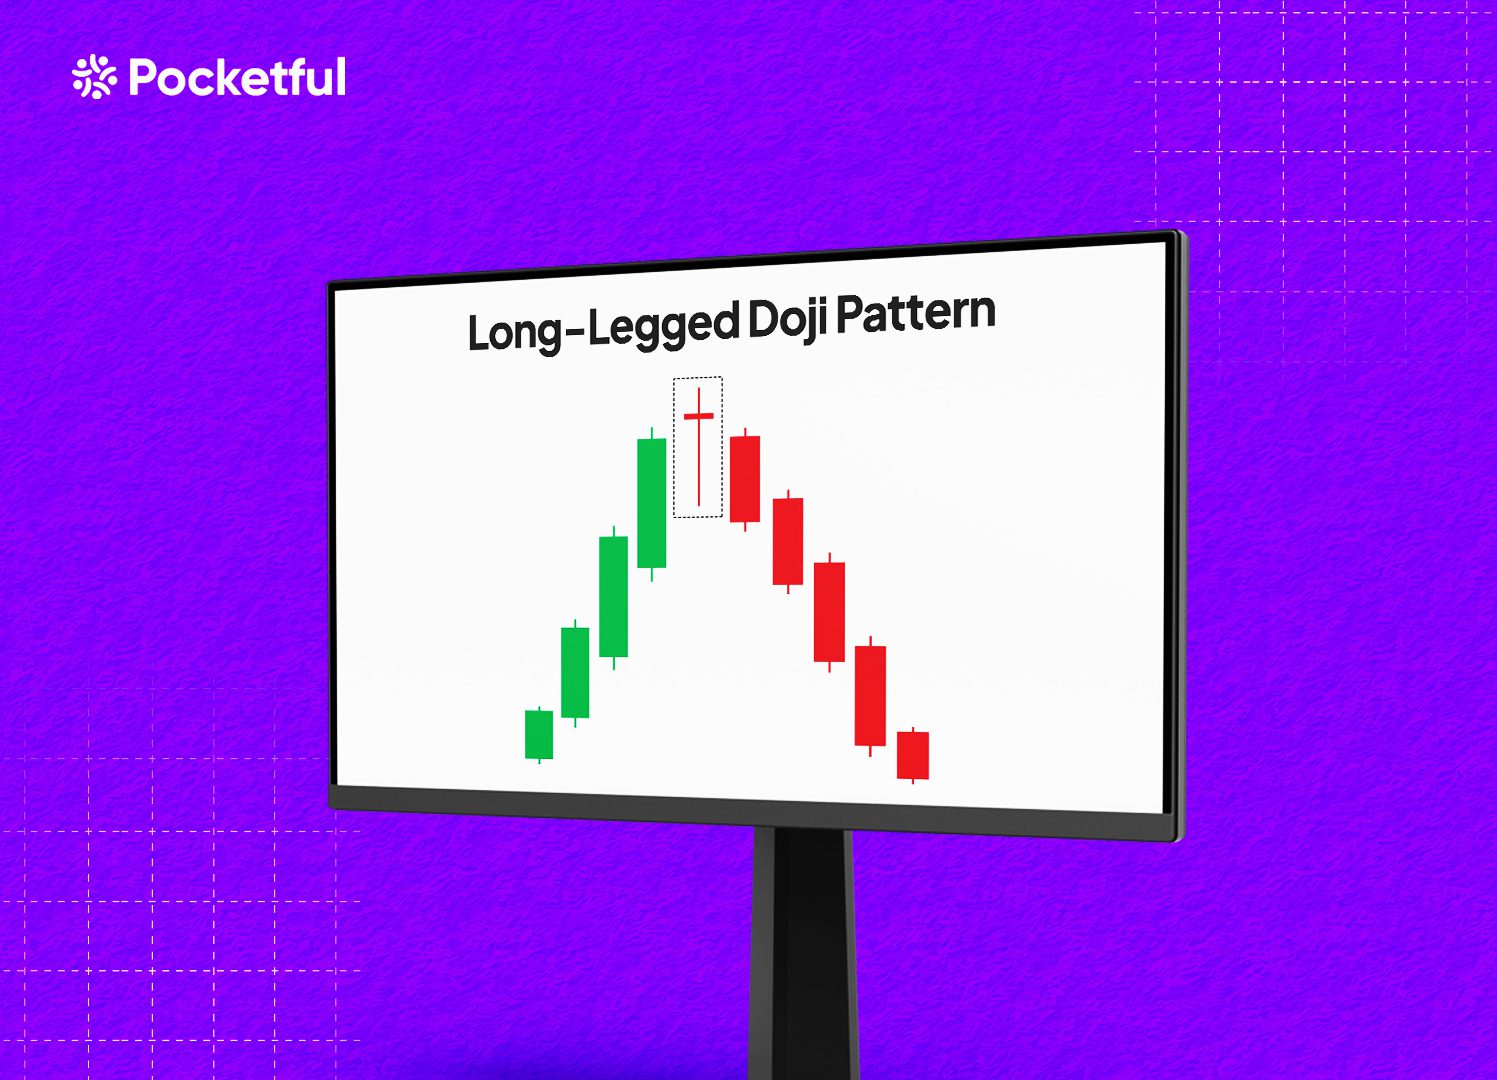
The Long-Legged Doji candlestick represents a situation where the market indecision meets volatility. A Long-Legged Doji is a candlestick pattern usually accompanied by high volatility but ends with no clear winner between bulls and bears. The pattern suggests indecision and can behave both as a reversal or a continuation pattern. Let’s dig deeper into it.
What is a Long-Legged Doji Candlestick Pattern?
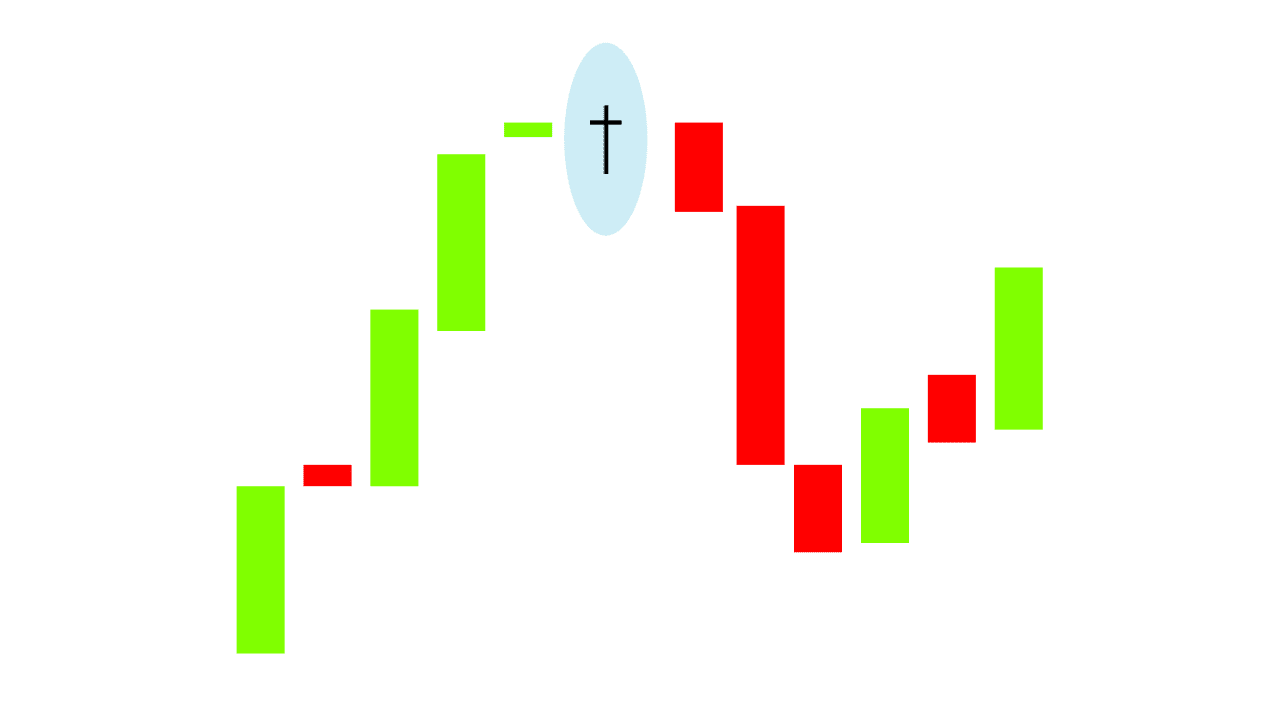
A Long-Legged Doji pattern is a type of candlestick pattern that can be observed in a candlestick chart. It is characterized by a long upper and lower shadow (or wick), with a very small or nearly invisible real body. The real body is small because the open and close prices of the asset are very close or equal to each other, indicating high volatility. This pattern reflects that both bulls and bears tried to influence the price of the security during the trading period but ultimately couldn’t push the price in one clear direction.
Characteristics of the Long-Legged Doji
The Long-Legged Doji pattern is a candlestick pattern used to identify a state of indecision in the market before the next big move occurs. It unfolds in the following phases:
A small real body: The real body of the candle is small as both the open and close of the candlestick are nearly identical.
Long upper and lower shadows: The long wick above and below the real body indicates both volatility and indecision. During the trading session, both the buyers and sellers tried to push the asset price in either direction, but neither of them had substantial influence, and the price closed near the opening price.
Volatility: The length of the shadows shows high volatility.
Market indecision: The Long-Legged Doji candlestick indicates that both buyers and sellers were active during the session, but nobody had control.
Location: The significance of Long-Legged Doji increases when it appears after a strong uptrend or strong downtrend as it signals momentum is weakening.
Other Considerations: Always wait for confirmation in the form of further price increases or declines after making the Long-Legged Doji candle. Once the next candle gives a breakout above the high or a breakdown below the low of the Doji candle, an individual should check the volumes. High trading volume during a breakdown or breakout confirms the change in trend, after which traders can create long or short positions.
This pattern helps traders recognize when a bullish or bearish trend may have come to an end. After confirmation, traders can create long or short positions.
Trading Setup
The Long-Legged Doji candlestick pattern can be effectively used by following the below trading setup:
Entry Point: The entry point should be when the price gives a breakout and closes above the Doji candle’s high for a long position or gives a breakdown and closes below the Doji candle’s low for a short position.
Stop-Loss: A stop-loss should be placed just above the high of the Long-Legged Doji for a short position or just below the low of the Long-Legged Doji candle for a long position.
Target: The target can be set at the next major support or resistance levels, Fibonacci levels, or traders can use a risk-to-reward ratio such as 1:2, 1:3, etc.
Advantages of the Long-Legged Doji Candlestick Pattern
The advantages of using the Long-Legged Doji candlestick pattern are:
This pattern can be identified in any market, such as equity, currency, or commodity markets.
The pattern works in any time frame, but a higher time frame means a strong trend reversal is expected.
It’s one of the popular candlestick patterns.
It is very easy to identify.
It indicates market indecision, which can signal a potential change in trend.
The pattern provides a logical understanding of price action and a complete trading setup.
The pattern can be used in combination with other indicators.
The pattern offers both buying or shorting opportunities in the market and a favorable risk-to-reward ratio.
Limitations of the Long-Legged Doji Candlestick Pattern
The limitations of using the Long-Legged Doji candlestick pattern are:
The pattern doesn’t provide clear bullish or bearish signals and shows indecision in the market.
The pattern can give false signals in sideways or range-bound markets.
The pattern could give a false breakout or breakdown and fail like any other chart pattern, which can result in losses.
This pattern could be affected by various market factors like volatility, news, policy change, political instability, etc.
The pattern doesn’t always signal a reversal; it could also signal a continuation of the trend.
The interpretation of a pattern’s signal is context-driven. For example, the pattern’s signal strength is weak if it occurs in the middle of the trend, without strong support and resistance levels nearby.
It requires confirmation.
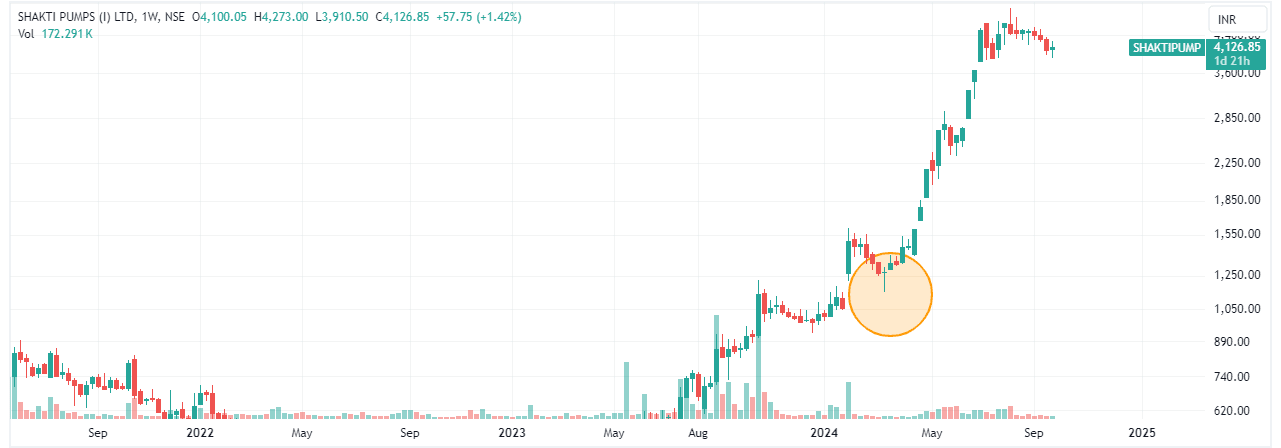
Example of Long-Legged Doji Pattern of Shakti Pumps Ltd:
Long-Legged Doji candlestick pattern example of Shakti Pumps Ltd.
The above image shows the weekly chart of Shakti Pumps Ltd. The stock was in an uptrend from May 2023 to January 2024, but then it faced resistance and came down a bit. The stock made a Long-Legged Doji chart pattern in March 2024, which depicted market indecision. Within the next few weeks, the stock price gave a breakout above the high of that Doji candle and closed above it. The stock price took support from INR 1,150 levels, which after the breakout became a strong support level. It confirmed the continuation of the trend, and the stock went up from the high of the Long-Legged Doji, which was around INR 1300, to INR 3000 in just two months and is trading at INR 4,067 as of 27 September 2024. The target zone can be marked near major resistance levels or Fibonacci levels. Stop-loss should be placed just below the Long-Legged Doji candle’s low. Traders can trail stop-loss once stock starts to go up.
The Long-Legged candlestick pattern is a popular and powerful technical tool for investors and traders alike. The pattern involves a Long-Legged Doji candle, which indicates indecision and depends on the next candle for confirmation. The real body of the Doji candle is so small that the asset price closes near the open of the candle. The Long-Legged Doji can be a valuable tool for detecting potential trend changes, but it must be used carefully and in conjunction with other technical indicators because it may generate false signals in the sideways market or due to sensitive news. Hence, it is very important to understand the pattern’s characteristics, trade setup, risk management, and strategies before trading this pattern. It is advised to consult a financial advisor before trading.
Frequently Asked Questions (FAQs)
Does a Long-Legged Doji always signal a reversal?
No, it doesn’t always signal a reversal. Sometimes, it can signal a continuation of the current trend. Hence, confirmation from the next candle is important before making any trading decision.
Where is a Long-Legged Doji pattern most effective?
The pattern is most effective when it appears at the end of a trend. The candlestick could appear at the top of an uptrend, the bottom of a downtrend, or near key support or resistance levels.
What does a Long-Legged Doji indicate?
It indicates indecision in the market as both buyers and sellers are unable to control the direction of the asset price. It can indicate that the current trend is losing momentum and that a reversal or consolidation is expected.
What is the difference between a Doji and a Long-Legged Doji?
A regular Doji has small or nonexistent upper and lower shadows and looks like a plus sign, indicating very little movement during the session. A Long-Legged Doji has longer upper and lower shadows, showing that there was much more volatility during the session before the price settled near the open.
Where should the stop-loss be placed for the Long-Legged Doji candlestick pattern?
Stop-loss can be placed just above the high of the Long-Legged Doji candle in case of a short position or just below the low of the Long-Legged Doji in case of a long position.
The stock market has always been a captivating subject, full of drama, suspense, and high stakes. Hollywood and streaming platforms have turned the thrill of trading, investing, and corporate battles into some of the most engaging movies and web series. Stock markets are a place with a lot of interesting stories, which the entertainment industry has depicted in creative ways over the years. The entertainment industry has done an excellent job of simplifying complex financial events so that anyone can understand them. However, most of them are based on real-life incidents that caused the stock markets to plummet.
In this blog, we will provide an overview of the best movies and web series about the share market that are worth watching.
Performance Table: Best Stock Market Movies and Web Series
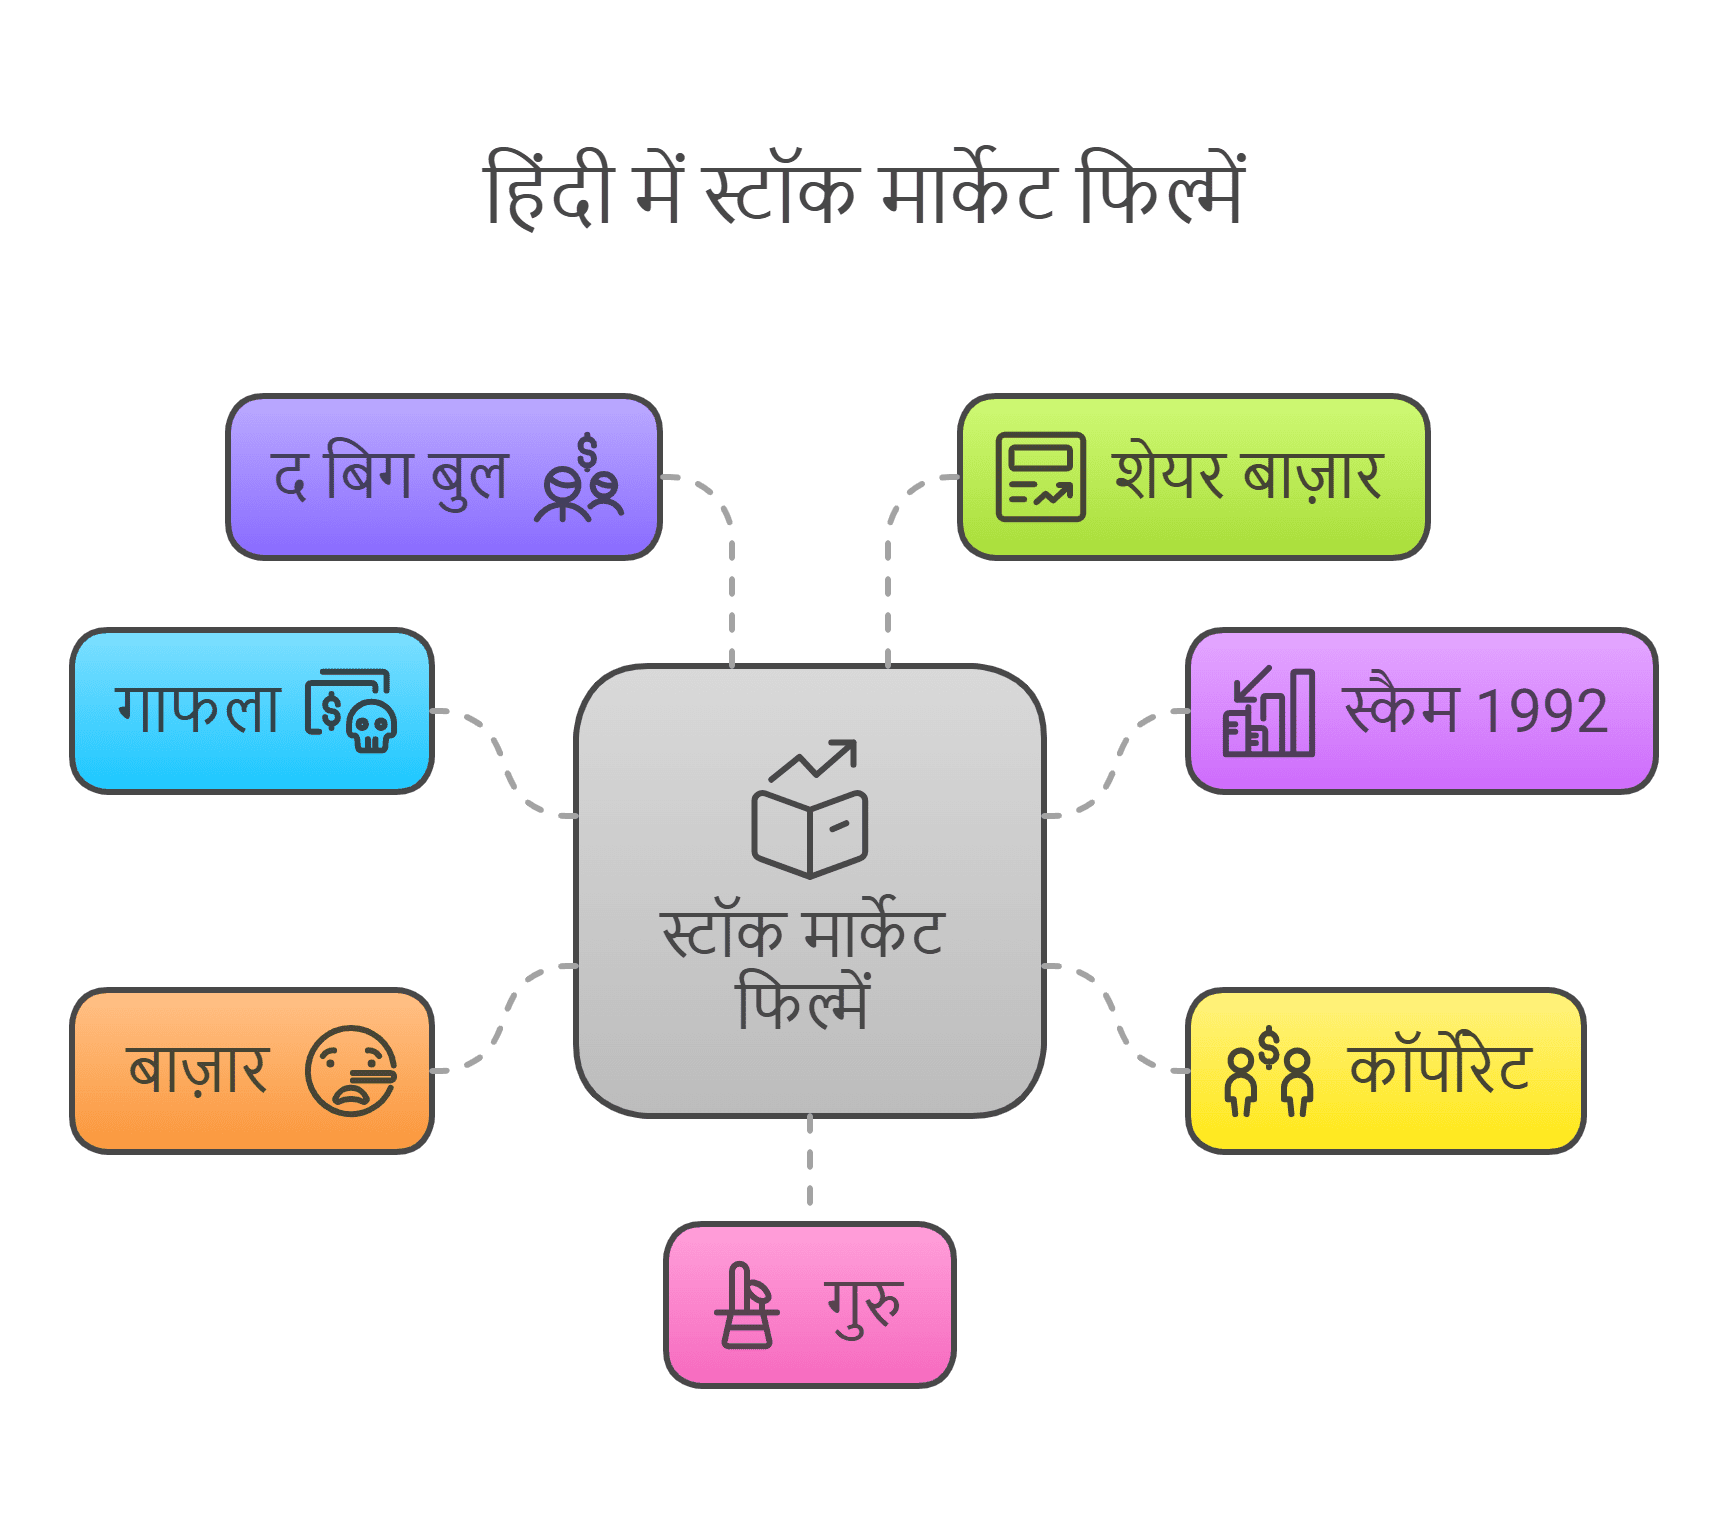
Here’s a table listing the best stock market-related movies in Hindi:
S.No.
Movie/Series
Year
Plot/Theme
Highlights
1
Gafla
2006
A young man enters the stock market and gets involved in scams.
Inspired by the Harshad Mehta scam.
2
Scam 1992: The Harshad Mehta Story
2020
Chronicles the rise and fall of Harshad Mehta in the stock market.
Realistic depiction of the stock market and its inner workings.
3
Corporate
2006
A drama about corporate rivalries and ethical dilemmas.
Explores power dynamics in business boardrooms.
4
Baazaar
2018
A young aspirant gets involved in the greed and deception of the financial world.
Slick portrayal of the stock market with standout performances.
5
The Big Bull
2021
A dramatized take on the Harshad Mehta-inspired stock market boom of the ’80s and ’90s.
Comparable to Scam 1992 but with a cinematic approach.
6
Share Bazaar
1997
Focuses on the ups and downs of the stock market.
One of the earliest Hindi films about the stock market.
7
Guru
2007
Loosely inspired by Dhirubhai Ambani’s life and rise as an industrial tycoon.
Explores ambition, business strategies, and financial risk-taking.
These movies and series provide a mix of drama, thrill, and education about the stock market and financial industries, making them engaging for audiences with an interest in this field.
Overview of the Best Share Market Movies and Web Series
The overview of the stock market movies and web series are:
1. The Wolf of Wall Street (2013)
The film, which was released in 2013, was based on the true story of Jordan Belfort, a stockbroker who operated a dishonest brokerage business. It is revealed in this film that Jordan co-founded Stratton Oakmont with a man by the name of Donnie and that the company participated in pump-and-dump stock price manipulation. As a result, Jordan has amassed an enormous fortune over time and subsequently becomes entangled in illicit operations, including drugs, women, and other things. Subsequently, they caught the interest of law authorities, notably the FBI. After an investigation, he lost all his wealth and faced serious repercussions. Leonardo DiCaprio portrayed Jordan in the film. The film was financially successful and made over $400 million.
Genre: Biography, Comedy, Crime
Director: Martin Scorsese
Starring: Leonardo DiCaprio, Jonah Hill, Margot Robbie
Key Takeaway: The dangers of unethical practices in the stock market.Language: English
Budget: ₹830 crore (approx.)
Earnings: ₹3,254 crore (approx.)
Available On: Netflix, Amazon Prime Video
2. Scam 1992: The Harshad Mehta Story (2020)
A book named “The Scam: Who Won, Who Lost, Who Got Away” was written by journalists Sucheta Dalal and Debashis Basu. The book’s contents served as the basis for the “Scam 1992: The Harshad Mehta Story”, which was released in 2020. The series narrates the tale of the largest financial fraud in India, which took place in the early 1990s. Pratik Gandhi played the role of Harshad Mehta. Mehta was well-known for his aggressive investment strategies and market manipulation methods. During his time, the Indian stock market soared to astronomical highs, due to which he was known as the “The Big Bull.” His prowess in manipulating the Indian Banking System and stock prices caught the attention of journalist Sucheta Dalal, portrayed by Shreya Dhanwanthary. She investigated the fraud and released her findings, which led to Harshad Mehta’s arrest, and ultimately, the Indian stock market crashed.
Key Takeaway: The importance of transparency and the potential consequences of exploiting financial loopholes.
Language: Hindi
Budget: Not publicly disclosed
Earnings: Not applicable (TV series)
Available On: SonyLIV
3. Margin Call (2011)
This American film narrates the actions performed by the employees at a large Wall Street investment bank for 24 hours during the financial crisis of 2007–2008. The movie’s title describes a scenario where an investor must increase the assets pledged as security for a loan after their value drops below a predetermined threshold. Eric Dale, the company’s head of risk management, developed a model that reveals a financial risk that could cause the firm to collapse. He alerted his bosses and other executives to the risk, but they initially ignored it. In an attempt to stay out of bankruptcy, companies strive to sell off their assets by the next day. This film illustrates how financial company mismanagement caused the global share market to crash.
Genre: Drama, Thriller
Director: J.C. Chandor
Starring: Kevin Spacey, Paul Bettany, Jeremy Irons
Key Takeaway: The risks involved in financial markets and how decisions made in crisis moments can impact the world.
Language: English
Budget: ₹29 crore (approx.)
Earnings: ₹161 crore (approx.)
Available On: Amazon Prime Video, Hulu, Peacock
4. Inside Job (2010)
The 2010 documentary Inside Job showcases the circumstances leading up to the financial crisis of 2007-2008. The documentary starts with an analysis of prevalent deregulations in the finance industry in the early 1980s. The dangerous aspects of these decisions are explained in the film, including mortgage-backed securities and credit default swaps. The film examines the economic bubble and how rising real estate prices encouraged banks to lend money without first determining the borrower’s creditworthiness. In 2007 and 2008, subprime loan defaults caused investment banks like Lehman Brothers and Bear Stearns to fail, while the government bailed out other institutions like AIG. The film illustrates how senior bank executives disregarded established guidelines, which caused the world stock market to collapse.
Genre: Documentary
Director: Charles Ferguson
Narrated by: Matt Damon
Key Takeaway: The far-reaching consequences of financial corruption and the need for transparency and regulation in the financial industry.
Language: English
Budget: ₹17 crore (approx.)
Earnings: ₹64 crore (approx.)
Available On: Netflix
5. Rogue Trader (1999)
Rogue Trader is a movie based on a true story about a reckless trader named Nick Leeson who made financial decisions that caused the UK-based Barings Bank to fail. The autobiography “Rogue Trader: How I Bought the Barings Bank and Shook the Financial World” served as the inspiration for the film. The film starts with the story of a young banker named Nick Lesson, portrayed by Ewan McGregor, who works for Barings Bank and is assigned to Singapore to oversee derivatives trading at the Singapore International Monetary Exchange. Through his aggressive trading, he generated significant profits right away. Afterwards, he started to lose money, but instead of disclosing it, he kept it hidden in a secret account and intended to use riskier wagers to win it back. After placing a large bet on the potential stability of the Japanese market, he lost a significant amount of money—roughly 827 million Euros—when the Japanese stock market experienced a correction in 1995 due to an earthquake in Japan. This event ultimately caused Barings Bank to fail.
Genre: Biography, Drama
Director: James Dearden
Starring: Ewan McGregor, Anna Friel
Key Takeaway: The dangers of unchecked power and the devastating impact one individual’s actions can have on the financial world.
Language: English
Budget: ₹105 crore (approx.)
Earnings: ₹13 crore (approx.)
Available On: Amazon Prime Video, Tubi
6. Wall Street
Wall Street is a film about the ins and outs of Wall Street and how people engage in insider trading. The film’s protagonist, Charlie Sheen, plays the role of Bud Fox, a young stockbroker with big goals in the financial world. Gordon Gekko is a smooth-talking, brash and ruthless corporate raider, portrayed by Michael Douglas. In search of success, Bud, a junior stockbroker, encountered Gordon Gekko, a wealthy and assertive stock market participant. Fox’s father, a maintenance worker’s union leader at an airline, provides him with some insider knowledge about a business, which Bud tells Gordon. For his performance in this film, actor Michael Douglas was awarded the Academy Award for Best Actor. The greed, power, ambition, and ethics of a person who is prepared to give up all for their achievement are all depicted in the film.
Genre: Drama
Director: Oliver Stone
Starring: Michael Douglas, Charlie Sheen
Key Takeaway: The consequences of corporate greed and ethical compromises.
Language: English
Budget: ₹124 crore (approx.)
Earnings: ₹362 crore (approx.)
Available On: Disney+, Amazon Prime Video
7. The Big Short
The Big Short, based on a non-fiction book by Michael Lewis, was released in 2015 and was regarded as a critically acclaimed film. Adam Mckay directed it. The events leading up to the 2008 financial crisis are explained in the movie. The film is about the people who foresaw the 2008 financial institution meltdown and placed bets against it, ultimately making substantial profits.
Christian Bale plays the role of Michael Burry, a hedge fund manager with a distinct perspective on the market. He studies the mortgage industry and concludes that the loans given out by financial institutions are risky and prone to fail. It draws attention to how subprime loans triggered the expansion and collapse of the US housing market. In addition to being a commercial success, this film won other accolades, including the Academy Award for Best Adapted Screenplay.
Genre: Biography, Comedy, Drama
Director: Adam McKay
Starring: Christian Bale, Steve Carell, Ryan Gosling
Key Takeaway: Understanding the risks and ethical implications of subprime mortgages.
Language: English
Budget: ₹231 crore (approx.)
Earnings: ₹1,102 crore (approx.)
Available On: Netflix, Amazon Prime Video
8. Boiler Room
The film Boiler Room, directed by Ben Younger, was released in 2000. The film is focused on the world of brokerage firms involved in questionable and frequently unlawful trading activities. Giovanni Ribisi played the role of Seth Davis, a young man who operates an unlicensed casino in his apartment after dropping out of college. He later worked for a brokerage company called J.T. Marlin, where he learned how to aggressively offer worthless penny stocks—to gullible customers and persuade them that they have a fantastic investment opportunity. He later learns about the negative aspects of JT Marlin’s company, including the pump and dump strategy, exploiting clients to make enormous profits. The film was made on a budget of $7 million and earned approximately $28 million at the box office.
Genre: Crime, Drama, Thriller
Director: Ben Younger
Starring: Giovanni Ribisi, Vin Diesel
Key Takeaway: The dangers of stock fraud and the impact of unethical trading.
Language: English
Budget: ₹58 crore (approx.)
Earnings: ₹232 crore (approx.)
Available On: Amazon Prime Video, Hulu
9. Too Big to Fail
The 2011 HBO film centers on the 2008 financial crisis and the responses of Federal Reserve Chairman Ben Bernake and Treasury Secretary Henry Paulson to the failure of Lehman Brothers. The film’s central theme is how the collapse of one organization might affect the collapse of the global financial system. Intense pressure and political scheming were also featured in the film as the Fed Chairman and New York Fed President attempted to stop the financial system from collapsing. Paul Giamatti played the role of Federal Reserve Chairman Ben Bernanke in the film, while James Woods portrayed Lehman Brothers CEO Dick Fuld. Critics praised the film for its narrative, directing, and acting, and it has been nominated for multiple awards, including the Screen Actors Guild and Golden Globes.
Genre: Drama
Director: Curtis Hanson
Starring: William Hurt, Paul Giamatti
Key Takeaway: The consequences of poor financial management and the efforts to prevent economic disaster.
Language: English
Budget: Not publicly disclosed
Earnings: Not applicable (TV film)
Available On: HBO Max
10. Enron: The Smartest Guys in the Room
The growth and fall of the Enron Corporation, one of the worst business scandals in the United States, is the subject of the 2005 documentary Enron, which Alex Gibney directed. Bethany Mclean and Peter Elkind’s book served as the basis for this documentary. Enron’s management committed a significant accounting scandal that ultimately caused the company to go bankrupt in 2001. The corporation manipulates accounting procedures and inflates its profits. Energy costs increase due to the company’s purposely induced power and energy constraints in California. In addition to receiving numerous honors and praise from critics, this documentary was nominated for an Academy Award for Best Documentary Feature.
Genre: Documentary
Director: Alex Gibney
Key Takeaway: The destructive effects of corporate fraud and the need for transparency.
Language: English
Budget: ₹5.8 crore (approx.)
Earnings: ₹39 crore (approx.)
Available On: Amazon Prime Video, Hulu
11. Billions
In 2016, this American television show made its debut. Personal rivalry, legal conflicts, and the fierce world of hedge funds were portrayed in the series. The show centers on two powerful individuals: Bobby Axelrod, played by Damian Lewis, who is the head of Axe Capital and a billionaire hedge fund manager, and Chuck Rhoades, played by Paul Giamatti, a US attorney who, despite his intelligence, has a vicious personality and is determined to bring Axelrod down. Later in the series, Mike Prince, a billionaire, appeared as Axe’s new rival. The script, directing, plot, acting, and other aspects of the Billions series have all won praise from critics.
Genre: Drama
Creator: Brian Koppelman, David Levien
Starring: Damian Lewis, Paul Giamatti
Key Takeaway: The personal and legal battles within the hedge fund industry.
Language: English
Budget: Not publicly disclosed
Earnings: Not applicable (TV series)
Available On: Showtime, Amazon Prime Video
12. Baazaar
Gauravv K. Chawla directed the 2018 Bollywood film Baazaar. Rohan Mehra portrayed the character of Rizwan Ahmad, an ambitious man from a tiny Indian town who wants to pursue a career in the stock market. Saif Ali Khan, a formidable and enigmatic businessman, portrayed Shakun Kothari. After meeting Shakun Kothari, Rizwan began managing his investments and used insider information to make profits. The negative aspects of the stock market are portrayed in this film. The film, which portrays greed, ambition, and moral compromise, draws inspiration from several Hollywood productions, including Wall Street and The Wolf of Wall Street.
Genre: Crime, Drama, ThrillerDirector: Gauravv K. Chawla
Starring: Saif Ali Khan, Rohan Mehra
Key Takeaway: The moral compromises people make to achieve financial success.
Language: Hindi
Budget: ₹34 crore (approx.)
Earnings: ₹40 crore (approx.)
Available On: Amazon Prime Video
13. Gafla
Gafla is a 2006 Bollywood film directed by Sameer Hanchate. The main focus of the film is to portray the details of Harshad Mehta’s stock market scam. The movie shows how a driven individual who aspires to succeed discovers loopholes in the Indian financial system and utilizes them to make huge profits. The story’s protagonist, Subhod Mehta, is a tiny businessman with an interest in the stock market. He quickly establishes his financial empire by using his high-risk trading methods to control stock prices, but he must finally confront the market’s negative aspects, too. He joined the stock market with huge ambitions but later turned to immoral behavior in an attempt to appease brokers and investors.
Genre: Drama, Thriller
Director: Sameer Hanchate
Starring: Vinod Sharawat
Key Takeaway: How ambition and manipulation can lead to massive consequences.
Language: Hindi
Budget: Not publicly disclosed
Earnings: Not widely released
Available On: YouTube
14. Black Monday
It’s a television show that ran from 2019 to 2021 and was produced by David Caspe alongside Jordan Cahan. The film is based on an event that occurred in 1987, when one of the biggest stock market crashes in history occurred on October 19. Don Cheadle plays the role of Maurice Monroe, the head of a successful brokerage firm named the Jammer Group. He was extremely ambitious yet ethically flexible. Andrew Rannells portrayed the character of Blair Pfaff, a crucial member of the firm and an unpredictable stockbroker. The show highlights the challenging situations protagonists face as Black Monday approaches.
Genre: Comedy, Drama
Creators: David Caspe, Jordan Cahan
Starring: Don Cheadle, Andrew Rannells
Key Takeaway: The impact of risky trades and unethical practices in volatile times.
Language: English
Budget: Not publicly disclosed
Earnings: Not applicable (TV series)
Available On: Showtime, Amazon Prime Video
15. Equity
The 2016 financial thriller Equity, directed by Meera Menon, centers on Naomi Bishop, a senior investment banker. The film covers the narrative of men’s domination in the finance industry and offers a distinctive viewpoint on the field. Anna Gunn, James Purefoy, and Alysia Renier were the film’s main actors. While working on an IPO for a tech company, Naomi encountered several challenges, including mistrust from their male coworkers and her complex relationship with a hedge fund manager. The film is notable because it depicts the realities faced by women in the finance industry.
Genre: Drama, Thriller
Director: Meera Menon
Starring: Anna Gunn, James Purefoy
Key Takeaway: The challenges and biases women face in finance.
Language: English
Budget: ₹29 crore (approx.)
Earnings: ₹13 crore (approx.)
Available On: Amazon Prime Video, Hulu
Here’s a list of some of the best stock market movies in Hindi or movies with a significant financial and stock market theme that may interest Bollywood enthusiasts:
Many films on the stock market have been made all over the world, but the majority of them are based on the financial crises that occurred in different nations. While some were based on the 2008 financial crisis, others were based on India’s 1992 stock market collapse or the 1995 Japanese market collapse. Every film imparts the wisdom that, despite possible short-term causes for market declines, investors should maintain faith in the stock market because, in the end, it will rise and surpass its prior peak.
S.NO.
Check Out These Interesting Posts You Might Enjoy!
Which is the best movie based on the stock market?
The stock market has been the subject of many films, such as Rogue Trader, Margin Call, The Wolf of Wall Street, etc.
Which Indian web series is based on the Indian Stock Market crash?
The 1992 Indian stock market crash is the subject of the web series Scam 1992, which is based on financial fraud committed by Harshad Mehta.
What was the reason for the stock market fall in the year 2008?
The collapse of US financial institutions like Lehman Brothers led to a decline in investor trust in banks, which in turn caused the 2008 stock market crisis.
Who played the role of Harshad Mehta in the Scam 1992 web series?
Pratik Gandhi played the role of Harshad Mehta in the Scam 1992 web series.
Who exposed the Scam of 1992?
The scam caused by Harshad Mehta was exposed by a journalist named Suchita Dalal.
Apollo Hospitals is touching lives with its mission of delivering compassionate and innovative healthcare, its focus on advanced medical technologies, and its commitment to shaping the future of the healthcare industry while making a meaningful impact on patients’ lives.
In this blog, we will discuss Apollo case study, its business model, and its services. Moreover, we will go over their financial information and conduct a SWOT analysis.
Apollo Hospitals – An Overview
Apollo Hospitals was founded in 1983 by Dr. Prathap C. Reddy with the vision of making quality healthcare available in India. It was a time when Indians often traveled abroad for advanced medical treatments. Apollo made these services available in India, focusing on both quality and affordability. As the nation’s first corporate hospital, Apollo Hospitals is acclaimed for establishing the private healthcare revolution in the country. Apollo Hospitals has emerged as Asia’s primary integrated healthcare services provider and has a strong presence across the healthcare ecosystem, including hospitals, pharmacies, primary healthcare & diagnostic clinics, etc. It has a strategic focus on several areas, including:
Specialized Services: Apollo has developed several specialist healthcare services in cardiology, oncology, neurology, orthopedics, and transplant services. These specialized services attract patients from India and abroad and encourage medical tourism.
Digital Healthcare Services: Apollo recognized the potential of digital healthcare services after COVID-19 and launched its online platform Apollo 24/7, which allows patients to access healthcare services online. The company increasingly focuses on integrating AI, telemedicine, and data analytics to improve patient experiences.
Franchising: Apollo has expanded into tier 2 and tier 3 cities through a mix of owned and franchised hospitals, helping to promote its brand and provide healthcare services in underserved and untapped areas.
Business Model and Services of Apollo Hospitals
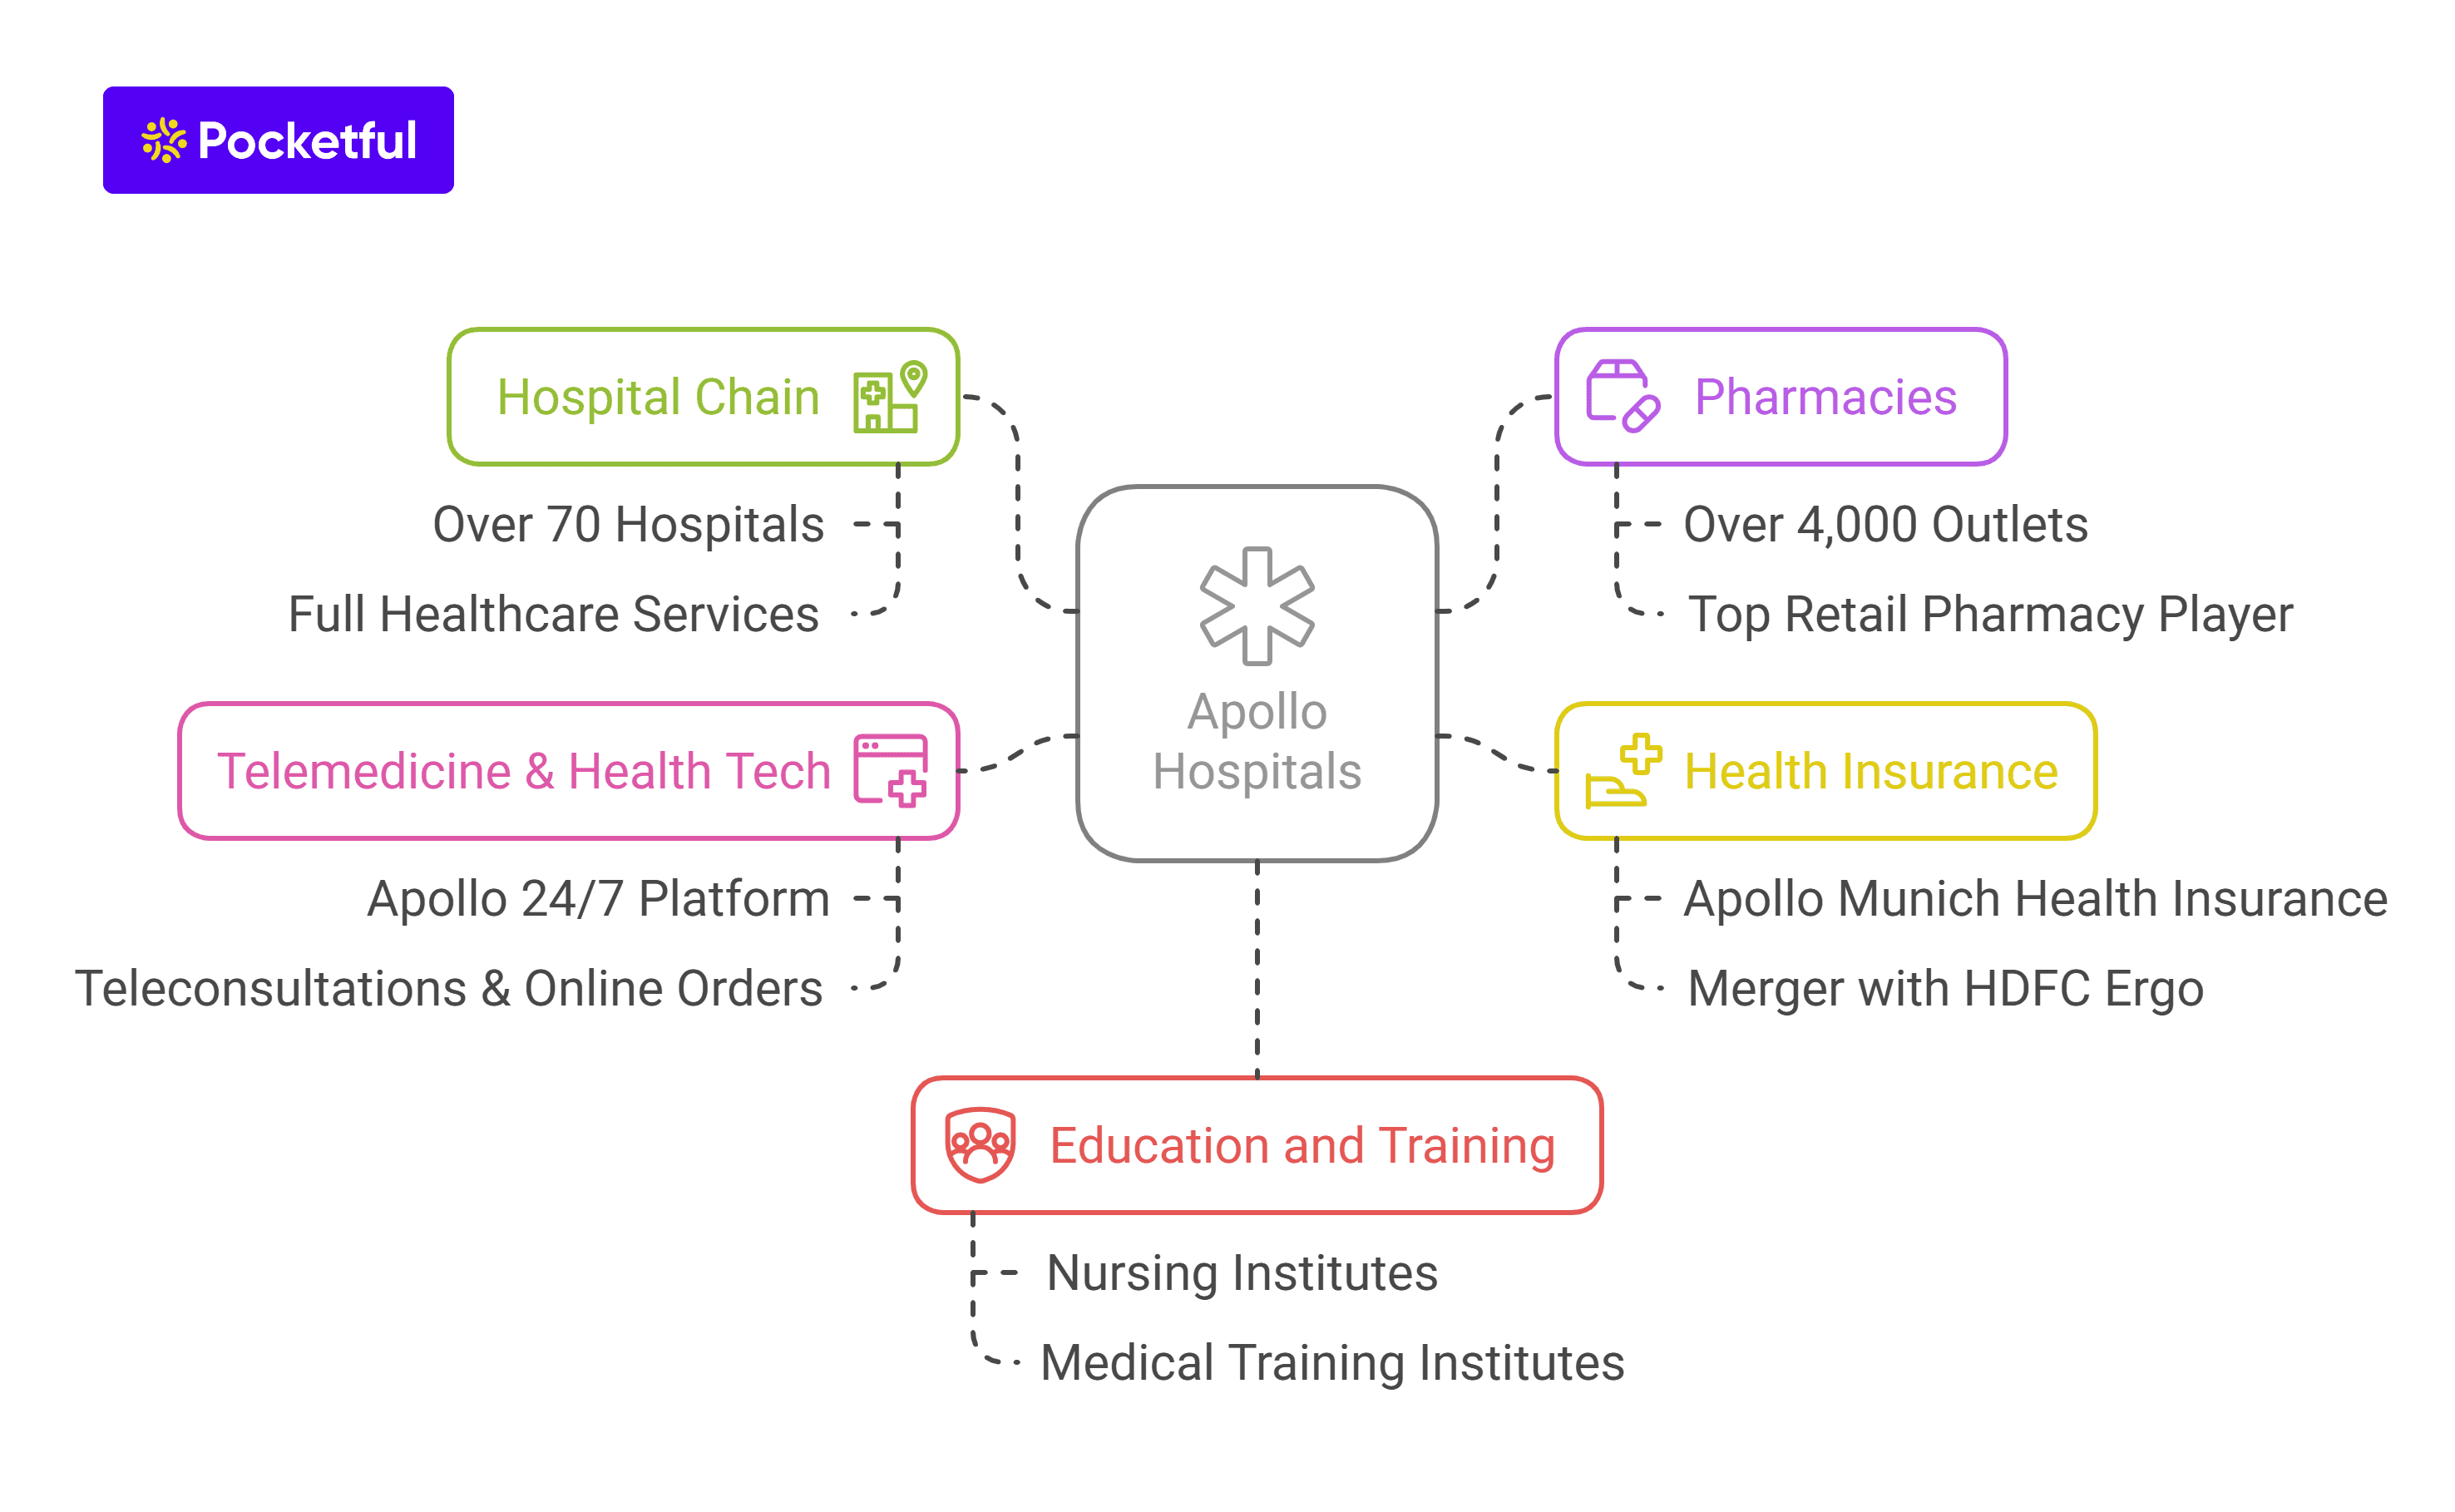
Apollo business model revolves around a multi-specialty healthcare model, offering a wide range of services across hospitals, pharmacies, diagnostics, and even telemedicine, including:
Hospital Chain: Apollo has one of the largest hospital chains in India, with over 70 hospitals across the country. These hospitals provide a full range of healthcare services, from routine health checkups to complex surgeries.
Pharmacies: Apollo’s massive pharmacy chain includes over 4,000 outlets. It is one of the top players in the retail pharmacy sector in India.
Health Insurance: Apollo entered the health insurance business with Apollo Munich Health Insurance, which later merged with HDFC Ergo General Insurance, broadening its impact on the healthcare ecosystem.
Telemedicine & Health Tech: The Apollo 24/7 platform offers teleconsultations, online pharmacy orders, and health monitoring, positioning it as an online health-tech leader.
Education and Training: Apollo has set up numerous nursing and medical training institutes to ensure a constant supply of skilled medical professionals.
Financial Statements of Apollo Hospitals
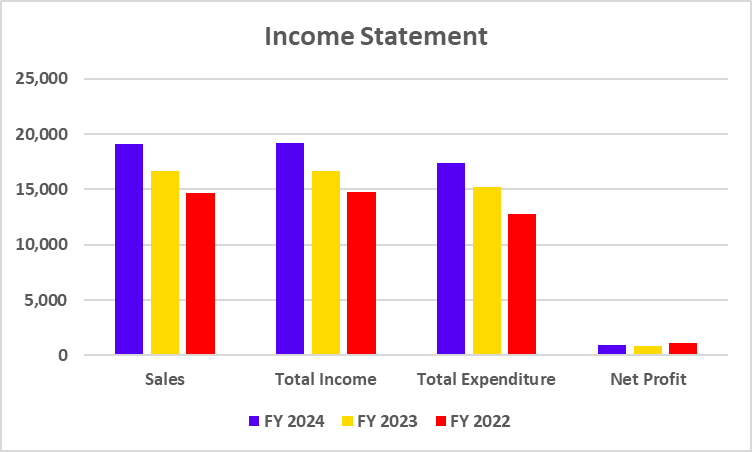
Income Statement
Particulars
FY 2024
FY 2023
FY 2022
Sales
19,059
16,612
14,662
Total Income
19,165
16,702
14,740
Total Expenditure
17,353
15,178
12,784
Net Profit
917
887
1,101
(The figures mentioned above are in INR crores unless mentioned otherwise)
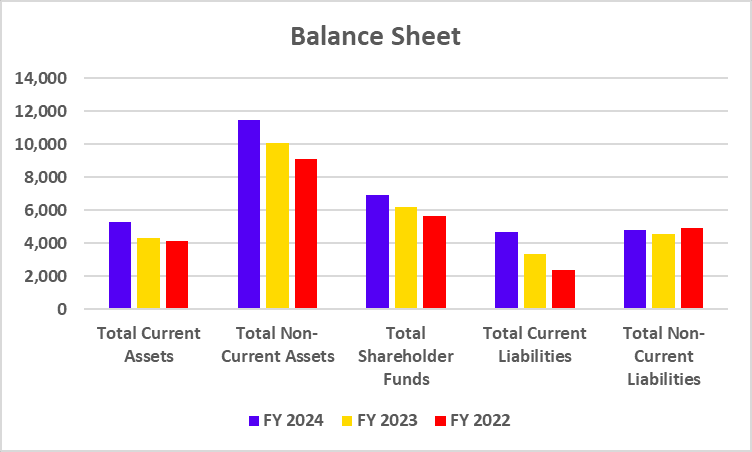
Balance Sheet
Particulars
FY 2024
FY 2023
FY 2022
Total Current Assets
5,280
4,337
4,122
Total Non-Current Assets
11,473
10,091
9,071
Total Shareholder Funds
6,935
6,197
5,623
Total Current Liabilities
4,665
3,325
2,383
Total Non-Current Liabilities
4,768
4,572
4,931
(The figures mentioned above are in INR crores unless mentioned otherwise)
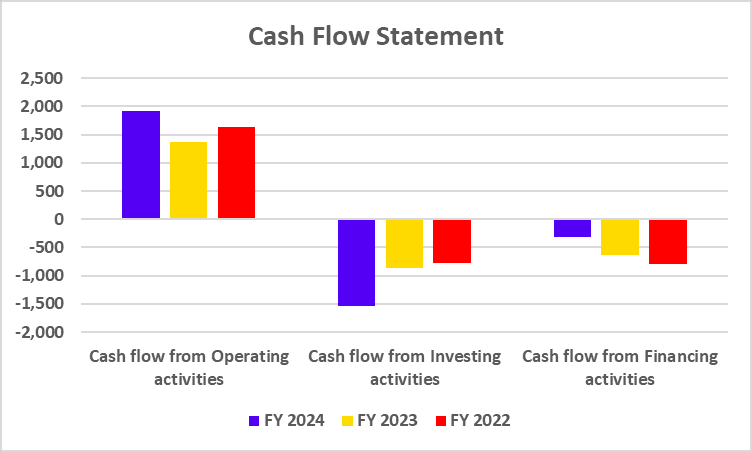
Cash Flow Statement
Particulars
FY 2024
FY 2023
FY 2022
Cash flow from Operating activities
1,920
1,376
1,628
Cash flow from Investing activities
-1,537
-870
-778
Cash flow from Financing activities
-311
-633
-792
(The figures mentioned above are in INR crores unless mentioned otherwise)
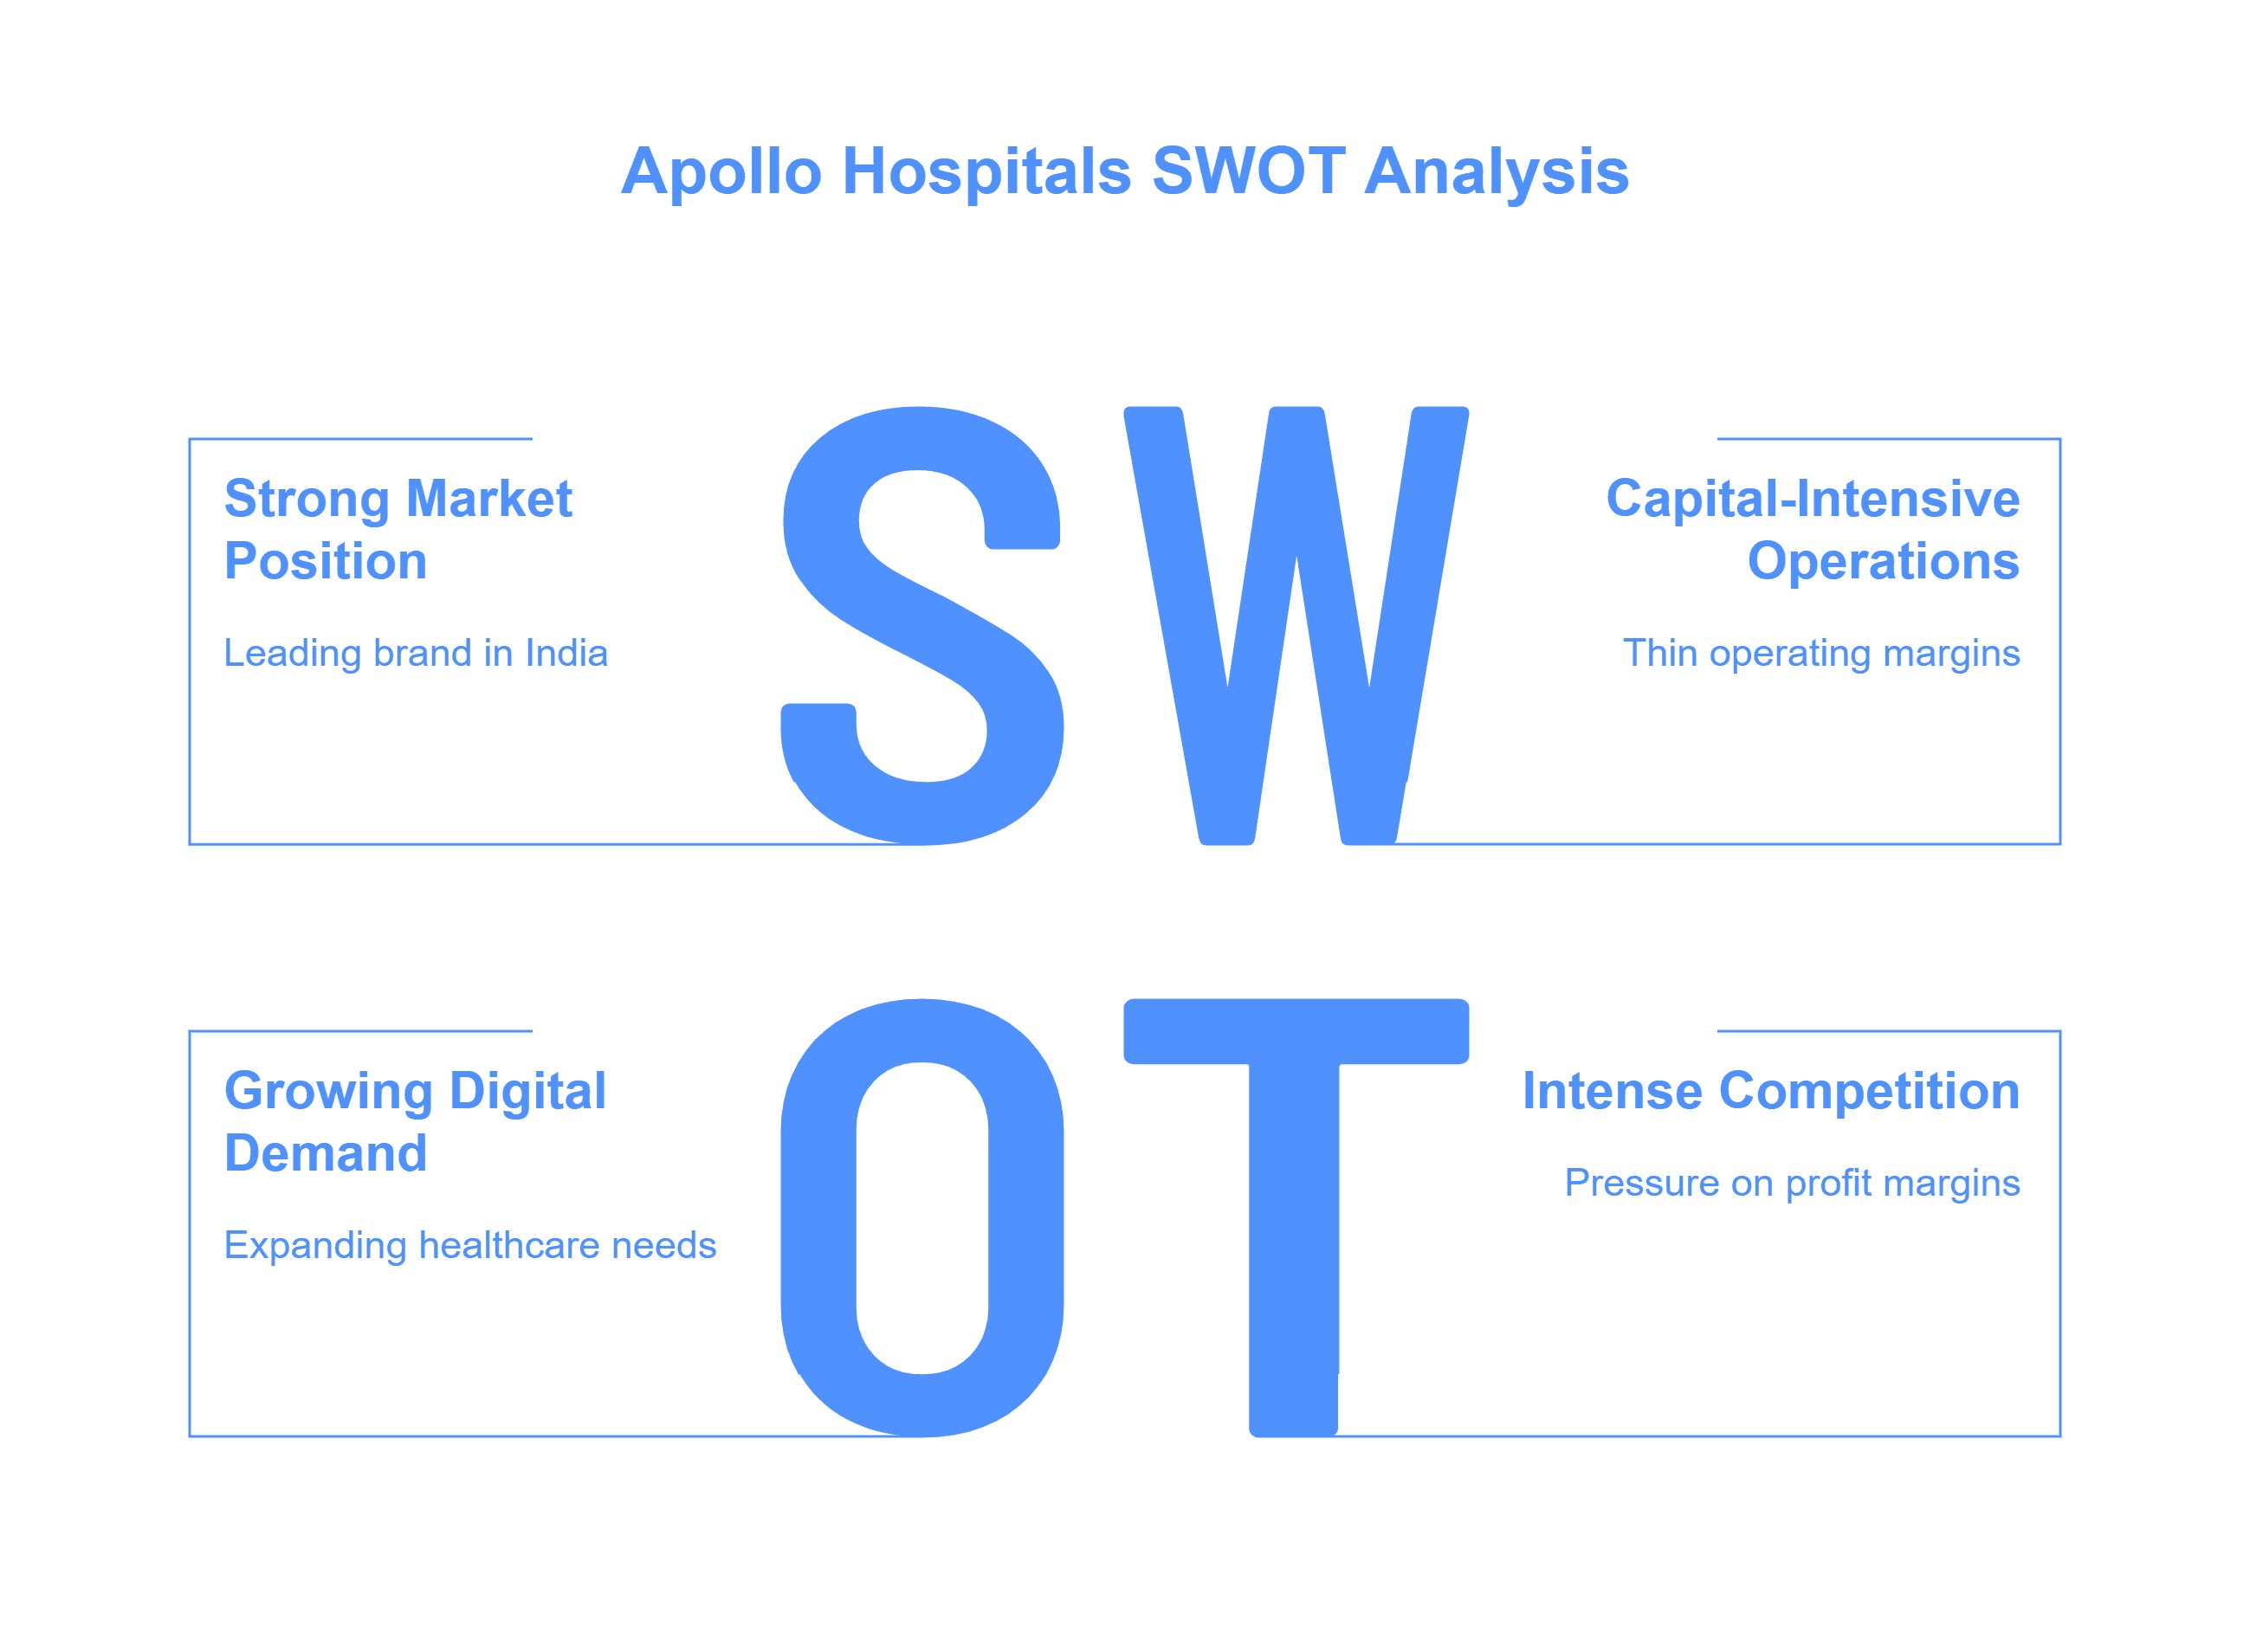
The Apollo SWOT Analysis highlights its strengths, weaknesses, opportunities, and threats, showcasing its market position and growth potential.
Strengths
Apollo Hospitals has a strong market position and brand recognition and is one of the leading hospitals in India with a significant market share.
It has a large network of 70 hospitals across the country, as well as several pharmacies and diagnostic centers.
It has medical expertise and provides healthcare services in key medical fields like cardiology, neurology, and organ transplants.
It is a key healthcare service provider and attracts patients from across the globe due to its low cost and high-quality services.
It has integrated operations across the entire business model, such as hospitals, pharmacies, health insurance, etc.
It has digital health platforms offering teleconsultations and online pharmacy services.
Weaknesses
Apollo Hospitals operates in a capital-intensive industry with significant investments in infrastructure, technology, and skilled personnel, which leads to thin operating margins.
Generally, super specialty and specialty hospitals face the staffing challenge as they continuously require a highly skilled workforce, and it’s challenging to attract, retain, and manage skilled healthcare professionals.
A big portion of revenues is generated through high-end specialized procedures. Hence, it is dependent on premium healthcare services for revenues.
Opportunities
With increasing demand for online healthcare services, Apollo’s digital ventures are expected to grow. The company invests heavily in artificial intelligence (AI) to improve diagnostics and treatment protocols.
Because of the expanding population, there is a growing demand for healthcare services.
The healthcare industry is poised to grow because of medical tourism, which attracts international patients because of its low cost and superior services.
It has formed several partnerships with international medical institutions, further enhancing its capabilities.
Apollo is exploring ways to reduce its environmental impact by adopting sustainable practices such as energy-efficient infrastructure designs and waste management projects.
Threats
The hospital industry is highly competitive as it operates on thin margins. Other hospital chains like Fortis Healthcare, Max Healthcare, and Narayana Health are competing for market share, especially in metro cities.
The healthcare industry is highly regulated; hence, it is subject to intense regulation related to pricing, medications, devices, availability of drugs, and hospital services.
The government’s push for affordable healthcare through schemes like Ayushman Bharat puts pressure on hospital chains to maintain low-profit margins.
Managing operational costs while maintaining high-quality services remains a constant challenge as the industry is capital-intensive, requiring regular investments in medical equipment, technology, infrastructure upgrades, and skilled professionals.
Healthcare is a human resource-intensive sector, and it comes with the challenge of hiring, training, and retaining medical professionals, which is an ongoing and costly process.
The economic slowdown leads to a shift towards affordable public healthcare options rather than premium healthcare.
Apollo Hospitals is a brand in itself known for its world-class healthcare services. It continuously invests in digital innovation, which gives it a competitive edge. However, it faces challenges like high operational costs and competition. However, it also has ample opportunities for expansion because of population outbursts, untapped markets in tier 2 and tier 3 cities, medical tourism, and digital healthcare services. There are stringent regulatory policies in place that should be adhered to as patients are involved, like patient safety, privacy, and data security. These challenges should be handled carefully and are crucial for Apollo’s sustained growth and success.
S.NO.
Check Out These Interesting Posts You Might Enjoy!
Apollo Hospital’s competitive advantage is its strong branding due to its wide hospital network, leadership in specialized healthcare services, integrated healthcare ecosystem, and early implementation of digital healthcare services.
How has Apollo Hospitals adapted to the COVID-19 pandemic?
During the pandemic, Apollo expanded its digital healthcare services through its telemedicine offerings. Also, it provided COVID-19 treatment and vaccination services and strengthened its healthcare infrastructure to meet the surge in demand for critical healthcare.
How can I invest in Apollo Hospitals shares?
One can invest in Apollo Hospitals shares by purchasing them through a stockbroker or an online trading platform. It is listed on both the stock exchanges, BSE and NSE, under the ticker symbol “APOLLOHOSP.”
What are Apollo Hospitals’ key growth strategies?
Apollo’s growth strategies include expanding its hospital network into rural areas along with tier 2 and tier 3 cities, scaling up its digital health services (Apollo 24/7), investing in specialized healthcare services, and attracting international patients through quality services and medical tourism.
Who established Apollo Hospitals?
Apollo Hospitals was founded in 1983 by Dr. Prathap C. Reddy.
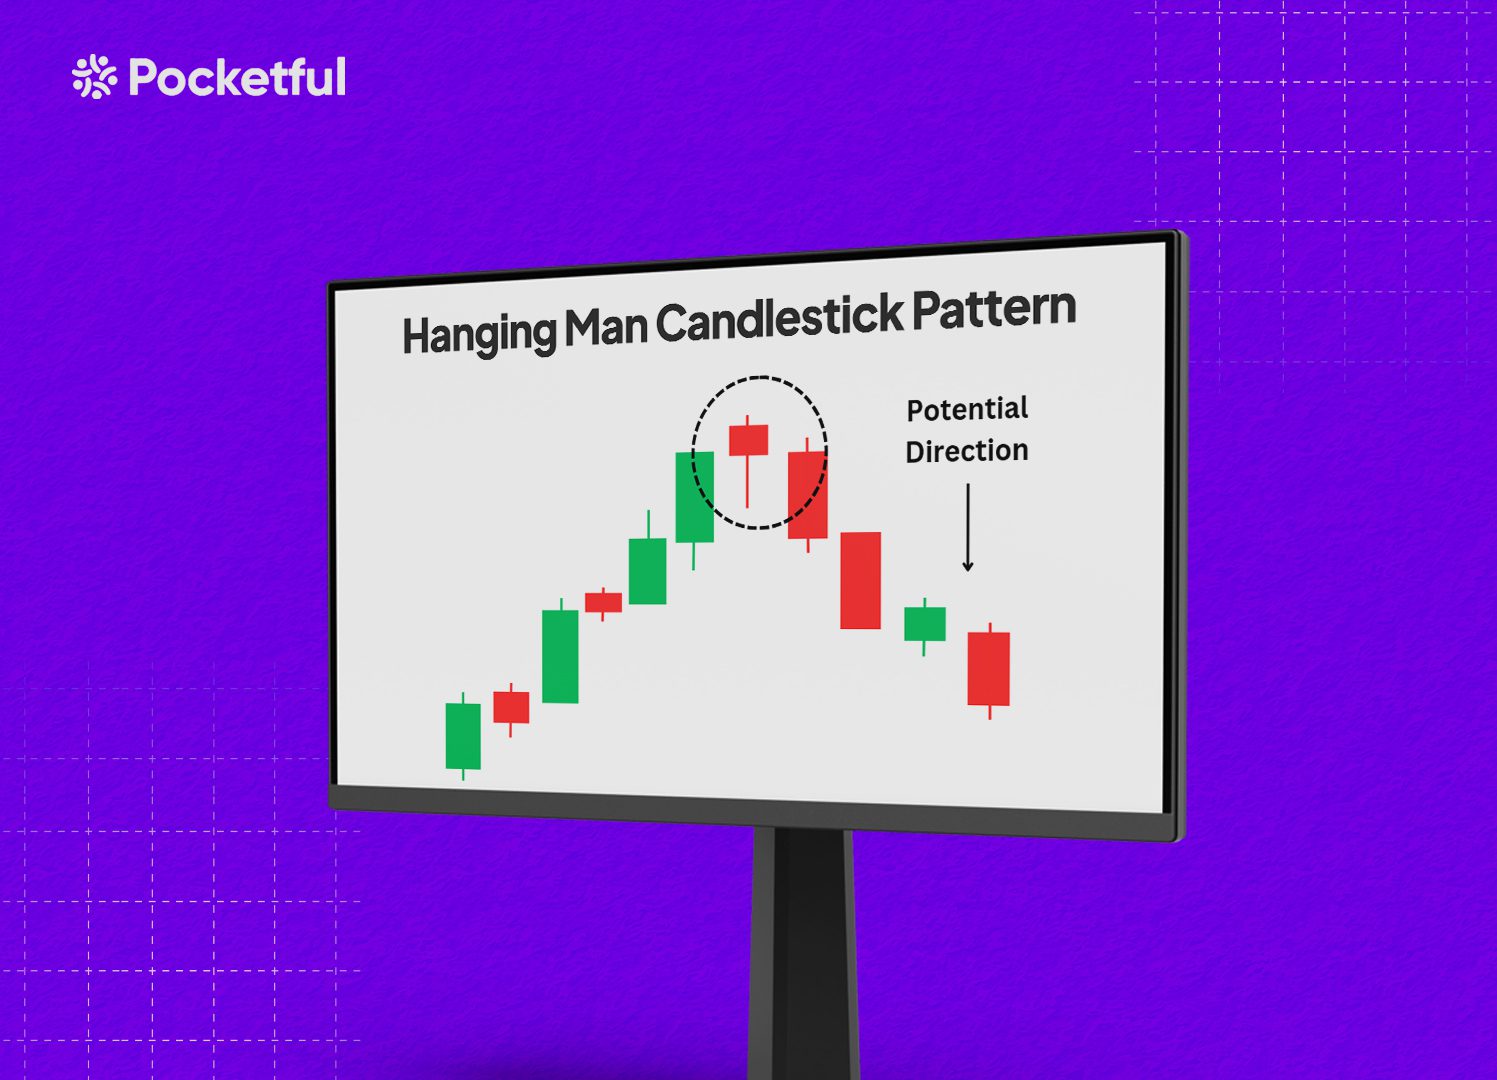
Picture yourself involved in a gripping thriller movie, and out of nowhere, a dark figure appears on the screen. This closely resembles coming across a Hanging Man candlestick pattern on a price chart. It is a sign that something might be off with the current trend in the market, suggesting the market participants to be vigilant and attentive.
In this blog, we will learn about the Hanging Man candlestick pattern, its target and stop-loss, and its advantages and limitations.
What is the Hanging Man Candlestick Pattern?
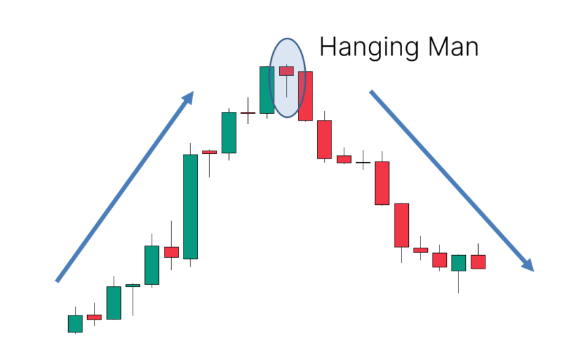
The hanging man is a single candlestick pattern that frequently suggests a shift from an uptrend to a downtrend. It is defined by a small real body, signifying that the opening and closing prices are nearby, which reflects a state of indecision. Also, the long lower shadow indicates strong selling pressure that pushed the price down during the trading session, and a minimal or absent upper shadow suggests that buying pressure remained quite weak.
The combination of these factors shows that buyers were unable to maintain control, and sellers may be gaining strength. Traders often look for confirmation through subsequent price action before making any decision.
The pattern is more meaningful when it appears after a sustained uptrend. However, waiting for confirmation from subsequent candlestick or other technical indicators is often recommended before entering a short position.
How to Determine Target and Stop-Loss?
The Hanging Man pattern indicates a possible reversal, so traders must keep their target levels close to the nearest support zone from where the price had previously bounced back. Support levels can be determined by analyzing historical price charts. Furthermore, numerous traders adhere to a risk-reward ratio, such as 1:2 or 1:3. This approach helps traders maximize their possible profits while minimizing losses.
Positioning your stop-loss just above the peak of the Hanging Man candlestick is one of the most prevalent and secure strategies to protect your investment against losses. If the price rises above the previous high, it indicates that the downtrend suggested by the pattern may not occur, and upward momentum can persist. Additionally, certain traders opt to include a slight buffer above the high, generally ranging from 1-2%, to protect themselves from minor market fluctuations or false breakouts.
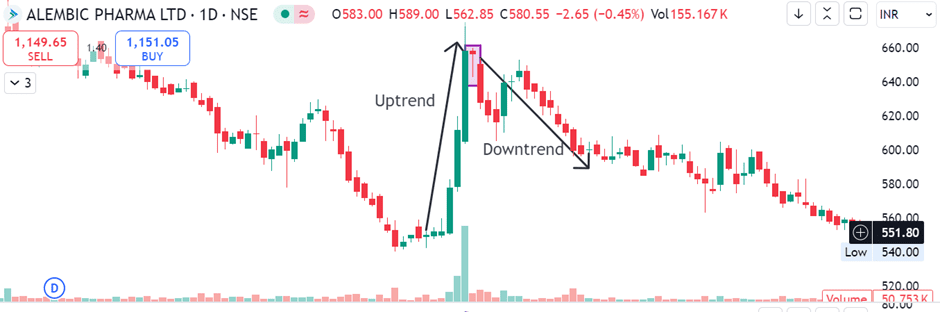
Example of the Hanging Man Candlestick of Alembic Pharma
The above chart shows the clear formation of the Hanging Man candlestick on the daily timeframe of Alembic Pharma after a continuous uptrend of almost four days. The candlestick has a small body with a long lower shadow and a little upper shadow, which is followed by a downtrend.
Advantages of Hanging Man Candlestick Pattern
The advantages of using the Hanging Star candlestick pattern are:
Early Warning of Trend Reversal – The Hanging Man pattern appears at the peak of an uptrend and acts as an early signal that bullish momentum could be losing strength. It helps traders predict the upcoming reversals before they occur, enabling them to proactively adjust their positions.
Simple to Identify – This pattern is easily recognizable on price charts due to its unique appearance, i.e., featuring a small real body accompanied by a long lower shadow and minimal to no upper shadow. Traders can easily recognize it without complex indicators or analysis.
Works well with confirmation – This pattern is more effective when confirmed by signs like a bearish candlestick or a gap down the next day. This enhances traders’ confidence in the validity of the pattern before making a trade, thereby minimizing the likelihood of false signals.
Limitations of Hanging Man Candlestick Pattern
The limitations of using the Hanging Star candlestick pattern are:
Needs Confirmation – The Hanging Man candlestick pattern, on its own, lacks sufficient strength as a trading signal. Traders seek validation from the subsequent candlestick, usually in the form of a bearish candle or a gap-down. Making decisions solely based on the Hanging Man pattern can lead to misleading signals.
Subject to Market Noise – Candlestick patterns like Hanging Man rely on short-term price fluctuations. In turbulent markets, asset prices can experience significant fluctuations, resulting in patterns that may not accurately represent the broader trend.
Does not Indicate the Strength of Reversal – The pattern does suggest a possible reversal, yet it cannot indicate the magnitude or intensity of that reversal.
The Hanging Man candlestick pattern helps traders identify possible bearish reversals. Its simplicity makes it easy for beginner investors to identify, and its reliability improves when used alongside confirmation and other technical indicators. However, the pattern may give inaccurate signals, especially during strong trends or in volatile markets, and should never be relied upon alone. Understanding the broader market context, patiently awaiting confirmation, and using supplementary technical tools can improve trading performance. Ultimately, consistent practice and patience are important for effectively incorporating it into your trading strategy.
Frequently Asked Questions (FAQs)
How does a Hanging Man differ from a Hammer candlestick pattern?
While both patterns look similar, the Hanging Man candlestick forms in an uptrend, while the Hammer candlestick appears in a downtrend.
What does the long lower shadow in a Hanging Man candlestick depict?
The long lower shadow shows sellers pushed the price lower during the session, but buyers regained control by closing. However, it signals a possible weakness in the uptrend.
Is the Hanging Man pattern reliable in the sideways market?
No, the pattern is less reliable in the sideways market as it is most effective at the top of an established uptrend.
Should I immediately sell after seeing a Hanging Man candlestick pattern?
No, it is often recommended to wait for confirmation from subsequent candlesticks or other technical indicators before entering a short position.
What is the importance of volume in the Hanging Man candlestick pattern?
Increased volume can strengthen the bearish signal, as it shows heightened selling pressure in the market.
Procter & Gamble is a global leader in the consumer goods segment, and it has been changing people’s daily routines for over 180 years. From Tide to Pampers and from Gillette to Head & Shoulders, P&G products have been a part of our everyday lives. You must be thinking about what made P&G maintain its market position after all these years.
In this blog, we will study an interesting case study of Procter & Gamble and analyze their ideas, strategies, and efforts in sustainability that drive success.
Procter & Gamble – An Overview
Procter & Gamble was established by Willian Procter and James Gamble in 1837. Quality proved to be their growth formula, and by the late 19th century, P&G had greatly expanded its list of products. In addition, it launched its first branded product, Ivory Soap, in 1879. That soap was a huge success, distinguished primarily by its purity and buoyancy. The Ivory Soap was aggressively advertised, and within a short period, it became a popular product in the USA. By the early 1900s, P&G was one of the first companies to use marketing and advertising strategies, and it sometimes advertised on the radio to promote some of its products. Over the years, P&G expanded operations and became a household name.
P&G’s operations are focused on product innovation and robust marketing strategies with a deep concern for sustainability. The company spends nearly $1.8 billion on R&D annually just to come up with those innovative ideas that can enhance its products.
P&G has an effective marketing strategy that has made its products popular all across the globe. Let’s look at their marketing strategy in detail:
Product
P&G specializes in the manufacturing and distribution of its wide range of products. These products are categorized into various segments, such as beauty, grooming, health care, fabric and home care, baby, feminine, and family care.
Every product is developed in-house by the company through extensive research and development. The company invests around $1.8 billion annually to innovate and enhance its offerings. For example, Tide, a flagship brand of P&G, is also available as Tide Pods and Tide Free & Gentle.
Another area P&G has considered very crucial is consumer insights. The company uses these insights to understand customer preferences and use advanced analytics to refine product development processes. The data-driven approach enables the company to predict market trends and develop products that suit customer preferences.
Pricing
P&G also uses psychological pricing methods, such as pricing products slightly below whole numbers, i.e., keeping the price at $4.99 rather than $5.00, to create an illusion of a lower price. The company uses the tactical pricing approach more than most – it frequently engages in price promotions, which involve price cuts and bundling of products.
Promotion
The company spends enormous amounts on digital marketing, putting nearly $8 billion annually into advertisements and promotions. In 2023, Old Spice and Always were among the mainstream brands that used digital media, such as Instagram and TikTok, for younger consumers.
The company also focuses on cause-related marketing and makes social causes central to its brand’s image. For example, the Always “Like a Girl” campaign was focused on empowering young girls, restoring their confidence, and connecting with consumers for increased brand loyalty.
Another marketing tactic used by P&G is experiential marketing, which involves the creation of an immersive brand experience at events and festivals. Since it involves interaction with the customer base, such initiatives enable the company to develop better products.
Advertising
The company focuses on storytelling and emotional connections as its advertising campaigns are based on real-life experiences of how its products transform life. For example, the “Thank You, Mom” campaign launched during the 2012 Olympics celebrated what mothers did for athletes, which generated a lot of buzz on social media.
Transparency and accountability in advertisements have resulted in improved consumer trust. P&G, over time, has highlighted various social issues around the world through its advertisements and promoted diversity and inclusion in society.
P&G continues to thrive in the competitive consumer goods landscape by focusing on innovative products, competitive pricing, effective promotion, and impactful advertising. Extensive analysis of consumer preferences and market trends and smart use of marketing techniques help P&G meet the needs of its customers and establish itself as a market leader for years to come.
S.NO.
Check Out These Interesting Posts You Might Enjoy!
Procter & Gamble was established in 1837 as a small soap and candle company by William Procter and James Gamble in Cincinnati, Ohio.
What is the pricing strategy of P&G?
P&G adopts a mix of premium, competitive, value-based, and psychological pricing strategies depending on the quality of the products offered and the customer base served. For example, P&G uses a psychological pricing strategy to create a perception of a better deal by pricing its products just below a whole number.
How does P&G innovate its products?
P&G invests heavily in research and development and uses consumer insights to create new products and improve the existing product range.
Where are the headquarters of P&G?
The headquarters of P&G is located in Cincinnati, Ohio.
What are the core product categories of P&G?
The main product categories of P&G include beauty, grooming, healthcare, fabric, home care, etc.
Open Free Demat Account
Join Pocketful Now
You have successfully subscribed to the newsletter
There was an error while trying to send your request. Please try again.