Imagine you want to spend the long weekend shopping and lounging around the house and don’t want to go outside. In this situation, what will you do? Do you know there is a corporation that offers you everything you need, including web series and movies through their app, all in the comfort of your own home?
In this blog, we will discuss the beginnings of Amazon and its pricing and marketing strategies.
Overview of Amazon
Jeff Bezos incorporated the company in 1994 to establish an online bookstore and deliver books to customers. The company launched as an online bookseller in 1995, and within two months, the business had operations in more than 45 countries. The company obtained $54 million through an initial public offering (IPO) and became listed on the US Stock Exchange to fund its continued growth. However, Bezos’s goal went well beyond simply making money from selling books, as he also wanted to take advantage of the internet’s expanding potential. He eventually added music, movies, and other content.

The business launched Amazon Web Services in 2002, and over time, it grew to become one of the most significant cloud infrastructures globally. Amazon Prime was then introduced by the company in 2005 to its customers to provide free two-day shipping and discounted one-day shipping for an annual membership of $79 a year. Amazon Prime Video was launched to compete with other online streaming companies like Netflix and Disney. In 2018, it became the 2nd ever company in the world to reach a market capitalization of $1 trillion. Its headquarters is located in Seattle, Washington, United States.
Marketing Strategies of Amazon
Amazon’s marketing strategies are mentioned below –
- Technology– The business uses technology that allows it to detect the demands of customers based on their search history using various algorithms.
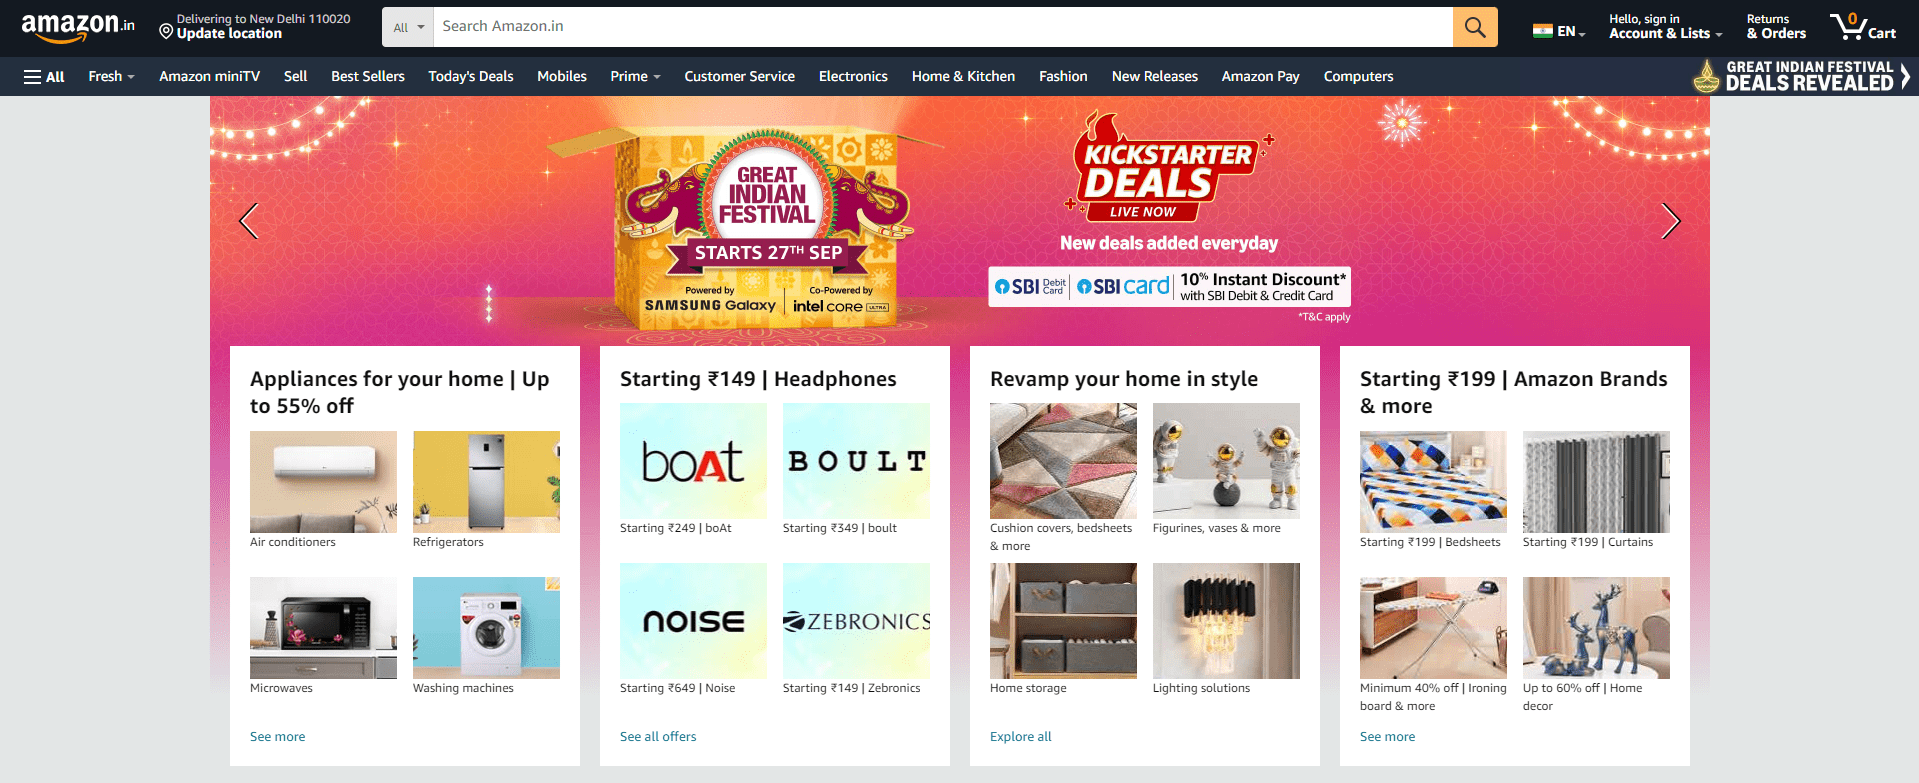
- User-Friendly Experience– Customers can easily add things to their carts and check out using the company’s user-friendly mobile application and website.
- Pricing – Amazon strives to match prices with all other platforms and offers its customers the best available discounts.
- Membership Program – The business also offers its clients a membership program through which they can participate and receive exclusive rewards.
- Brand Image – The business enjoys a solid reputation as a brand worldwide, which results in a stable customer base.
- Acquisitions – Amazon has expanded itself by acquiring various companies globally, which has expanded its product offering and market share.
- Customer Preference – To give its consumers better service, the company considers the preferences of the local population and delivers these products in a short time.
Pricing Strategies of Amazon
The business delivers products at competitive prices to its customers and has a distinctive pricing approach. Through its e-commerce channels, the company offers products at prices that are lower than those of traditional offline stores. In addition to this, the business uses a dynamic pricing strategy, which aims to change the prices of the products based on competitor prices, demand and supply and market trends. The algorithm attempts to optimize the pricing as best it can by forecasting the supply of products and consumer demand. The company sends personalized offers to its prime members and regular consumers based on their order values and interests. Amazon Web Services also uses a regional pricing strategy, offering services at different costs based on the geographical region to attract new clients.
Product Portfolio of Amazon
There are numerous products offered by Amazon, a few of which are mentioned below-
- Electronics – The company sells various electronics products, such as cameras, household appliances, smartphones, etc.
- Clothing – The company sells clothes from domestic and foreign brands for men, women, and children, as well as accessories such as watches, jewelry, shoes, and sunglasses.
- Books – The organization provides books in hard copy, paperback, and digital formats to customers worldwide.
- Groceries – Amazon Fresh is a grocery delivery and physical store service that sells groceries to its customers.
- Health Products – It also offers skin care products, health products, medical supplements etc.
- Automotive – The company sells accessories for two-wheelers and four-wheelers.
Read Also: Flipkart Case Study- Business Model and Marketing Strategy
Conclusion
In conclusion, Amazon has come a long way from its humble beginnings as an online bookstore to become one of the top worldwide e-commerce businesses. The brand is a household name because of its wide range of products. Amazon has also been embracing the rapidly evolving technological landscape to support its future expansion.
| S.NO. | Check Out These Interesting Posts You Might Enjoy! |
|---|---|
| 1 | Netflix Case Study |
| 2 | Meesho Case Study |
| 3 | GSK Pharma Case Study |
| 4 | Burger King Case Study |
| 5 | Zara Case Study |
| 6 | Kalyan Jewellers Case Study |
Frequently Asked Questions (FAQs)
Which services are provided by Amazon Web Services (AWS)?
Amazon Web Services provides computing, machine learning, networking, storage, and other services.
Where is the headquarters of Amazon?
Amazon’s headquarters is in Seattle, USA.
Who is the founder of Amazon?
Amazon was founded by Jeff Bezos in 1994.
Who is the current CEO of Amazon?
Andy Jassy is the current CEO of Amazon as of 20 September 2024.
Which pricing strategy is used by Amazon?
Amazon uses a dynamic pricing strategy to continuously change the prices of its products according to market trends and prices offered by its competitors.