If you are searching for a company in the banking sector that provides excellent banking services to its customers, then you may consider Axis Bank for investment.
In this blog, we will provide key insights into Axis Bank case study, Its business model and services and conduct a SWOT analysis to make an informed investment decision.
Axis Bank Overview
Axis Bank was incorporated in 1993 and was formerly known as UTI Bank. The company’s headquarters is in Mumbai, and the bank is among the three largest private sector banks in India, with domestic and international operations. The bank serves large corporations, retail businesses, agriculture, and MSMEs. It embraced technological advancements and introduced ‘Open,’ a mobile banking application offering over 100 features via an easy-to-use interface. In FY24, the company added 475 new branches and has a network of 5,377 domestic branches. The company has grown its total assets with the last 5-year CAGR of 13% and advances and deposits by 15%. Axis Bank was the first bank to introduce US Dollar fixed deposits to NRI customers.
Business Model & Services Provided By Axis
Now, let’s understand how the bank’s business model is structured and how it makes money. The bank follows RBI, SEBI, and IRDAI regulations of India. It provides its core banking solutions, digital platforms, and other services. Axis Bank specializes in providing the following services:
- Retail Banking: The bank offers services such as savings accounts, FDs, loans, credit cards, ATM services, NRI, and other financial services.
- Corporate Banking: The products and services provided to corporate clients are current accounts, working capital financing, term loans, cross-border trade, tax collection on behalf of the Government, Investment Banking Services, etc.
- International Banking: The bank provides corporate banking, trade finance, treasury, and risk management services through various foreign branches.
The company generates revenue from multiple sources, such as interest income from lending activities, fee-based income from credit cards, and foreign exchange income from foreign transactions. It continuously evolves and adapts its business model and marketing strategies to meet customers’ needs.
Market Details of Axis Bank
| Current Market Price | INR 1,186 |
| Market Capitalization (In INR Crores) | 3,66,845 |
| 52 Week High | INR 1,340 |
| 52 Week Low | INR 951 |
| P/E Ratio (x) | 13.7 |
Read Also: HDFC Bank Case Study: Business Model, Financial Highlights, and SWOT Analysis
Financial Statements of Axis Bank
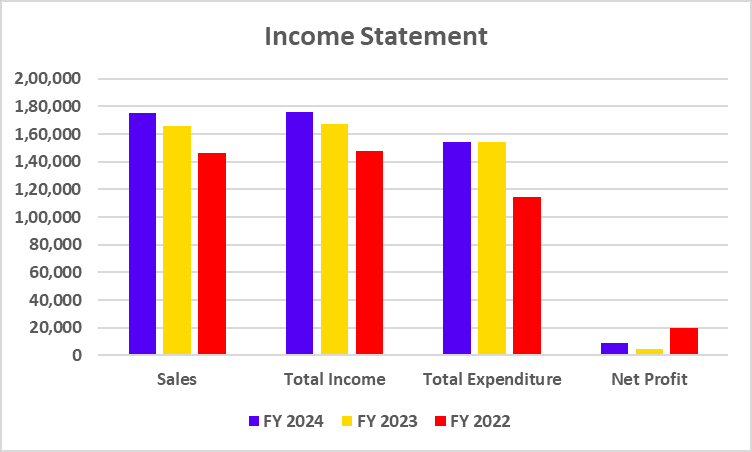
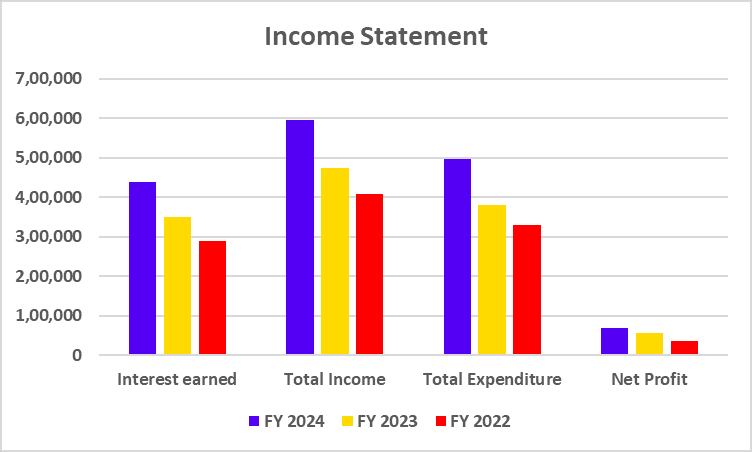
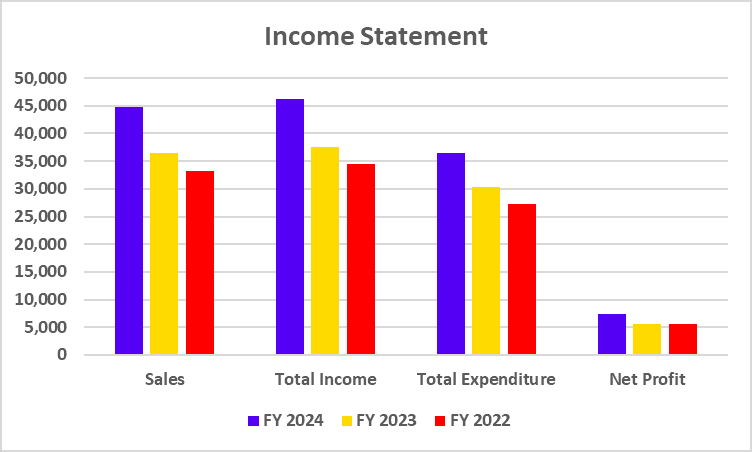
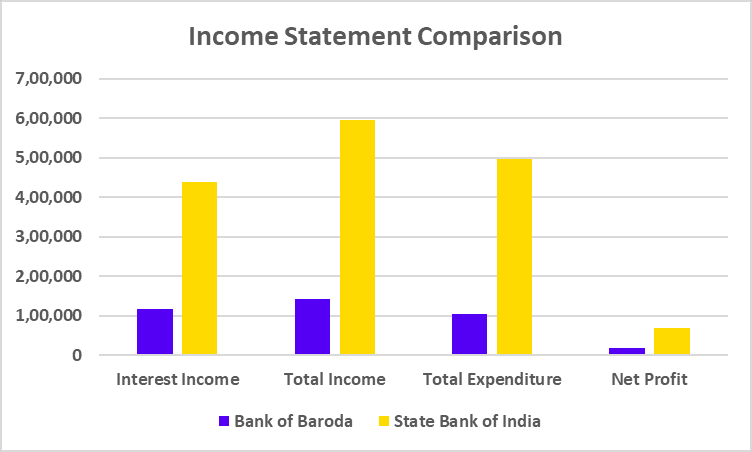
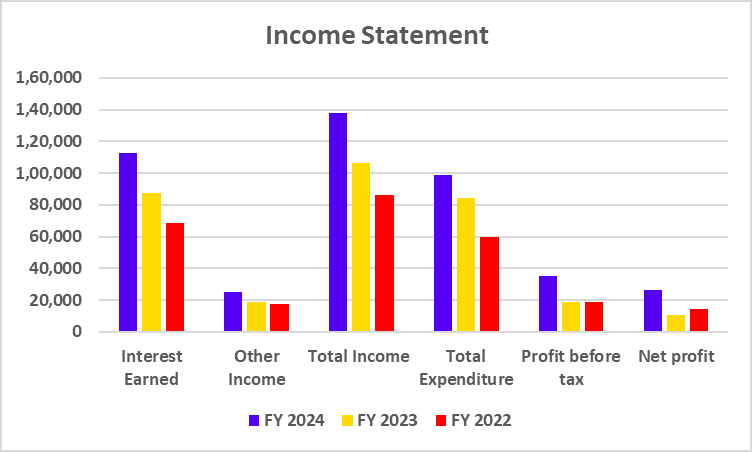
Income Statement
| Particulars | FY 2024 | FY 2023 | FY 2022 |
|---|---|---|---|
| Interest Earned | 1,12,759 | 87,448 | 68,846 |
| Other Income | 25,230 | 18,706 | 17,268 |
| Total Income | 1,37,989 | 1,06,154 | 86,114 |
| Total Expenditure | 98,629 | 84,613 | 59,743 |
| Profit before tax | 35,181 | 18,623 | 18,932 |
| Net profit | 26,427 | 10,855 | 14,168 |
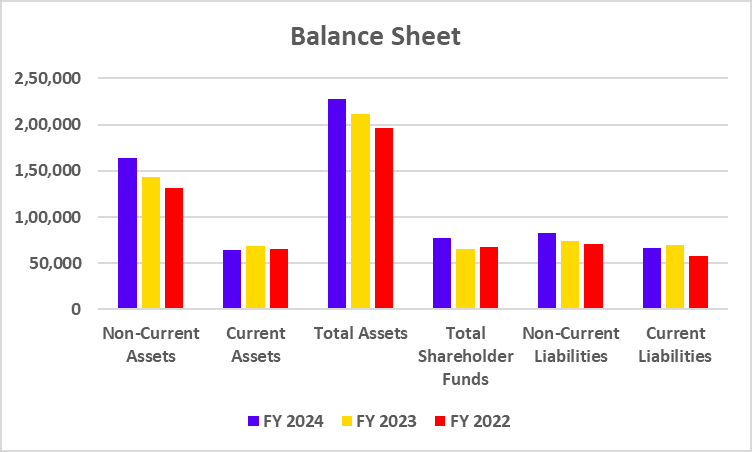
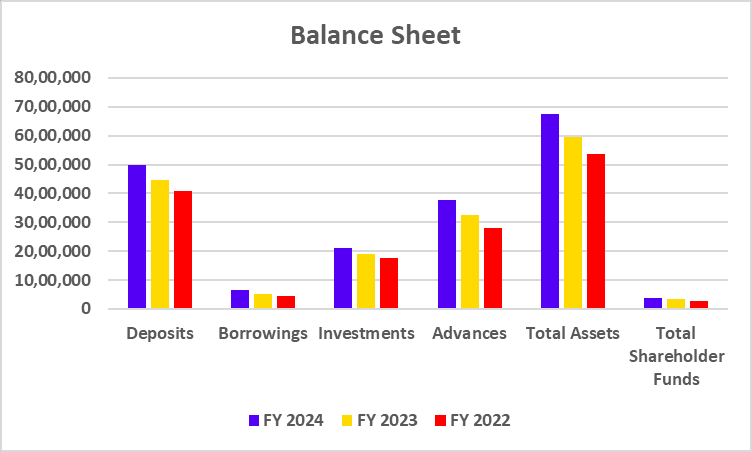
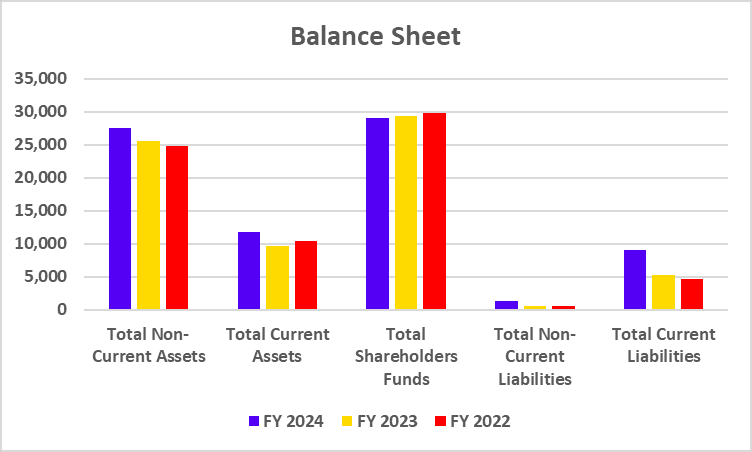
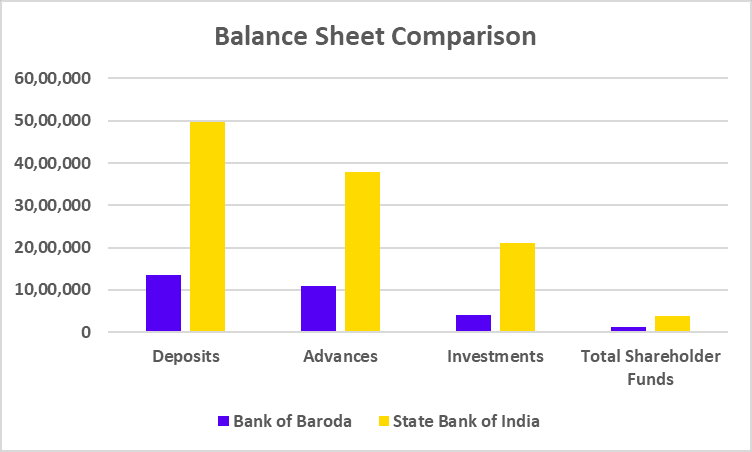
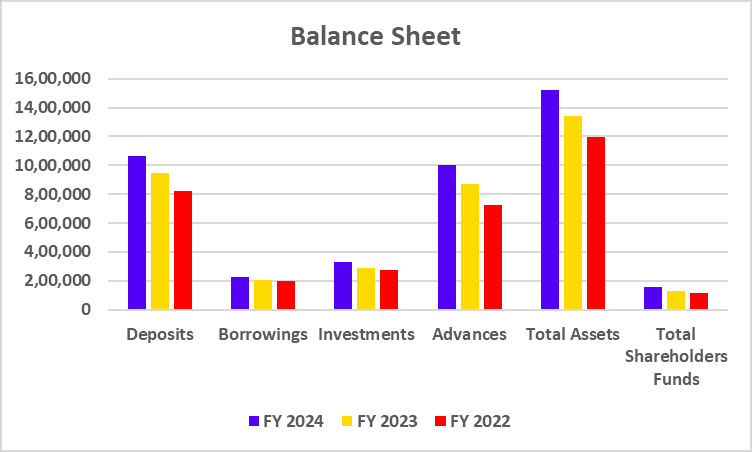
Balance Sheet
| Particulars | FY 2024 | FY 2023 | FY 2022 |
|---|---|---|---|
| Deposits | 10,67,102 | 9,45,824 | 8,20,914 |
| Borrowings | 2,28,199 | 2,06,213 | 1,99,778 |
| Investments | 3,32,353 | 2,88,094 | 2,74,608 |
| Advances | 9,99,333 | 8,68,387 | 7,25,125 |
| Total Assets | 15,18,238 | 13,44,417 | 11,95,528 |
| Total Shareholders Funds | 1,55,511 | 1,28,740 | 1,17,495 |
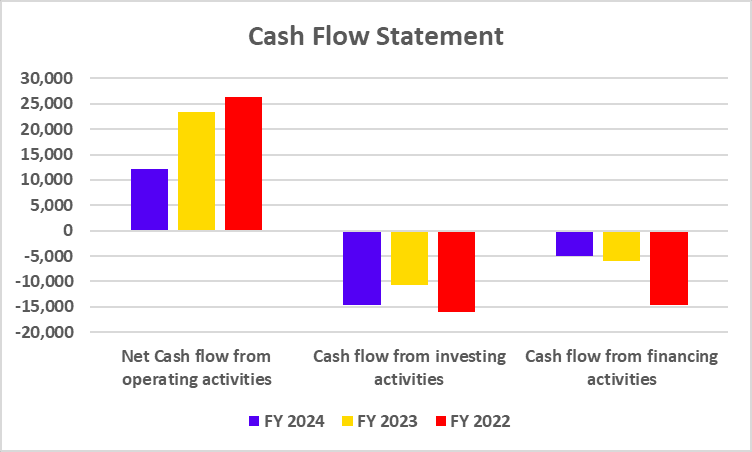
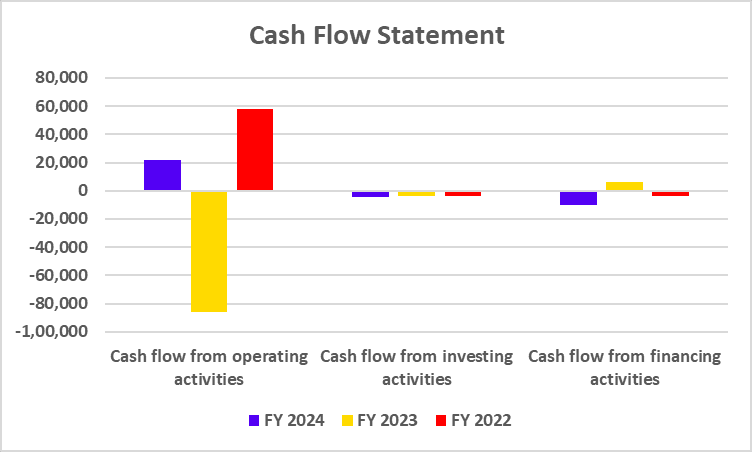
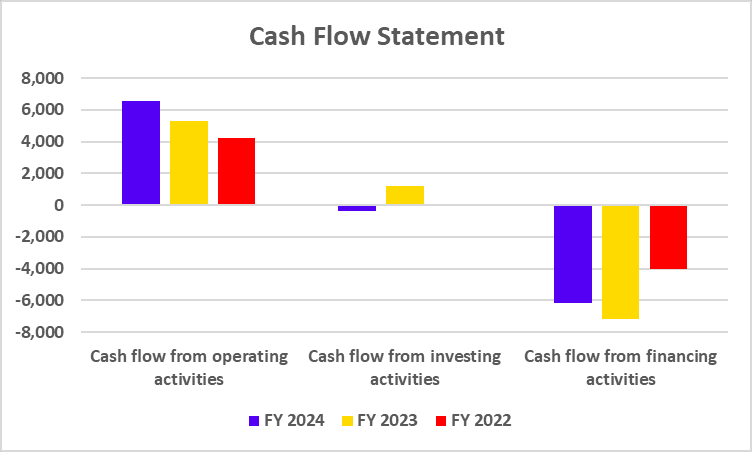
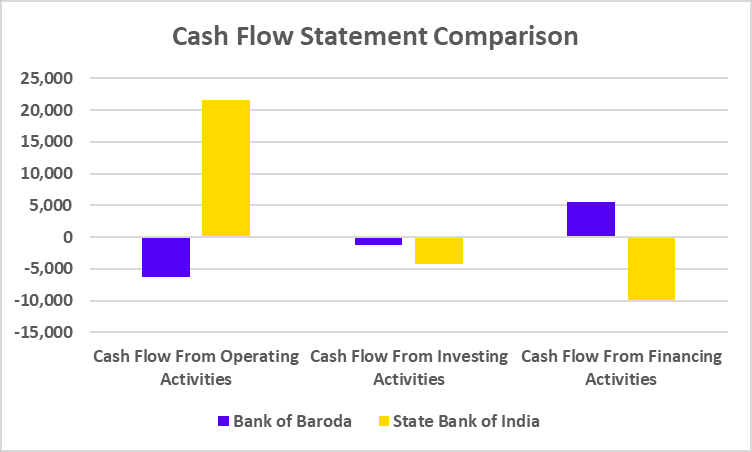
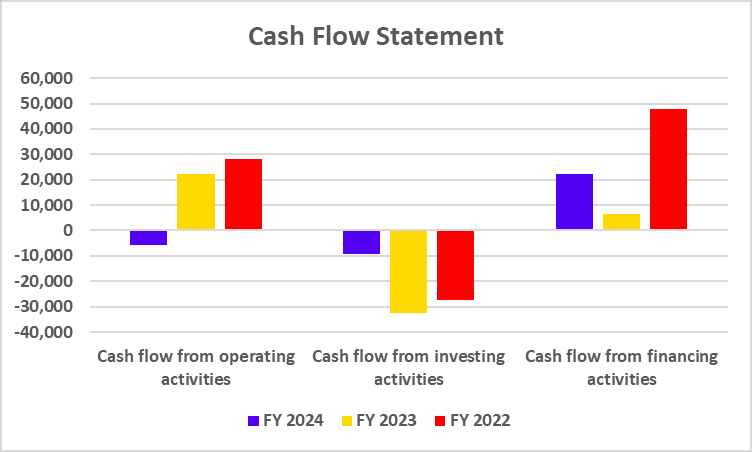
Cash Flow Statement
| Particulars | FY 2024 | FY 2023 | FY 2022 |
|---|---|---|---|
| Cash flow from operating activities | -5,554 | 22,074 | 28,137 |
| Cash flow from investing activities | -9,088 | -32,694 | -27,232 |
| Cash flow from financing activities | 22,341 | 6,640 | 47,894 |
Key Performance Indicators (KPIs)
| Particulars | FY 2024 | FY 2023 | FY 2022 |
|---|---|---|---|
| Net Interest Margin (%) | 3.38 | 3.27 | 2.83 |
| Return on Equity (%) | 16.80 | 8.33 | 11.93 |
| Return on Capital Employed (%) | 2.70 | 1.67 | 2.31 |
| CASA(%) | 42.96 | 47.12 | 44.96 |
| Capital Adequacy Ratio (%) | 16.63 | 17.64 | 18.54 |
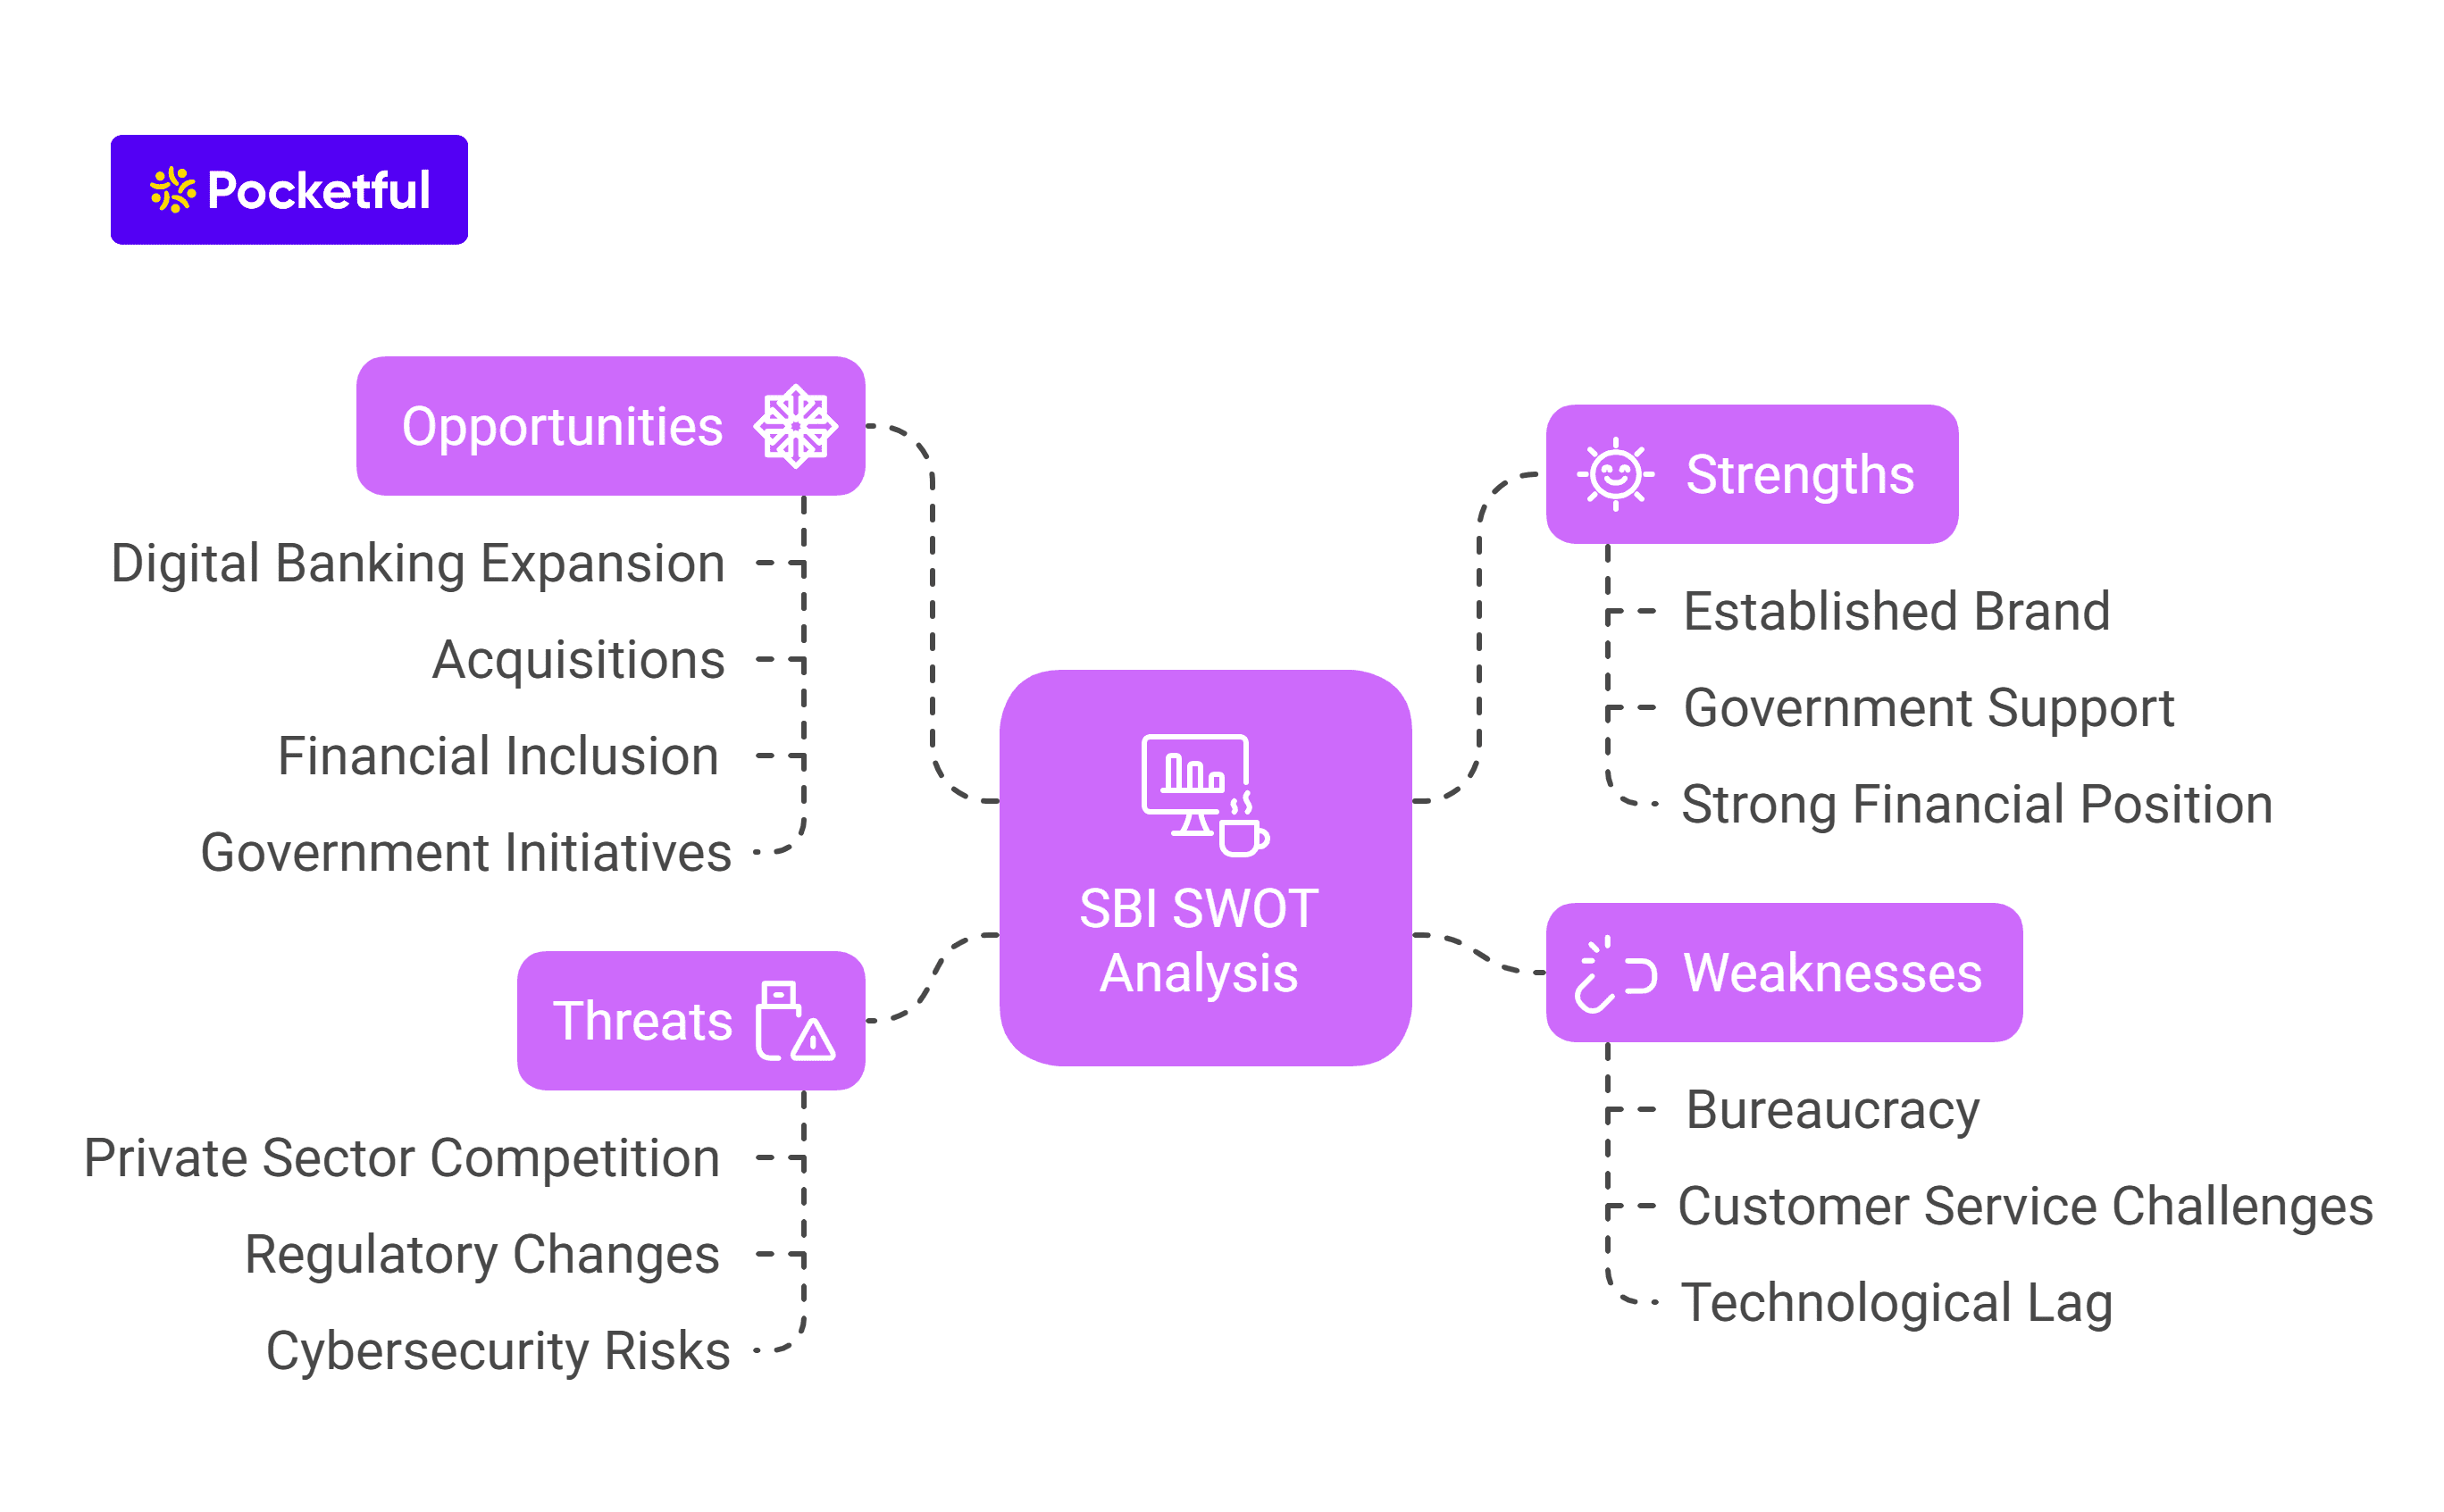
SWOT Analysis of Axis Bank
The Axis Bank SWOT Analysis highlights its strengths, weaknesses, opportunities, and threats, showcasing its market position and growth potential.
Strength
- The bank has established a strong brand and is seen as a dependable bank by the general public.
- The company offers a diverse portfolio of products catering to a huge customer base.
- The company emphasizes using the latest technologies to improve customer experience.
- Axis Bank has an extensive branch network.
Weaknesses
- The company is struggling to maintain consistency in earning net profit, which is resulting in financial volatility.
- Axis Bank is facing challenges in managing its NPAs, which negatively impacts its net profits.
Opportunities
- Under the premium segment of the bank, Axis Bank provides premium services to its customers, developing brand loyalty and trust.
- Axis Bank’s 19.02% stake in Max Life Insurance adds variety to the company’s diverse portfolio of products and services.
- The investment in innovative technologies by the bank boosts operational efficiency and enhances customer experience.
Threats
- Axis Bank is facing intense competition from other private and public banks, which is putting pressure on its profitability and market share.
- The banking sector faces strict and frequently changing regulations, which results in extra costs for the bank.
- The banking sector is highly affected by economic downturns and interest rate fluctuations in the global market.
Read Also: Yes Bank Case Study: Business Model, Financial Statement, SWOT Analysis
Conclusion
Axis Bank is among the biggest private sector banks in India and has emerged as a vital player in the banking industry owing to its diversified product portfolio and strong brand image. While the bank keeps growing with the transforming financial ecosystem, it is confronted by certain challenges, such as managing NPAs and consistency in profitability. Strategic decisions by the bank to provide premium services place it in a better position to gain from emerging opportunities. However, Axis Bank operates under intense competition and a challenging regulatory environment. Therefore, it is advised to consult a financial advisor before investing.
Frequently Asked Questions (FAQs)
What are the challenges faced by Axis Bank?
Axis Bank is facing challenges such as volatility of net profit, NPAs, and growing competition in the banking business.
What are the opportunities that Axis Bank has?
Axis Bank can start providing new services, incorporate Max Life Insurance products into its diverse mix of products, and adopt new technologies to improve its operations.
Who is the CEO of Axis Bank?
Amitabh Chaudhry is the CEO of Axis Bank as of 11 September 2024.
Is Axis Bank profitable?
Axis Bank has been consistently profitable for the past three years and has reported a net profit of INR 26,427 crores in FY 2024.