Category: Case Study

  • HCL Vs Infosys: Which is Better?

    HCL Vs Infosys: Which is Better?

    India’s IT industry has made a strong presence globally, with HCL Technologies and Infosys being the two major players. Infosys today offers its services in 56 countries and its brand value is expected to exceed $16 billion in 2025, making it among the top 3 IT service brands in the world. HCLTech, on the other hand, is active in 60 countries and has more than 200 delivery centers. 

    In this blog, we will compare various aspects of “HCL vs Infosys” to help investors, analysts, and students understand the position of these companies.

    Company Overview: HCL Technologies

    HCL Technologies, popularly known as HCLTech, is one of the top IT companies in India. It was started in 1976 by Shiv Nadar and his team. Earlier this company was hardware focused, but in the 90s it entered the software and IT services sector. Today HCLTech is working in more than 60 countries of the world and has 200+ delivery centers and 150 innovation labs. Its clients come from sectors like banking, healthcare, auto, telecom and retail. The chairperson of the company is Roshni Nadar Malhotra and the CEO is C. Vijayakumar, who is leading the global growth of HCL.

    Business model

    HCL Tech’s business model is quite diverse and this company provides a variety of services in different sectors. It has three main business verticals:

    • IT and Business Services (ITBS): This includes application development, cloud, digital processing and infrastructure services.
    • Engineering and R&D Services (ERS): Technology solutions ranging from product design to manufacturing.
    • HCL Software: Operates solutions acquired from IBM such as AppScan, BigFix and Notes/Domino.

    In terms of revenue, the company earns from fixed-price and time-based contracts, as well as sells its products on a subscription model. HCL’s focus is on value-driven and client-need-based service delivery, making it trusted by customers around the world.

    Read Also: HCL Technologies Case Study: Financials, KPIs, And SWOT Analysis

    Company Overview: Infosys

    Infosys was started in 1981 by Narayan Murthy and his team with a capital of just ₹ 10,000, and today it is counted among the most trusted IT companies in India. The company is operating in more than 56 countries and its brand value has crossed $ 16 billion in 2025. Infosys is recognized globally for its digital transformation, AI and cloud solutions.

    Its clients include Fortune 500 companies, and it provides technology services in sectors such as BFSI, healthcare, manufacturing, and retail. The CEO and MD of Infosys is Salil Parekh, under whose leadership the company is constantly moving towards innovation and growth.

    Business Model 

    The business model of Infosys is client-centric and technology-driven. The company earns revenue from four main areas:

    • Digital Services: Which includes cloud, data analytics, and AI based solutions.
    • Consulting and Outsourcing: Provides services to clients from end-to-end business strategy to IT implementation.
    • Enterprise Applications: Solutions on platforms like SAP, Oracle.
    • Managed Services: Long-term support of infrastructure and applications.

    Infosys’ model is scalable and globally competitive, in which the ‘Global Delivery Model’ plays a major role. This model helps the company to provide high-quality services at low cost.

    Read Also: Infosys Case Study: Business Model and SWOT Analysis

    Who is Better: HCL Technologies Or  Infosys?

    In 2025, both HCLTech and Infosys have shown significant progress in their respective fields.

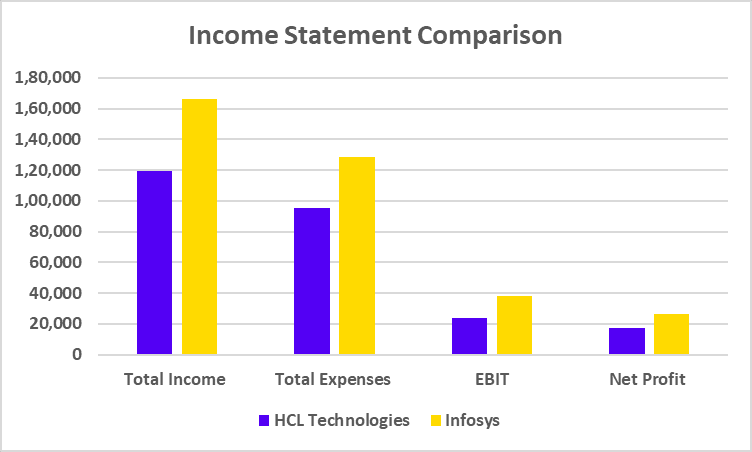
    • Financial performance : Talking about financial performance, Infosys’ total revenue was around ₹ 1.66 lakh crore, which is far ahead of HCLTech’s around ₹ 1.19 lakh crore. Also, Infosys’ net profit and operating margin are also better than HCLTech, which reflects the company’s operational efficiency and profitability.
    • Strategic focus : In terms of strategic focus, HCLTech has secured large contracts in cloud migration and AI services, giving it a strong market presence among large enterprise clients. At the same time, Infosys has emphasized on AI-based new products and language model development, thereby playing a leading role in digital transformation.
    • Global Presence : The global presence of both the companies is almost the same, both are operating in about 60 countries. But Infosys has been slightly better in adding new clients, which has diversified its revenue streams and customer base.
    • Future plans : Both companies have prioritized balanced growth in their future plans. HCLTech is planning further expansion in the cloud and AI sector, while Infosys is focusing on improving operating margins and responsible use of AI.

    Overall, both companies are strong in their respective domains of expertise and are making significant contributions to the IT industry. Saying who is better depends entirely on the investor’s risk profile and analysis of the company’s fundamentals. It is essential for investors to conduct a thorough analysis of both the companies along with management’s track record in delivering results before investing.

    Comparative Analysis: HCL Technologies Vs Infosys

    ParticularsHCL TechnologiesInfosys
    Current Price (₹)1,7401,623
    Market Cap (₹ Crores)4,72,1516,74,187
    52-W High (₹)2,0122,007
    52-W Low (₹)1,3031,307
    FII Holdings as of March 202519.14%29.4%
    DII Holdings (as of March 2025)15.48%34.46%
    Book Value (₹)257231
    PE Ratio27.125.4
    (Data as of 21 June 2025)

    Financial Statements Analysis 

    Income Statement Comparison 

    ParticularsHCL TechnologiesInfosys
    Total Income1,19,5401,66,590
    Total Expenses95,6351,28,566
    EBIT23,90538,024
    Net Profit17,39926,750
    (All values are in INR crores and the data is as of March 2025)

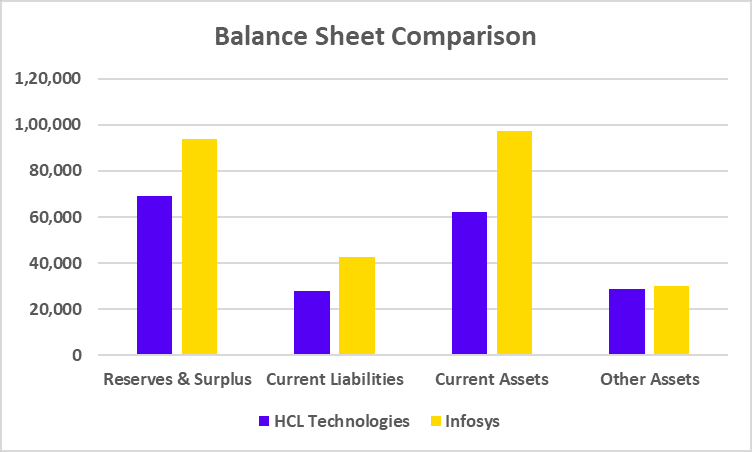
    Balance Sheet Comparison 

    ParticularsHCL TechnologiesInfosys
    Reserves & Surplus69,11293,745
    Current Liabilities28,03942,850
    Current Assets62,10997,099
    Other Assets28,96030,135
    (All values are in INR crores and the data is as of March 2025)

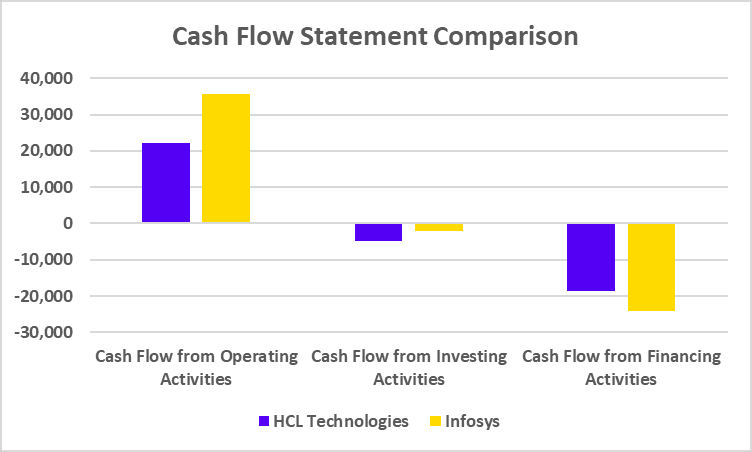
    Cash Flow Statement Comparison 

    ParticularsHCL TechnologiesInfosys
    Cash Flow from Operating Activities22,26135,694
    Cash Flow from Investing Activities-4,914-1,946
    Cash Flow from Financing Activities-18,561-24,161
    (All values are in INR crores and the data is as of March 2025)

    Key Performance Ratios (KPIs) 

    ParticularsHCL TechnologiesInfosys
    Operating Profit Margin (%)20.4223.32
    Net Profit Margin (%)14.8616.41
    ROE (%)24.9627.87
    ROCE (%)30.8435.85
    Debt to Equity (x)0.030.00
    (Data as of March 2025)

    Read Also: Infosys vs TCS: A Comparative Analysis of IT Giants

    Future plans of HCL Technologies

    The future plans of HCL Technologies are mentioned below;

    • Investing and scaling in Generative AI : HCLTech has further strengthened its AI strategy in FY25. The company has launched platforms such as “AI Force” and “Enterprise AI Foundry”, which optimize the entire lifecycle of software development and product engineering. In the first quarter of FY25, HCLTech has signed 12 new AI-integrated deals, many of which involve developing AI solutions.
    • Global expansion and partnerships : The company has further expanded its partnership with Google Cloud, under which 25,000 engineers will be trained on Google Gemini. In addition, HCLTech plans to set up a new AI/Cloud lab in Singapore, which will contribute to AI innovation and talent development in collaboration with local institutions.
    • Employee skilling and training : By the end of FY25, HCLTech aims to train 50,000 employees in generative AI. For this, the company is using platforms such as “AI Force” and “AI Foundry”, which will enable employees to develop and implement AI-based solutions.
    • Acquisitions and strategic partnerships : HCLTech plans acquisitions to strengthen its portfolio in regions such as Japan and Europe. The company is focused on semiconductor, automotive and platform-based businesses, which can provide stable revenue streams.

    Read Also: SAIL Vs Tata Steel: Which is Better?

    Future plans of Infosys

    The future plans of Infosys are mentioned below;

    • Investments in Generative AI and Cloud Services: Infosys forecasts its revenue growth for FY25 to be between 3% and 4%, reflecting the growing demand for AI and cloud services. The company is currently working on over 225 generative AI projects, and has integrated GenAI components across all of its service lines.
    • Strategic Partnerships and Acquisitions : Infosys has partnered with companies such as “Citizens Financial Group” and “Telstra”, enabling it to drive AI-driven transformation in the financial services and telecommunications sectors. In addition, the company has acquired “InSemi”, a German R&D company, strengthening its chip-to-cloud strategy.
    • Employee Skilling and Training : Infosys has made significant investments to train its employees in GenAI, and its employees have already built over 3 million lines of code using large language models. The company aims to enable its employees to develop and implement AI-powered solutions.
    • Responsible AI and Ethics : Infosys has launched the “Responsible AI Toolkit”, which helps ensure the ethical use of AI. This toolkit is helpful in identifying and addressing security risks, privacy violations, biased results, and other related issues.

    Conclusion

    Both HCLTech and Infosys are major players in the Indian IT sector, which have gained a strong foothold in the market on the basis of their respective strengths and strategies. While Infosys focuses more on digital innovation and operational excellence, HCLTech emphasizes on cloud services and large enterprise contracts. Both have displayed strong financial performance, but their future growth plans are different. Therefore, investment decisions should not be made only on the basis of financial metrics, but keeping in mind the company’s future plans, your individual goals and risk tolerance. It is advised to consult a financial advisor before investing.

    S.NO.Check Out These Interesting Posts You Might Enjoy!
    1JK Tyre Vs CEAT: Which is Better?
    2XIRR Vs CAGR: Investment Return Metrics
    3ITC vs HUL: Comparison of India’s FMCG Giants
    4IndiGo vs SpiceJet: Which is Better?
    5Tata Motors Vs Ashok Leyland: Which is Better?

    Frequently Asked Questions (FAQs)

    1. What is the main difference between HCLTech and Infosys?

      HCLTech focuses more on cloud and enterprise services, while Infosys leads in digital innovation and operational excellence.

    2. Which company has better financial performance in 2025?

      Infosys revenue and profit margins are better than that of HCLTech.

    3. Are both companies expanding globally?

      Yes, both companies are operating in around 60 countries and adding new clients.

    4. Which company is investing more in AI and cloud services?

      Both companies are investing in AI and cloud, but HCLTech has recently been more active in securing contracts related to cloud services.

    5. Should I invest in HCLTech or Infosys?

      The investment decision depends on your investment strategy and risk tolerance as both companies are strong players in the IT sector.

  • Wipro Vs Infosys: Which is Better?

    Wipro Vs Infosys: Which is Better?

    Wipro and Infosys are two very important names in the Indian IT industry. Both companies have been active in technology services for the last several decades and now have a strong presence at the global level. Infosys is today considered a leader in modern technologies like AI, cloud and digital transformation, while Wipro is also expanding rapidly in these areas.

    In this case study, Wipro and Infosys will be compared on the basis of their business model, financial performance and future growth strategies, so that it becomes clear which company is ahead.

    Company Overview – Wipro

    Wipro’s story is one of growing from a domestic oil company to a global IT leader. It was founded in 1945 in Amalner, Maharashtra, when it manufactured vegetable oil under the name “Western India Vegetable Products”. When Azim Premji took over the reins of the company in 1966, he completely changed its direction. In the 1980s, it took its first step towards the IT sector and in 1981, India’s first minicomputer was developed. Within a few years, in 1982, its name was changed to Wipro Limited and in 1999 it became one of the few Indian IT companies to be listed on the New York Stock Exchange.

    Global Presence and Leadership : Wipro is headquartered in Bengaluru and today its services are spread across more than 65 countries. By 2024, more than 2.3 lakh people worked for the company, of which about 37% are women. Talking about leadership, Srinivas Palia is its CEO since April 2024, who is leading the transformation phase of the company.

    Business Model

    Wipro’s operations are divided into four major segments in which the company shows its expertise:

    • IT Services : Services like software development, IT consulting and system integration.
    • Cloud and Infrastructure : Cloud migration, management and security solutions.
    • Digital Transformation : Providing end-to-end solutions to companies for digital transformation.
    • Consulting : Providing strategic advice while balancing both business and technology.

    Wipro’s revenue in the financial year 2023-24 was around $ 11 billion, with more than 99% coming from IT services.

    Strategic Acquisitions

    To expand globally and adopt new technologies, Wipro has made several key acquisitions over the past few years:

    • Capco (2021) : Strengthened its foothold in financial services consulting
    • Appirio (2016) : Rapidly expanded cloud computing capabilities
    • Designit (2015) : Added design-focused services

    Wipro’s journey is an example of a classic business transformation where the company not only transformed itself by shifting from traditional industry to technology, but also created a strong identity in the global IT world. On the strength of a vision, right decisions and continuous innovation, Wipro is today counted among the most trusted IT companies in India.

    Company Overview – Infosys

    Infosys was founded in 1981 by just seven engineers, with an initial capital of just ₹10,000. At that time, no one had any idea that this small startup would one day be counted among the largest IT companies in the world. In 1999, Infosys created history by getting listed on NASDAQ and today the company is providing its services in 56+ countries.

    Global presence and leadership : Infosys’ headquarters in Bengaluru leads global operations today. As of 2024, the company employs more than 3.43 lakh people, of which more than 40% are women. Salil Parekh is currently the CEO of the company and under his leadership, Infosys is constantly setting new records of growth. 

    Business Model

    Infosys’ business model focuses on both technology and consulting. The company provides customized IT solutions to global clients in the B2B segment, which includes four key services:

    • IT Consulting and Strategy: Providing advice and solutions to automate and optimize business processes.
    • Application Development and Management: Creating and maintaining software based on client needs.
    • Infrastructure Services: Managing cloud migration, secure networks, and IT operations.
    • Outsourcing Services: Outsourcing services related to BPO, finance, and HR.

    Infosys’ total revenue in FY 23-24 was around $19.11 billion, with more than 95% of revenue coming from these technology services.

    Acquisitions and Innovation

    Infosys has always been at the forefront of innovation and technology. To further strengthen its portfolio, it has made some important acquisitions:

    • Skava: To gain expertise in digital commerce and mobile app development
    • Panaya: To improve ERP system testing and automation
    • BASE life science (2022): To increase the reach of the life science sector in Europe

    The company also launched its own innovative products such as:

    • Finacle: Core banking solutions for the banking sector
    • Infosys Nia: Business automation tools based on artificial intelligence

    Infosys’ journey starts from a small dream to becoming a global brand. Behind this is a clear vision, innovation in technology, and strong leadership team. Today, Infosys is not just an IT company, but a platform that is taking businesses around the world towards the digital future.

    Comparative Analysis: Wipro Vs Infosys

    ParticularsWiproInfosys
    Current Price (₹)2661,622
    Market Cap (₹ Crores)2,79,1806,73,751
    52-W High (₹)3252,007
    52-W Low (₹)2251,307
    FII Holdings as of March 202511.13%29.4%
    DII Holdings (as of March 2025)7.47%34.46%
    Book Value (₹)79.1231
    PE Ratio21.325.3
    (Data as of 20 June 2025)

    Read Also: Infosys vs TCS: A Comparative Analysis of IT Giants

    Financial Statements Analysis 

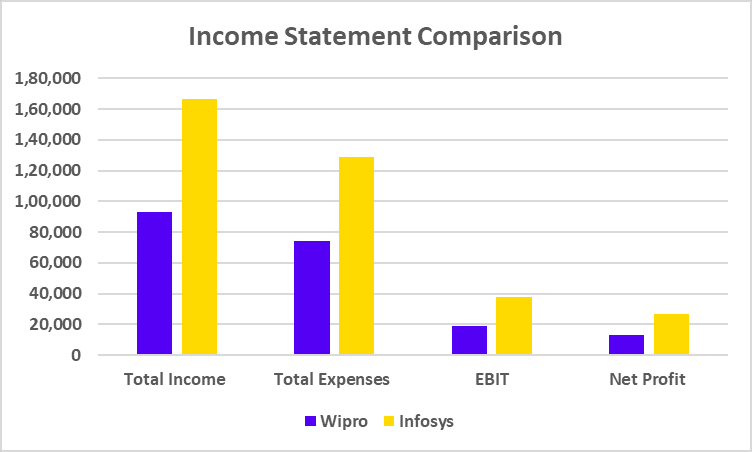
    Income Statement Comparison 

    ParticularsWiproInfosys
    Total Income92,9721,66,590
    Total Expenses74,0251,28,566
    EBIT18,94738,024
    Net Profit13,19226,750
    (All values are in INR crores and the data is as of March 2025)
    Wipro Vs Infosys income statement

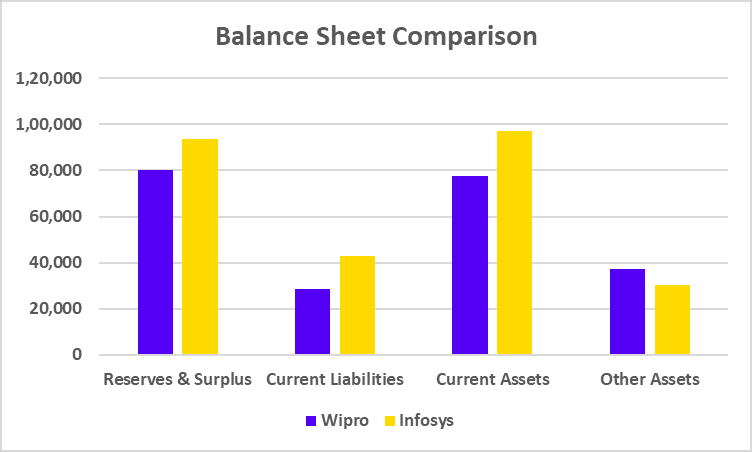
    Balance Sheet Comparison 

    ParticularsWiproInfosys
    Reserves & Surplus80,26993,745
    Current Liabilities28,62542,850
    Current Assets77,77797,099
    Other Assets37,05930,135
    (All values are in INR crores and the data is as of March 2025)
    Wipro Vs Infosys balance sheet

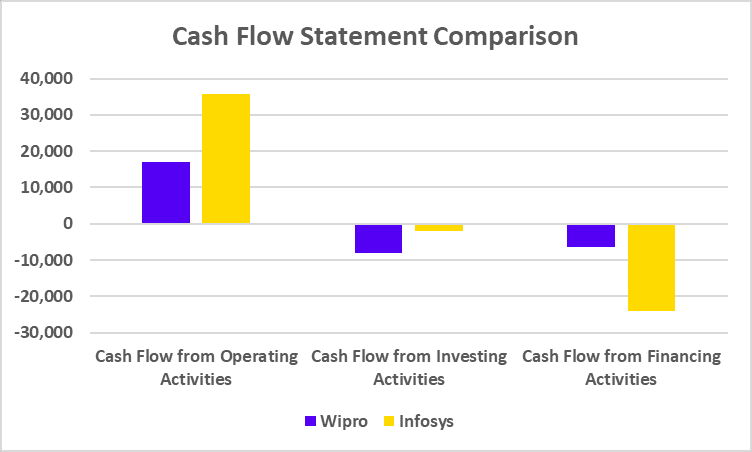
    Cash Flow Statement Comparison 

    ParticularsWiproInfosys
    Cash Flow from Operating Activities16,94235,694
    Cash Flow from Investing Activities-8,073-1,946
    Cash Flow from Financing Activities-6,396-24,161
    (All values are in INR crores and the data is as of March 2025)
    Wipro Vs Infosys cash flow statement

    Key Performance Ratios (KPIs) 

    ParticularsWiproInfosys
    Operating Profit Margin (%)21.2623.32
    Net Profit Margin (%)14.8016.41
    ROE (%)15.9427.87
    ROCE (%)19.0335.85
    Debt to Equity (x)0.200.00
    (Data as of March 2025)

    Read Also: TCS vs Wipro: Comparison Of Two IT Giants

    Future Plans of Wipro

    Future business plans of Wipro are listed below:

    • Restructuring of business model : In 2025, Wipro has revised its global business structure. Now the company has divided its services into four major units – technology services, consulting, engineering and business process services. Its aim is to provide more specialized and quick service to its clients.
    • Focus on innovation and research : A 60,000 square feet ‘Wipro Innovation Network’ center has been launched in Bengaluru, where research is being done on future technologies like AI, blockchain, quantum computing and cyber security. The company believes that quantum computing can be used commercially by the end of 2025.
    • International partnerships : Wipro has recently signed a £500 million deal with Phoenix Group (UK). Apart from this, a multi-year contract has been signed with US cyber security company Entrust to develop security solutions.
    • Emphasis on talent development : Wipro plans to hire more than 10,000 freshers by FY26. The company is adopting a ‘Train-Then-Hire’ model, where youth will first be taught skills and then hired. This will create a quality talent base.
    • Investment in healthcare sector : Wipro has announced an investment of $960 million in India in collaboration with GE Healthcare. The funds will be used to manufacture PET CT scanners and other advanced medical devices.

    All these initiatives clearly show that Wipro wants to make itself a future-ready IT leader in the coming years on the basis of technology, innovation, talent and global deals.

    Read Also: SAIL Vs Tata Steel: Which is Better?

    Future plans of Infosys

    Future business plans of Wipro are listed below:

    • Focus on global expansion : Infosys is constantly expanding its international footprint. In 2025, the company has announced new delivery centers and innovation hubs in markets like Canada, Europe and the US. Its aim is to connect more deeply with local clients and strengthen the ‘near-shore’ model.
    • Investment in AI and generative technology : Infosys launched its in-house generative AI platform Topaz in 2024, and in 2025 it is being used extensively in client projects. The company is focusing on making business processes smarter through AI, automation and machine learning.
    • Big deals and long-term projects : Recently Infosys has signed a 5-year deal worth €454 million with Danske Bank (Denmark). Apart from this, a mega AI and cloud-based project is also being worked on with Liberty Global, which will stabilize the company’s long-term revenues.
    • Human Capital Development : Infosys continues to maintain its fresher-friendly approach in 2025 as well. The company aims to train millions of young students through Infosys Springboard and Lex Platforms, so that they can be prepared for the digital age. Also, internal employees are also being trained in new technologies under the company’s “Reskill and Redeploy” program.
    • Healthtech and Sustainability Initiatives : Infosys is now also moving into the healthtech and green energy sector. The company aims to become carbon neutral by 2025 and has invested towards operating its data centers with green energy. Apart from this, there is also an emphasis on developing AI-supported solutions for healthcare clients.

    Infosys’ strategy is clear: through global expansion, AI-focused innovation, long-term deals and skill development, the company is preparing itself for future challenges.

    Who is Better: Wipro or Infosys?

    Both Infosys and Wipro are moving in different directions in 2025. Infosys is focusing on AI and international client deals, while Wipro has adopted a new global business strategy and is focusing on developing new technologies through innovation centers. While Infosys is focusing on long-term solutions and skill development, Wipro is entering new sectors like healthcare and quantum technology. Who is better depends on how well these companies can execute their business plans in future. Furthermore, investors should conduct a thorough fundamental analysis and consider their risk profile before investing in any of these shares.

    Read Also: Bajaj Finserv and Bajaj Finance: Which is Better?

    Conclusion

    Both Wipro and Infosys have been strong players in the technology industry for a long time. While Infosys has managed to maintain stable growth through its client network and digital solutions, Wipro seems to be proactive in constantly changing and exploring new areas. Both these companies have adapted to the changing technology landscape in different ways. One is growing rapidly, while the other is reshaping its business model to prepare for the future. It is difficult to decide who will come out ahead due to which it would be wise to consult a financial advisor before investing.

    S.NO.Check Out These Interesting Posts You Might Enjoy!
    1JK Tyre Vs CEAT: Which is Better?
    2Apollo Hospitals vs Fortis Healthcare
    3ITC vs HUL: Comparison of India’s FMCG Giants
    4IndiGo vs SpiceJet: Which is Better?
    5Tata Motors Vs Ashok Leyland: Which is Better?

    Frequently Asked Questions (FAQs)

    1. Which company has higher revenue, Wipro or Infosys?

      Both Wipro and Infosys have good earnings, but Infosys has had higher revenue in recent years.

    2. Which company is better in AI technology?

      Infosys has invested heavily in AI technology and their generative AI platform is much talked about.

    3. Is Wipro investing in new sectors?

      Yes, Wipro is active in new areas like healthcare and quantum technology.

    4. Who has a larger global presence?

      Infosys’ global network is considered to be larger than that of Wipro.

    5. Which company focuses more on employee skill development?

      Both companies are working on skill development, but Infosys’ programs are on a larger scale.

  • Voltas vs Blue Star: Which is Better?

    Voltas vs Blue Star: Which is Better?

    With the increasing temperature during the summer season, everyone seems to be rushing to purchase a new air conditioner. While global warming is a serious concern, this growing demand for air conditioners also presents an opportunity for innovation and growth within the air conditioning industry. Companies specializing in cooling technologies are now in a position to develop more energy-efficient, eco-friendly solutions.

    In this blog, we will compare Voltas Limited and Blue Star Limited, the top players in the Indian Air Conditioning industry.

    Voltas Limited Overview

    Voltas was incorporated in 1954 as a result of a collaboration between Tata Sons and Volkart Brothers. By the year 1960, it had established itself as a prominent player in the Indian refrigeration and air conditioning industry. The company has expanded its production capacity and ventured into Middle Eastern countries. It has a strong presence in Southeast Asia and Africa. The company has executed various large projects in the UAE, Qatar, Oman, and Saudi Arabia. The headquarters of the company are situated in Mumbai. 

    Business Model of Voltas Limited

    There are major business segments of Voltas as listed below:

    1. Cooling Products: The company offers cooling solutions for residential, commercial and industrial use. Their product portfolio includes air conditioners, water and air purifiers, and commercial freezers. 
    2. Electro and Mechanical Projects: Voltas has executed various electrical and plumbing projects in India and other countries. They have provided services to Burj Khalifa and Ferrari World.
    3. Water Treatment: They also provide pumps and other services related to water treatment.

    Read Also: Voltas Case Study: Business Model And Key Insights

    Blue Star Limited Overview

    Blue Star was established in 1943 by Mohan T. Advani. Initially, it operated as a reconditioning company. Later, the company ventured into the manufacturing of ice candy machines and bottle coolers. In the late 2000s, the company expanded into electrical, plumbing and fire-fighting contracting businesses. In 2017, the company formed a wholly owned subsidiary called Blue Star International FZCO to manage global sales. The company has seven manufacturing plants across India. Their products, like room air conditioners, water purifiers, air purifiers, commercial refrigeration, etc, have become a household name. The company has its headquarters situated in Mumbai.

    Business Model of Blue Star Limited

    Blue Star has primarily three business segments:

    1. Commercial Air Conditioning System: A significant portion of the company’s revenue comes from providing air conditioning solutions to large-scale projects. It offers central AC services, ducting systems and MEP (Mechanical, Electrical, Plumbing and Fire Fighting Solution) services for various buildings, factories etc. 
    2. Cooling Products: It also manufactures products such as inverter AC, split AC, Window AC, deep freezer, etc.
    3. Electronic and Industrial Systems: Blue Star provides marketing, distribution, and servicing of imported professional electronics and industrial equipment through its wholly-owned subsidiary, Blue Star Engineering & Electronics Ltd.

    Read Also: Bluestar Case Study: Products, Financials, and SWOT Analysis

    Market Information 

    ParticularsVoltas LimitedBlue Star Limited
    Current Market Price (INR)1,2681,604
    Market Capitalisation (In Crores)41,95632,981
    52 Week High (INR)1,9462,420
    52 Week Low (INR)1,1351,521
    Book Value (INR197149
    P/E Ratio (x)50.956.7
    (As of 20 June 2025)

    Performance Comparison

    ReturnVoltas LimitedBlue Star Limited
    1 Month2.09%-0.47%
    6 Months-24.97%-18.95%
    1 Year-14.74%-3.94%
    5 Years130.60%534.28%
    (As of 20 June 2025)

    Financial Statement Comparison

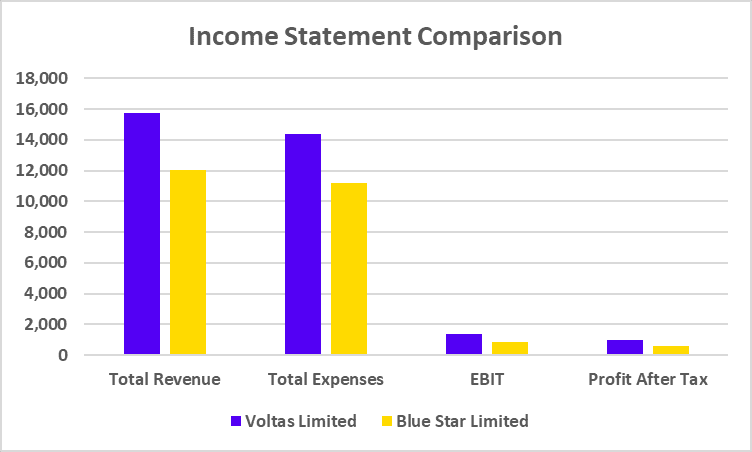
    Income Statement Comparison

    ParticularsVoltas LimitedBlue Star Limited
    Total Revenue15,73712,042
    Total Expenses14,35811,207
    EBIT1,378835
    Profit After Tax960592
    (All values are in INR crores and the data is as of March 2025)

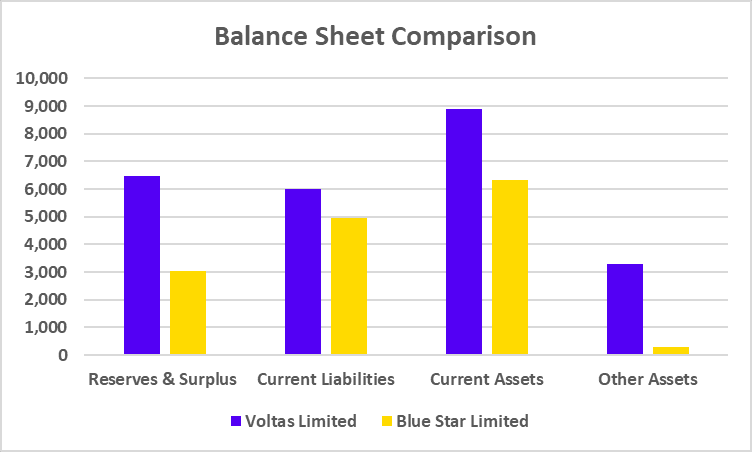
    Balance Sheet Comparison

    ParticularsVoltas LimitedBlue Star Limited
    Reserves & Surplus 6,4803,023
    Current Liabilities6,0134,944
    Current Assets8,8776,312
    Other Assets3,290285
    (All values are in INR crores and the data is as of March 2025)

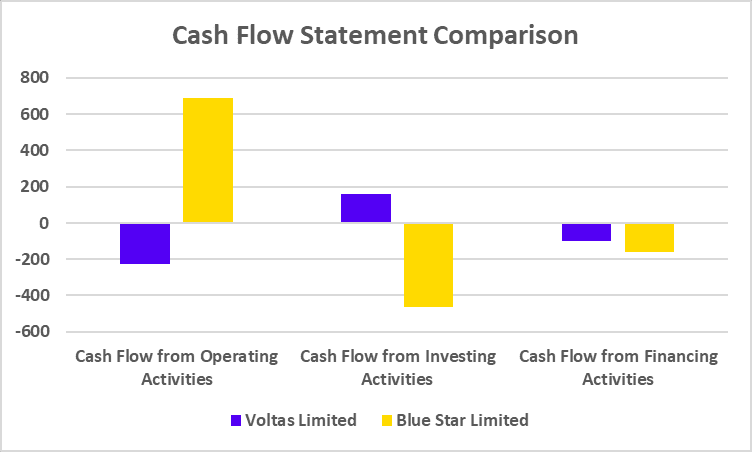
    Cash Flow Statement

    ParticularsVoltas LimitedBlue Star Limited
    Cash Flow from Operating Activities-224688
    Cash Flow from Investing Activities157-463
    Cash Flow from Financing Activities-99-162
    (All values are in INR crores and the data is as of March 2025)

    Read Also: SAIL Vs Tata Steel: Which is Better?

    Key Performance Ratios

    ParticularsVoltas LimitedBlue Star Limited
    Operating Profit Margin (%)8.946.87
    Net Profit Margin (%)6.234.95
    ROE (%)12.9119.28
    ROCE (%)19.3124.82
    Debt to Equity (x)0.130.07

    Future Plan of Voltas Limited

    To expand its business operations, the company is planning to expand its product portfolio by providing efficient and eco-friendly air cooling systems. The company has recently launched the appliances under the Voltas Beko brand name to accelerate its growth in the home appliance segment. The company is also planning to expand its operations in the Middle East and Africa. 

    Future Plan of Blue Star Limited

    To become a leader in air conditioning and the commercial segment, the company is spending a huge amount on R&D to introduce innovative products. The company is planning to invest a huge sum of money to establish manufacturing units in Himachal Pradesh and Mumbai. The company is expected to increase its market share to 14.25% from 13.75 %. The company is also focusing on strengthening its distribution and after-sales services. 

    Read Also: Bajaj Finserv and Bajaj Finance: Which is Better?

    Who is Better: Voltas Limited or Blue Star Limited?

    Both companies have their strengths and weaknesses. Voltas is supported by the Tata Group brand and has a competitive edge in residential AC solutions. It is considered a top player in terms of volume. Voltas has also provided their cooling equipment in Burj Khalifa, and other top commercial and residential buildings. On the other hand, Blue Star offers a more diversified product range in the commercial segment, and it has a significant presence in the commercial sector. It provides solutions like HVAC, MEP, etc. It is difficult to say which one is better as it depends on the company’s fundamentals, future financial performance and investor’s risk profile. You are required to analyse both companies’ financial statements thoroughly before making any investment decision or consult a financial advisor to make an informed investment decision.

    Read Also: Listed AC Manufacturing Companies in India

    Conclusion

    On a concluding note, both Voltas and Blue Star are prominent players in the Indian air conditioning industry. Voltas has partnered with Beko to offer refrigerators, washing machines and other household items, thereby strengthening their market position. On the other hand, Blue Star is primarily focusing on providing innovative cooling solutions. Both companies are aggressively expanding their business operations by providing a wide range of cooling solutions. However, before investing in any of these companies, it is advisable to consult your investment advisor and consider your risk profile.

    S.NO.Check Out These Interesting Posts You Might Enjoy!
    1JK Tyre Vs CEAT: Which is Better?
    2Apollo Hospitals vs Fortis Healthcare
    3ITC vs HUL: Comparison of India’s FMCG Giants
    4IndiGo vs SpiceJet: Which is Better?
    5Tata Motors Vs Ashok Leyland: Which is Better?

    Frequently Asked Questions (FAQs)

    1. Which is the older company, Blue Star or Voltas?

      Blue Star is the older company as it was founded in 1943, whereas Voltas was established in 1954.

    2. Which companies are major competitors for both Voltas and Blue Star?

      Both companies face intense competition from various companies such as LG, Daikin, Hitachi, Samsung, Godrej, etc. 

    3. Which of Blue Star and Voltas is the bigger company?

      Based on market capitalisation, Voltas is the bigger company.

    4. Is Voltas a part of the Tata Group?

      Yes, Voltas Limited is a part of the Tata Group, established due to the collaboration between Tata Sons and Volkart Brothers.

    5. Which company has the higher FII holding among Voltas Limited and Blue Star Limited?

      As of 31st March 2025, Voltas Limited has a higher FII holding of 21.96% compared to 16.94% in Blue Star Limited.  


  • SAIL Vs Tata Steel: Which is Better?

    SAIL Vs Tata Steel: Which is Better?

    India’s steel industry is growing rapidly and the total steel production capacity of the country has reached about 205 million tonnes. The biggest reason for this is the increasing focus on the country’s infrastructure, including development of new cities, new expressways, etc. Experts believe that in the coming times, the demand for steel can grow at a rate of about 8–9% every year.

    In this case study, we will discuss the business models, financial performance, and future plans of both the companies, i.e. SAIL and Tata Steel to help investors make informed decisions.

    Steel Authority of India (SAIL) : An Overview

    SAIL Steel Authority of India Limited was started on 24 January 1973. It is a Maharatna public sector company, which works under the Ministry of Steel, Government of India. For the last several decades, SAIL has remained the backbone of the country’s infrastructure projects and industrial development. Today it is counted among the largest steel manufacturing companies in India.

    Steel Plants and Production Capacity : SAIL’s operational network is spread across the country. It has five main steel plants located in Bhilai in Chhattisgarh, Rourkela in Odisha, Bokaro in Jharkhand, and Durgapur in West Bengal. Apart from this, there are also three specialized steel plants: Salem (Tamil Nadu), Bhadravati (Karnataka) and another in Chandarpur. SAIL has a total crude steel production capacity of 20.3 million tonnes per annum, which the company aims to take to 35 million tonnes by 2031.

    Business Model

    The business model of SAIL can be described as follows:

    • Earnings Structure: SAIL earns a major part of its revenue from the sale of flat and long steel products. About 50% of the revenue comes from flat steel and about 40% from long steel.
    • Raw Material Arrangement: One of its biggest strengths is that SAIL sources most of its iron ore requirement from its own mines. This keeps the cost of raw materials low and reduces risk of supply disruption.
    • Delivery and Distribution: SAIL’s distribution network is spread across India, helping the company deliver high-quality products to its customers on time.
    • Environment and Innovation : SAIL’s focus is not limited to just making steel, but is also serious about environmental conservation. The company has adopted a 4R (Reduce, Reuse, Recycle, Recover) policy and is working towards making fertilizers from steel slag.

    So far, the company has commissioned solar projects of 12.58 MW and plans to add up to 135 MW of solar capacity in the coming time. This clearly shows SAIL’s focus – towards sustainable development and green energy.

    Tata Steel : An Overview 

    Tata Steel was founded in 1907 and is India’s oldest and largest private sector steel company. Headquartered in Mumbai, the company has a long history in the Indian steel industry. The business provided steel to the defense sector during the Second World War. To expand its business operations globally, the company bought Singapore-based NatSteel Holdings in 2004. The company has since completed several domestic and foreign acquisitions. The most recent occurred when it bought Bhushan Steel Limited in 2018. The headquarters of the company are located in Mumbai.

    Steel Plants and Production capacity : Tata Steel’s major plants are located in Jamshedpur (Jharkhand) and Rourkela (Odisha). The company has a production capacity of around 35 million tonnes per annum in India. Tata Steel also has international plants, which reflect its plans to expand globally.

    Read Also: Tata Steel Case Study: Business Model, Financial Statements, SWOT Analysis

    Business Model

    The business model of Tata Steel can be described as follows:

    • Key Products and Revenue Sources : The biggest chunk of Tata Steel’s revenue comes from the sale of flat steel products, which are mainly used in automobiles, construction and heavy industries.
    • Raw Material Management : The company sources most of its raw material requirement from its own mines. Apart from this, the global supply chain is also effectively used to maintain consistent quality.
    • Marketing and Distribution Network : Tata Steel’s distribution network is spread across the country as well as internationally. This ensures that customers receive steel products on time and of the best quality.
    • Sustainable development and innovation : Tata Steel has given priority to environmental protection and has set a target to be net zero by 2045 across its operations. The company’s initiative aligns with the Tata Group’s ‘Project Aalingana’, an ambitious initiative towards achieving  sustainability. Also, Tata Steel has increased investment in solar and wind power and implemented energy efficiency measures. The company is also active in recycling and green technology.

    Tata Steel remains a leading player in the steel industry due to its long operating history, strong technological base and commitment to green energy. Its global client base and distribution network along with an approach to grow their business sustainably make it a preferred investment choice.

    Read Also: Tata Steel vs. JSW Steel: A Comparative Analysis Of Two Steel Giants

    Comparative Analysis: SAIL Vs Tata Steel

    ParticularsSAILTata Steel
    Current Price (₹)127152
    Market Cap (₹ Crores)52,4621,89,812
    52-W High (₹)159183
    52-W Low (₹)99.2123
    FII Holdings as of March 20253.20%18.78%
    DII Holdings (as of March 2025)15.75%24.68%
    Book Value (₹)14373.0
    PE Ratio20.257.2
    (Data as of 18 June 2025)

    Financial Statements Analysis

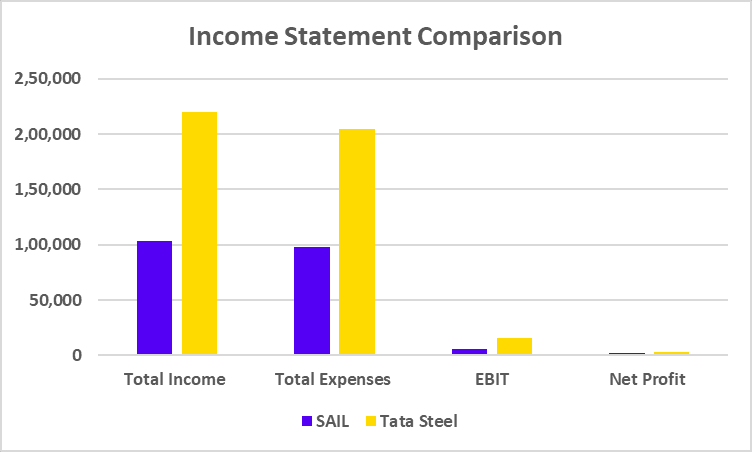
    Income Statement Comparison 

    ParticularsSAILTata Steel
    Total Income1,03,3542,20,083
    Total Expenses97,7962,04,520
    EBIT5,55715,563
    Net Profit1,8852,982
    (All values are in INR crores and the data is as of March 2025)

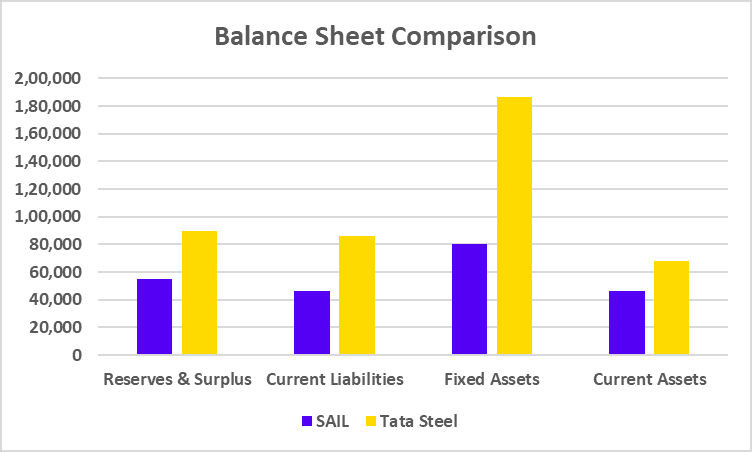
    Balance Sheet Comparison 

    ParticularsSAILTata Steel
    Reserves & Surplus54,77589,922
    Current Liabilities46,19086,093
    Fixed Assets80,5321,86,577
    Current Assets46,48068,391
    (All values are in INR crores and the data is as of March 2025)

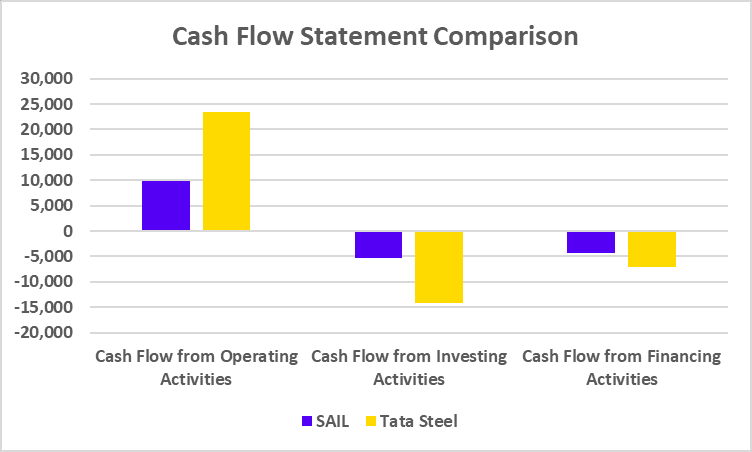
    Cash Flow Statement Comparison

    ParticularsSAILTata Steel
    Cash Flow from Operating Activities9,91423,511
    Cash Flow from Investing Activities-5,268-14,172
    Cash Flow from Financing Activities-4,423-7,002
    (All values are in INR crores and the data is as of March 2025)

    Key Performance Ratios (KPIs)

    ParticularsSAILTata Steel
    Operating Profit Margin (%)5.727.51
    Net Profit Margin (%)1.831.36
    ROE (%)4.023.75
    ROCE (%)6.508.49
    Debt to Equity (x)0.510.98
    (Sail Data as of March 2024 & Tata Steel Data as of March 2025)

    Read Also: Tata Power Vs Adani Power: Comparison Of Two Energy Giants

    Future Plans of SAIL

    The future business plans of SAIL are listed below:

    • Major expansion in production capacity : SAIL has set a clear target to increase its production capacity to 35 million tonnes per annum by 2031. For this, the company is carrying out large-scale modernization of its major plants like Bhilai, Rourkela, Bokaro, Durgapur and Ispat Nagar. SAIL is increasing the capacity of old plants through installing new machinery, energy-efficient technology and automation, so that both domestic demand and exports can be better met.
    • Investment in green energy : Keeping in mind environmental protection, SAIL has also taken steps towards green energy. The company has set a target of solar energy production up to 135 MW, out of which work has already begun on several projects. Along with this, investing in wind energy and energy production from waste are also being considered in the future. This step will not only reduce carbon emissions but will also reduce the energy costs of the company.
    • Sustainable development and recycling : SAIL is now moving its business model towards manufacturing of ‘sustainable steel’. The company has planned to reduce the consumption of raw materials and water by adopting the 4R strategy (Reduce, Reuse, Recycle, Recover). New initiatives are also being taken regarding the reuse of scrap steel, water purification plants and efficient consumption of energy, so that production increases but the environmental impact is reduced.

    Future Plans of Tata Steel

    The future business plans of Tata Steel are listed below:

    • International restructuring and expansion : Tata Steel has started a major restructuring to make its business operations more competitive and profitable in Europe. Technological changes and cost reductions are being made in the plants located in Britain and the Netherlands. At the same time, the construction of the second phase of the Kalinganagar plant has started in India, which will significantly increase the domestic production capacity of the company. This will enable Tata Steel to further strengthen its market share in India.
    • Long-term goal of net-zero : The company has committed to achieve net-zero carbon emissions by 2045. Under this initiative, Tata Steel has already invested in projects focused on developing alternative energy sources like green hydrogen, solar and wind energy. Apart from this, work is also being done on the use of eco-friendly fuel like biochar in place of coking coal.
    • Digital transformation and smart manufacturing : Tata Steel is making its manufacturing process more efficient through the use of advanced technologies. This is not only reducing the manufacturing costs but also helping in manufacturing steel of superior quality. 

    Read Also: Mahindra & Mahindra vs Tata Motors: Which is Better?

    Who is Better: SAIL or Tata Steel?

    Both SAIL and Tata Steel are among India’s oldest and largest steel companies, with their own strengths and business plans. SAIL, being a PSU company, plays a crucial role in the country’s major infrastructure projects and has a strong production capacity. The company’s plans to increase its production capacity will help it cater to its customer base on a timely basis. 

    On the other hand, Tata Steel has a good presence at the global level and is far ahead in terms of sustainability and technology. Both companies are strengthening the Indian steel industry in their own way. SAIL has many big plants in the country, while Tata Steel is known for its innovation and strong hold in the international market. So it is difficult to say who is better as the strengths of both depend on their future business plans and how well they execute them. It is advised to consult a financial advisor before investing in any of them.

    Read Also: Tata Motors vs Maruti Suzuki? Analysis of Auto Stocks

    Conclusion

    Both SAIL and Tata Steel are pillars of the Indian steel industry, contributing to its growth in different ways. SAIL has been largely focussing on increasing its production capacity to cater to the demand of steel required to accomplish national infrastructure projects, while Tata Steel has taken key steps towards technological innovation and environmental protection. It would be wise to consult a financial advisor before making any investment investment.

    S.NO.Check Out These Interesting Posts You Might Enjoy!
    1JK Tyre Vs CEAT: Which is Better?
    2Apollo Hospitals vs Fortis Healthcare
    3ITC vs HUL: Comparison of India’s FMCG Giants
    4IndiGo vs SpiceJet: Which is Better?
    5Tata Motors Vs Ashok Leyland: Which is Better?

    FAQs

    1. Which company leads in production capacity?

      Tata Steel’s production capacity in India is slightly more than that of SAIL.

    2. Do both companies prioritize eco-friendly practices?

      Yes, both companies focus on sustainability and have invested in various initiatives.

    3. Is Tata Steel government-owned?

      No, Tata Steel is a private company, SAIL is a government company.

    4. Who has better international reach?

      Tata Steel has a strong presence overseas.

    5. Is investing in both companies advisable?

      Investing in both companies depends on through analysis of the company’s fundamentals, knowledge of your risk profile and financial goals.

  • JK Tyre Vs CEAT: Which is Better?

    JK Tyre Vs CEAT: Which is Better?

    When we talk about the tyre industry, the names of JK Tyre and CEAT come first. Both the companies are not only well known in India but also have a strong hold in the international market. Did you know that JK Tyre has recently made a big investment to increase its manufacturing capacity, while CEAT has further expanded its reach by acquiring a global brand? 

    In this blog, we will discuss the business models of these two companies, along with their future growth plan and financial performance – so that you can better understand who is ahead in terms of an investment opportunity.

    Company Overview – JK Tyre

    JK Tyre was founded in 1951 as a managing agency business and later began manufacturing tyres. Over the years, it has established itself among the top tyre companies in India. In 1977, the company was the first to introduce radial tyres in the country, which are today considered the mainstay of tyre technology. Over the last four decades, JK Tyre has established a strong hold in the market through its products and innovations.

    Key Business Verticals

    JK Tyre’s business is mainly divided into three segments:

    • Commercial Vehicle Tyres: The company is the market leader in radial tyres for trucks and buses.
    • Passenger Vehicle Tyres: The company has also built a strong presence in the car and SUV segments.
    • Off-Road and Farm Tyres: Its product portfolio also includes tyres used by vehicles in the construction sector and tractors.

    Market Presence :  The company’s distribution network is spread across India, which includes more than 6,000 dealers and 600+ branded retail outlets. Internationally, JK Tyre also exports tyres to more than 100 countries. Apart from this, the company also has three manufacturing plants in Mexico, which further strengthens its global presence.

    Brands and Target Customers : JK Tyre sells tyres under brand names such as ‘JK Tyre’, ‘Vikrant’, and ‘Challenger’. Their focus is on meeting tyre needs of various industries – be it commercial vehicles or passenger vehicles. The company focuses on targeting all types of customer segments: construction vehicles, trucks, and personal vehicles.

    JK Tyre Business Model

    JK Tyres business model has been explained below:

    • Sources of Income : JK Tyre’s income comes primarily from two sources – one, original equipment manufacturers (OEMs), and the other is the aftermarket. About 60% of the company’s revenue comes from the aftermarket, i.e. retail and replacement customers, while the rest is generated from OEM deals and exports.
    • Manufacturing and Global Footprint : The company has 9 plants in India and 3 in Mexico with a combined production capacity of 35 million tyres per annum. This facility helps the company to meet domestic demand as well as international orders on time.
    • Partnerships and Technology : JK Tyre has long-standing partnerships with several leading auto companies. The company has also been at the forefront of technology — for example, innovations like TPMS (Tyre Pressure Monitoring System) have been introduced in smart tyres, which increase both safety and efficiency of vehicles.

    Company Overview – Ceat Ltd.

    CEAT Ltd(Cavi Elettrici e Affini Torino) was first founded in Italy in 1924, but its operations in India began in 1958 and today it is part of the RPG Group. CEAT is now counted among the top tyre companies in India and has a large share especially in the two-wheeler and passenger car tyre segment. The company is known for its strong product portfolio and quality.

    Segments and Product Range

    CEAT’s business covers various vehicle segments:

    • Two-wheeler tyres: This segment represents CEAT’s largest revenue share in India.
    • Passenger car tyres: The company is continuously increasing its hold in the car and SUV segments.
    • Commercial and off-highway tyres: The company also manufactures tyres for truck, tractor and industrial vehicles.

    Production and Network : CEAT has 6 manufacturing plants in India, out of which a new state-of-the-art plant has been built in Chennai recently. The company’s annual production capacity is around 3 crore tyres. Additionally, the company’s export network spans across 100+ countries, further strengthening its global presence.

    Focus on customers and brand value : CEAT’s marketing strategy is highly customer-centric. The company has promoted safe driving through campaigns and has proven its tyres to be reliable and durable. CEAT’s focus is more on quality and retail experience, which strengthens both consumer base and brand value.

    CEAT’s Business Model  

    CEAT’s business model has been explained below:

    • Revenue structure : A large part of CEAT’s revenue comes from the aftermarket, especially from two-wheeler and passenger tyres. About 65% of the revenue comes from the retail and replacement market, while the remaining comes from OEMs and exports. This reflects the company’s brand loyalty and distribution strength.
    • Innovation and technology : CEAT has worked rapidly on technology innovation in recent years. The company has developed special tyres for EV (Electric Vehicles) and recently entered the off-road tyre segment by acquiring the Camso brand from Michelin for $225 million, which is considered a major strategic move.
    • Partnership and Branding : CEAT has partnered with many big auto brands like Hero MotoCorp, Maruti Suzuki and Tata Motors. Apart from this, the company has increased the brand’s visibility through cricket sponsorships and a widespread dealer network.
    Read Also: MRF vs Apollo Tyres: Which is Better?

    Comparative Analysis: JK Tyre vs Ceat Ltd

    ParticularsJK TyreCEAT Ltd
    Current Price (₹)3693,644
    Market Cap (₹ Crores)10,10614,740
    52-W High (₹)5114,044
    52-W Low (₹)2322,322
    FII Holdings as of March 202515.94%15.27%
    DII Holdings (as of March 2025)6.15%21.52%
    Book Value (₹)1771,080
    PE Ratio19.529.9
    (Data as of 16 June 2025)

    Financial Statements Analysis

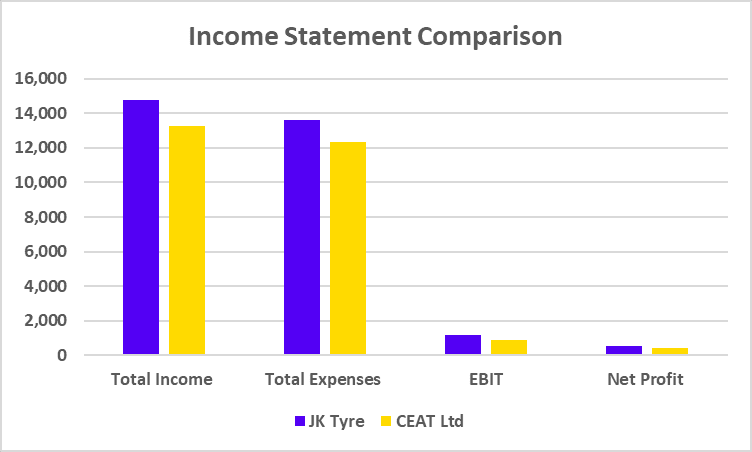
    Income Statement Comparison 

    ParticularsJK TyreCEAT Ltd
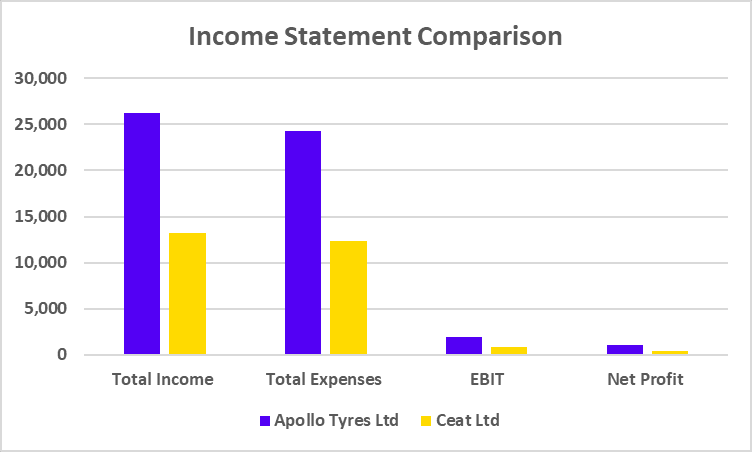
    Total Income14,77213,235
    Total Expenses13,58212,336
    EBIT1,189899
    Net Profit515449
    (All values are in INR crores and the data is as of March 2025)
    Income Statement Comparison of JK Tyre and CEAT

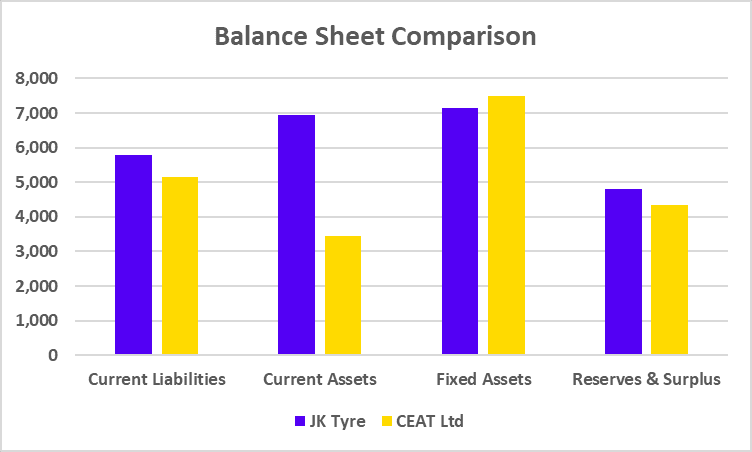
    Balance Sheet Comparison 

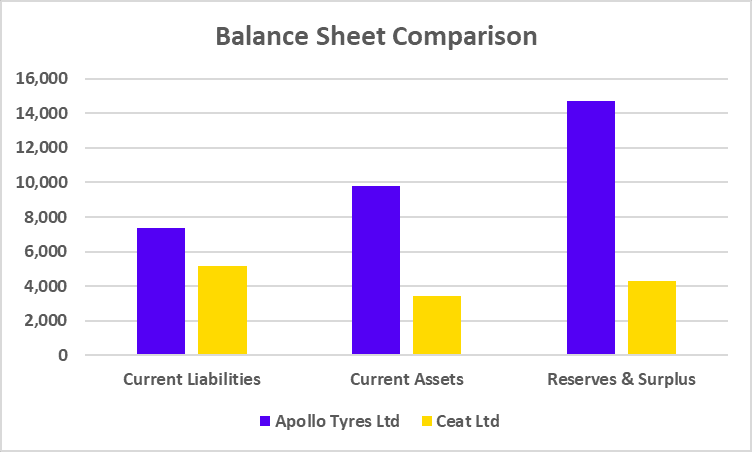
    ParticularsJK TyreCEAT Ltd
    Current Liabilities5,7995,164
    Current Assets6,953
    6,953
    3,432
    Fixed Assets7,1527,498
    Reserves & Surplus4,7954,328
    (All values are in INR crores and the data is as of March 2025)
    Balance Sheet Comparison of JK Tyre and CEAT

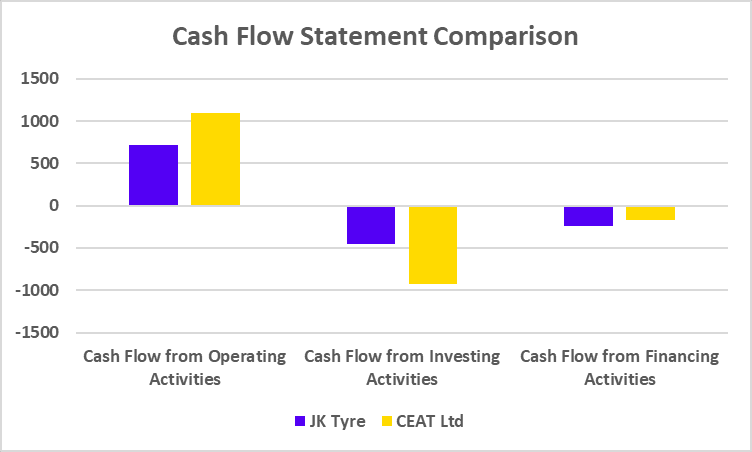
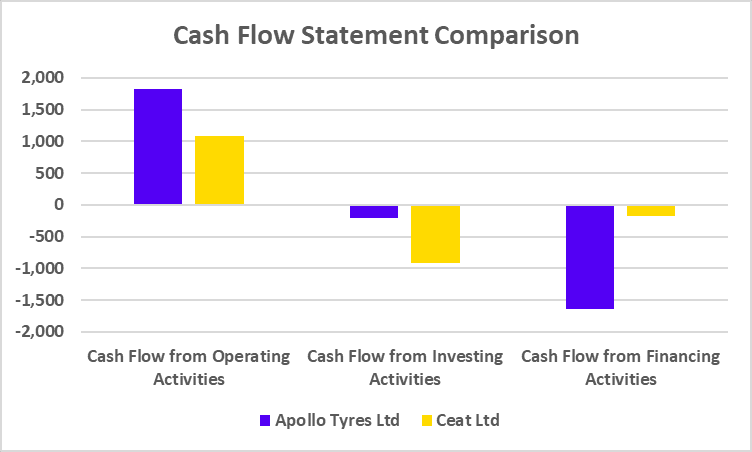
    Cash Flow Statement Comparison

    ParticularsJK TyreCEAT Ltd
    Cash Flow from Operating Activities7151,091
    Cash Flow from Investing Activities-454-922
    Cash Flow from Financing Activities-237-176
    (All values are in INR crores and the data is as of March 2025)
    Cash Flow Statement Comparison of JK Tyre and CEAT

    Key Performance Indicators (KPIs)

    ParticularsJK TyreCEAT Ltd
    Operating Profit Margin (%)8.317.02
    Net Profit Margin (%)3.513.40
    ROE (%)10.2010.81
    ROCE (%)14.0015.36
    Debt to Equity (x)0.990.44
    (Data as of March 2025)

    Read Also: Apollo Tyres Ltd. vs Ceat Ltd. – Which is better?

    Future Plans – JK Tyre 

    Future business plans of JK Tyre are mentioned below:

    • Expansion of production capacity : JK Tyre plans to rapidly expand its production capacity in the coming years. The company has announced an investment of ₹1,400 crore to meet the growing demand for PCR (Passenger Car Radial) and TBR (Truck & Bus Radial) tires.
    • Preparations for EV space : In view of the increasing demand for electric vehicles, JK Tyre is developing EV-friendly tires. These tires are being designed to give better mileage and durability with low rolling resistance.
    • Smart Tyre technology : JK Tyre is also working on a technology called “Smart Tyre”, in which the temperature, pressure and condition of the tyre can be tracked in real time through sensors. This will reduce maintenance costs and increase safety.
    • Sustainability and Green tyres : The company is also focusing on environmentally friendly production by making green tyres made from recycled material, integrating water-conservation and energy efficient measures as a part of its manufacturing process.

    Future Plans – CEAT

    Future business plans of CEAT are mentioned below:

    • Focus on premium tyre segment : CEAT is targeting the SUV and premium car market. The company aims to capture a major market share in the sales of high-end tyres by 2026, which are suitable for high-speed tracks, rough terrain and sporty performance.
    • Expansion in the international market : CEAT recently acquired the Camso brand of French company Michelin, which will strengthen its hold in the off-highway, agricultural and industrial tyre category. This will increase the company’s international presence and brand value.
    • Automation and technology innovation : The company is equipping its manufacturing units with automation. Both quality and efficiency are being enhanced with the help of advanced robotic technology and data analytics.
    • Responsibility towards the climate : CEAT has started several green initiatives including energy saving manufacturing plants, low-waste production, etc. 

    Read Also: Top Tyre Stocks in India

    Who is better: JK Tyre or CEAT Ltd.?

    Both JK Tyre and CEAT are playing a key role in the Indian tyre industry, but their strategies and growth patterns are quite different from each other. JK Tyre is focused on domestic expansion and technological upgrades, while CEAT has increased its focus on international branding and premium segments.

    CEAT is strengthening its product range and export network, while JK Tyre has been working on several new technologies such as Smart Tyre technology and EV-friendly tires. Talking about financial performance, both companies have shown stable performance in the last few years, but their future business plans are different.

    If one prioritizes branding and premium image, CEAT emerges as a strong choice. On the other hand, JK Tyre has an advantage in technological innovation and value segment. Both companies are working on their respective areas of strength and calling one ‘better’ than the other is tough. It is necessary to conduct through analysis before investing in any of them.

    Conclusion

    Both JK Tyre and CEAT are moving ahead in the tyre industry with different business strategies. One is focusing on eco-friendly production and new technology, while the other is strengthening brand visibility and looking to expand by acquisition. Looking at the changing auto sector and consumer needs, both have adapted in their own way. Who will come ahead will depend on the times to come and the direction of the market. But it is clear that both companies are players for the long haul. It is advised to consult a financial advisor before investing.

    S.NO.Check Out These Interesting Posts You Might Enjoy!
    1XIRR Vs CAGR
    2Swiggy Vs Zomato
    3Tata Power Vs Adani Power
    4Tata Motors vs Maruti Suzuki
    5TCS vs Wipro

    Frequently Asked Questions (FAQs)

    1. When was JK Tyre established?

      JK Tyre was established in 1951 as a managing agency business and later on started manufacturing tyres.

    2. Who has a stronger presence in exports – JK Tyre or CEAT?

      CEAT has expanded its presence in the international market in the last few years. Its hold is getting stronger especially in Europe and Africa.

    3. Is JK Tyre investing in electric vehicle (EV) tyre technology?

      Yes, JK Tyre has focused on developing special tyres for EV vehicles and is also working on Smart Tyre technology.

    4. Which tyre company is better for long-term investment?

      Both companies have strong growth prospects for the long term, but who is better depends entirely on the company’s future business performance, which requires a thorough fundamental analysis.

    5. Are both JK Tyre and CEAT listed in the stock market?

      Yes, both the companies are listed on the Indian stock exchanges and their shares are actively traded.

  • Lenskart Case Study: History, Marketing Strategies, and SWOT Analysis

    Lenskart Case Study: History, Marketing Strategies, and SWOT Analysis

    India has a population of more than 140 crores and is a great market for eyewear. For the past many years, there have been eyewear shops available in local areas where one used to go and buy glasses. However, since 2010, a company has drastically changed the Indian eyewear industry by including technology, affordability, and a personalized experience for the consumer. The company is called “Lenskart”.

    In this blog, we will dive deep into Lenskart’s history, marketing strategies that made it successful, and SWOT analysis.

    Overview of Lenskart Company

    Lenskart is an Indian eyewear brand founded in 2010 and is one of Asia’s largest eyewear brands. The company has changed the landscape of the Indian eyewear industry by offering users convenience to choose from a wide variety of spectacles from home. Customers can select the eyewear through their online store by trying it on using 3D technology. Later, the company also opened their offline stores as well.The company headquarters are situated in Gurugram.

    History of Lenskart

    The history of Lenskart can be divided into two phases: foundation and expansion.

    Foundation

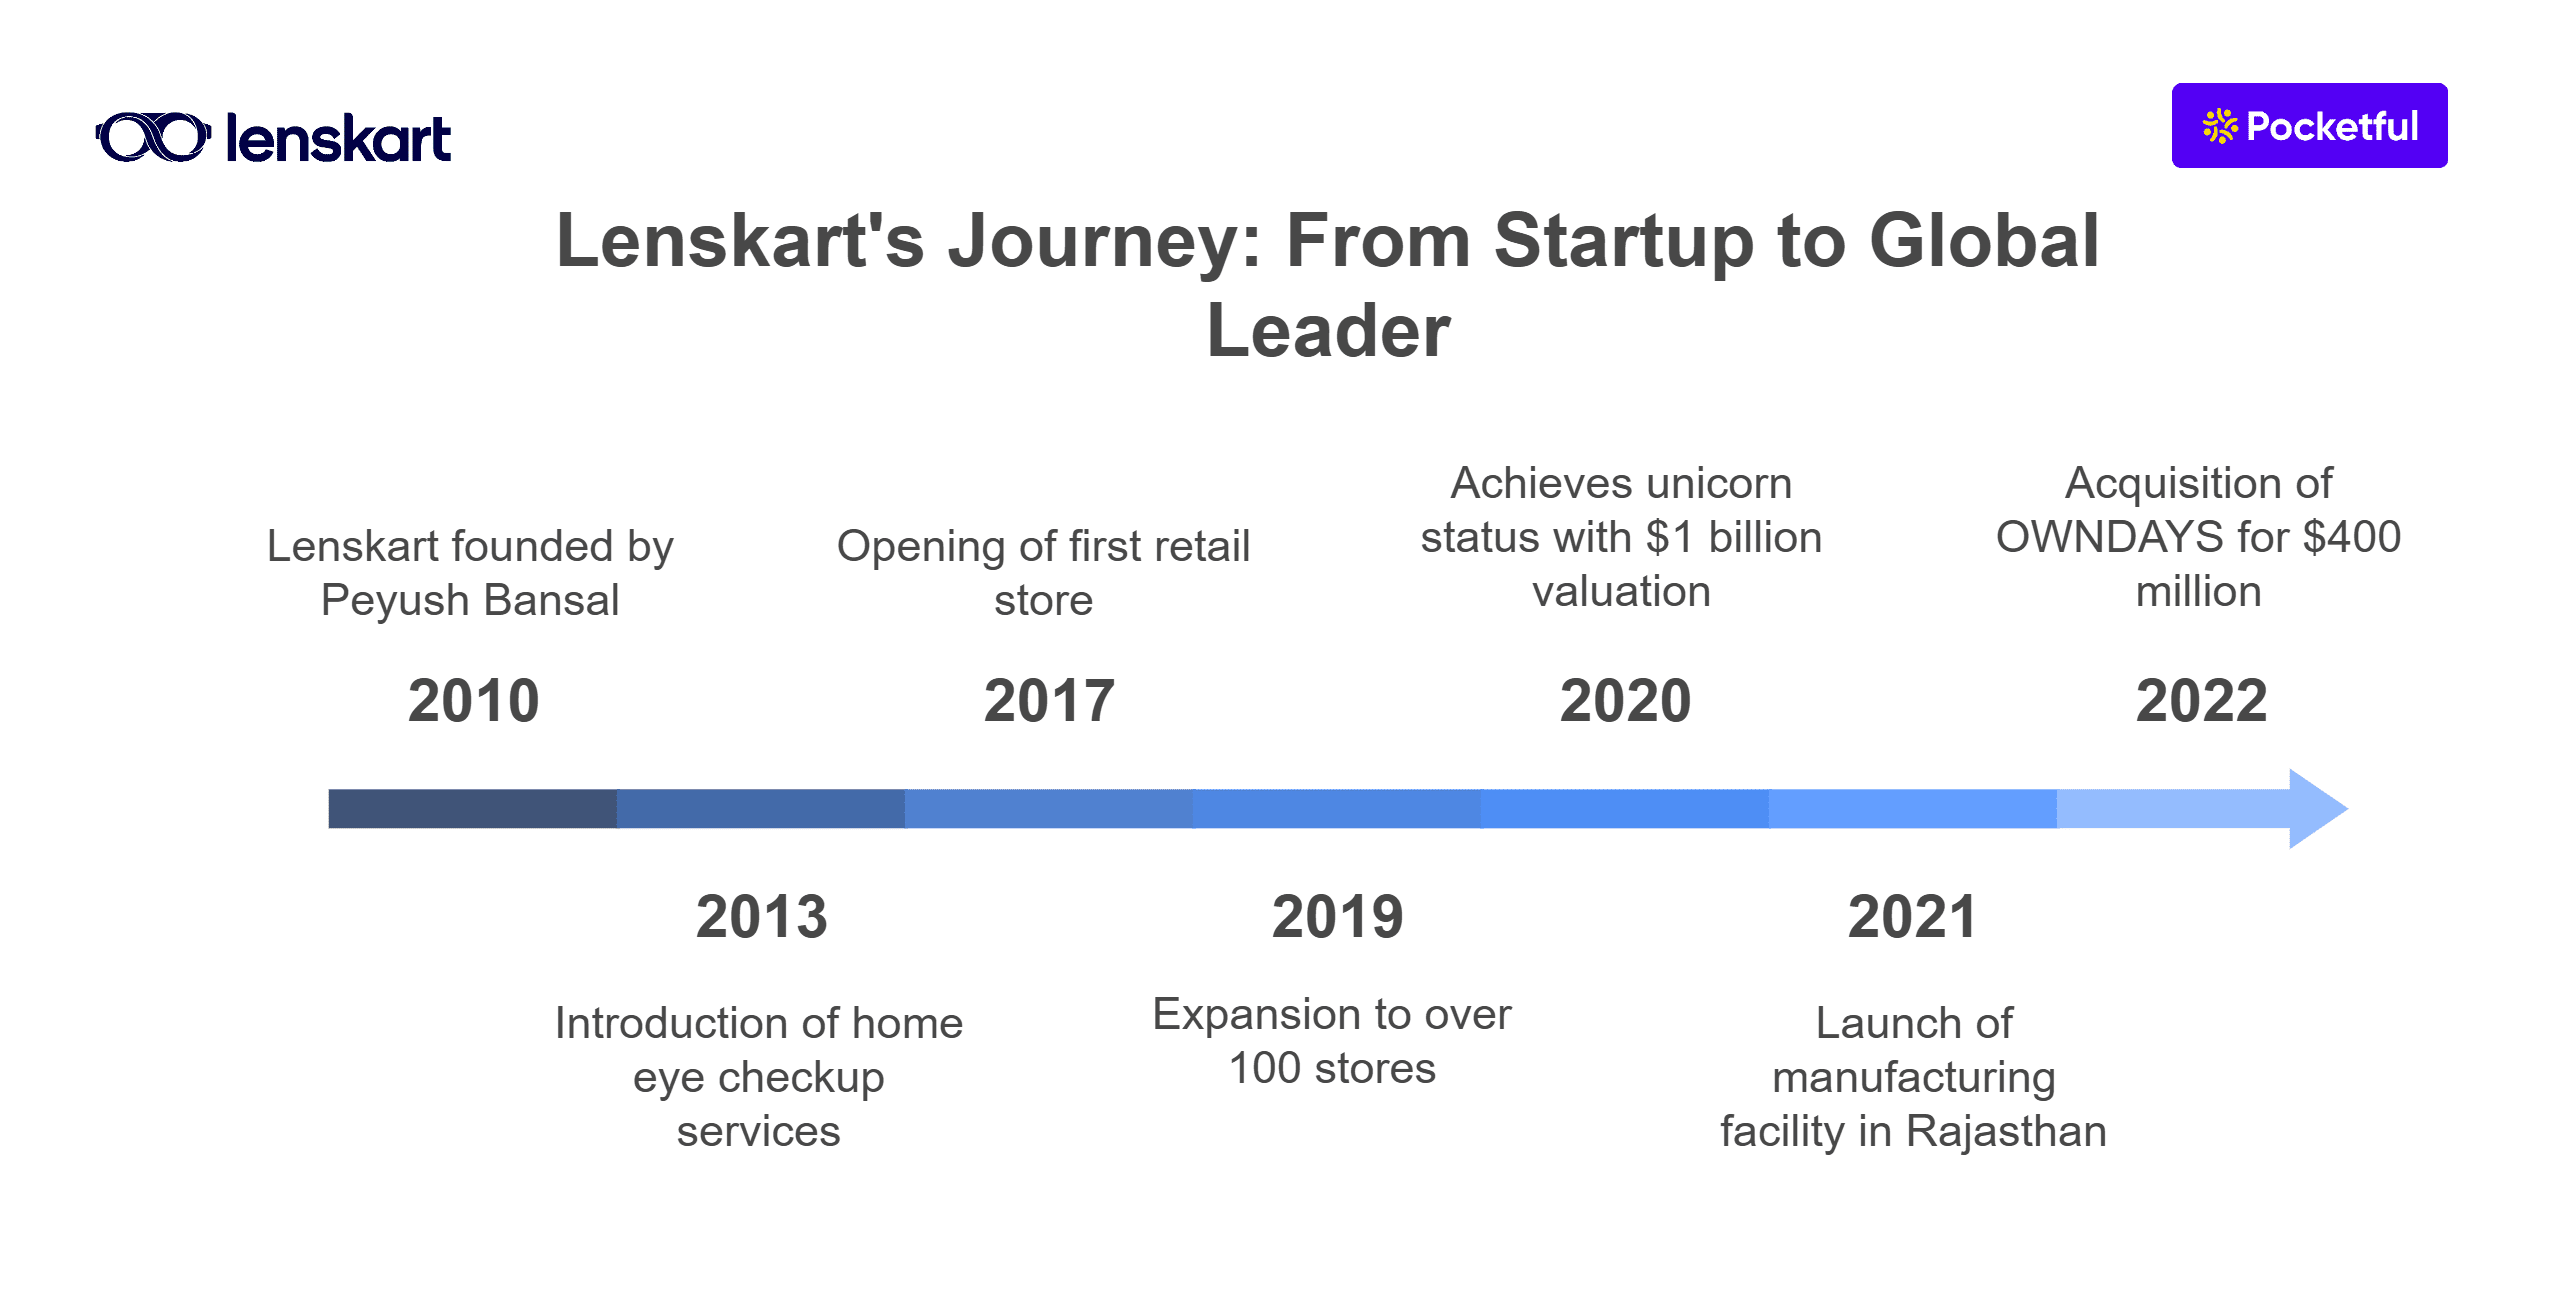
    • Lenskart was founded in 2010 by Peyush Bansal, along with two other individuals, Amit Chaudhary and Sumeet Kaphai.
    • Peyush was a former Microsoft employee and a dropout of IIM Bangalore.
    • Initially he started Valyoo Technologies, which has four verticals such as watchkart, bagskart, jewelskart and lenskart.
    • Among all the ventures, Lenskart emerged as the most promising one.

    Expansion

    • The company initially began as an eyewear retailer offering them at the lowest prices.
    • In 2013, it introduced home eye checkup services that were not provided by any other player in the market.
    • The company introduced a 3D technology through which a user can try eyewear virtually.
    • In 2017, the company opened its retail store and began as an omnichannel model.
    • By 2019, the company had opened more than a hundred stores across the country.
    • By 2020, the company was valued at $1 billion and achieved the status of a unicorn.
    • In 2021, the company began its manufacturing facility in Rajasthan.
    • In 2022, The company acquired a controlling stake in a Japanese eyewear retail chain named OWNDAYS for $400 million.
    • The company recently raised over $200 million from Temasek and Fidelity.
    • The company opened more than 2,000 stores around the world, prominently in countries of Southeast Asia, UAE, and the USA.

    Marketing Strategy of Lenskart

    YouTube video

    Lenskart has used impressive marketing strategies to help it establish itself as a prominent player in the optical industry. The marketing strategies are as follows:

    1. Omni-Channel Presence: Lenskart has a combined presence of both online and offline retail outlets. Through their mobile application and website, they offer a try-on feature for eyewear and they have more than 1500 stores across India.
    2. Digital Marketing: The company has a social media presence across different platforms like Facebook, YouTube, Instagram, etc. They have various strategic collaborations with various lifestyle and fashion influencers. They have a dedicated team of SEO and content marketing, which primarily focuses on enhancing brand visibility.
    3. Celebrity Endorsements: They have renowned celebrities like Katrina Kaif, Bhuvan Bam, etc., as their brand ambassadors.
    4. Pricing: They offer competitive prices and discounts to their customers, through which they stay ahead of the competition. 
    5. Manufacturing: They make their glasses, lenses and frames at their in-house manufacturing facilities, which ensures quality and pricing controls.

    Product Portfolio of Lenskart

    The product portfolio of Lenskart includes the following products:

    1. Prescription Glasses: The company offers all kinds of power glasses, such as single vision, bifocal, progressive, etc.
    2. Frame: It offers a wider range of designs and frames, including rimless, half-rim and full rim.
    3. Sunglasses: The company’s product portfolio also includes all kinds of sunglasses, ranging from aviator, cat-eye, etc. to protect from UV. 
    4. Contact Lenses: Contact lenses of top brands such as Bausch Lomb, Alcon, etc. are available at Lenskart. Along with this, they also have their own brand of contact lenses named Aqualens.

    Business Model of Lenskart

    The business model of Lenskart is mentioned below:

    1. They have a presence across all channels, offering its products to customers through both digital and retail channels.
    2. Lenskart doesn’t compromise with the quality of the product; therefore, they have their manufacturing unit, allowing them to control cost and quality.
    3. The company also offers a subscription program named “Lenskart Gold”, which allows them to have a recurring revenue source.

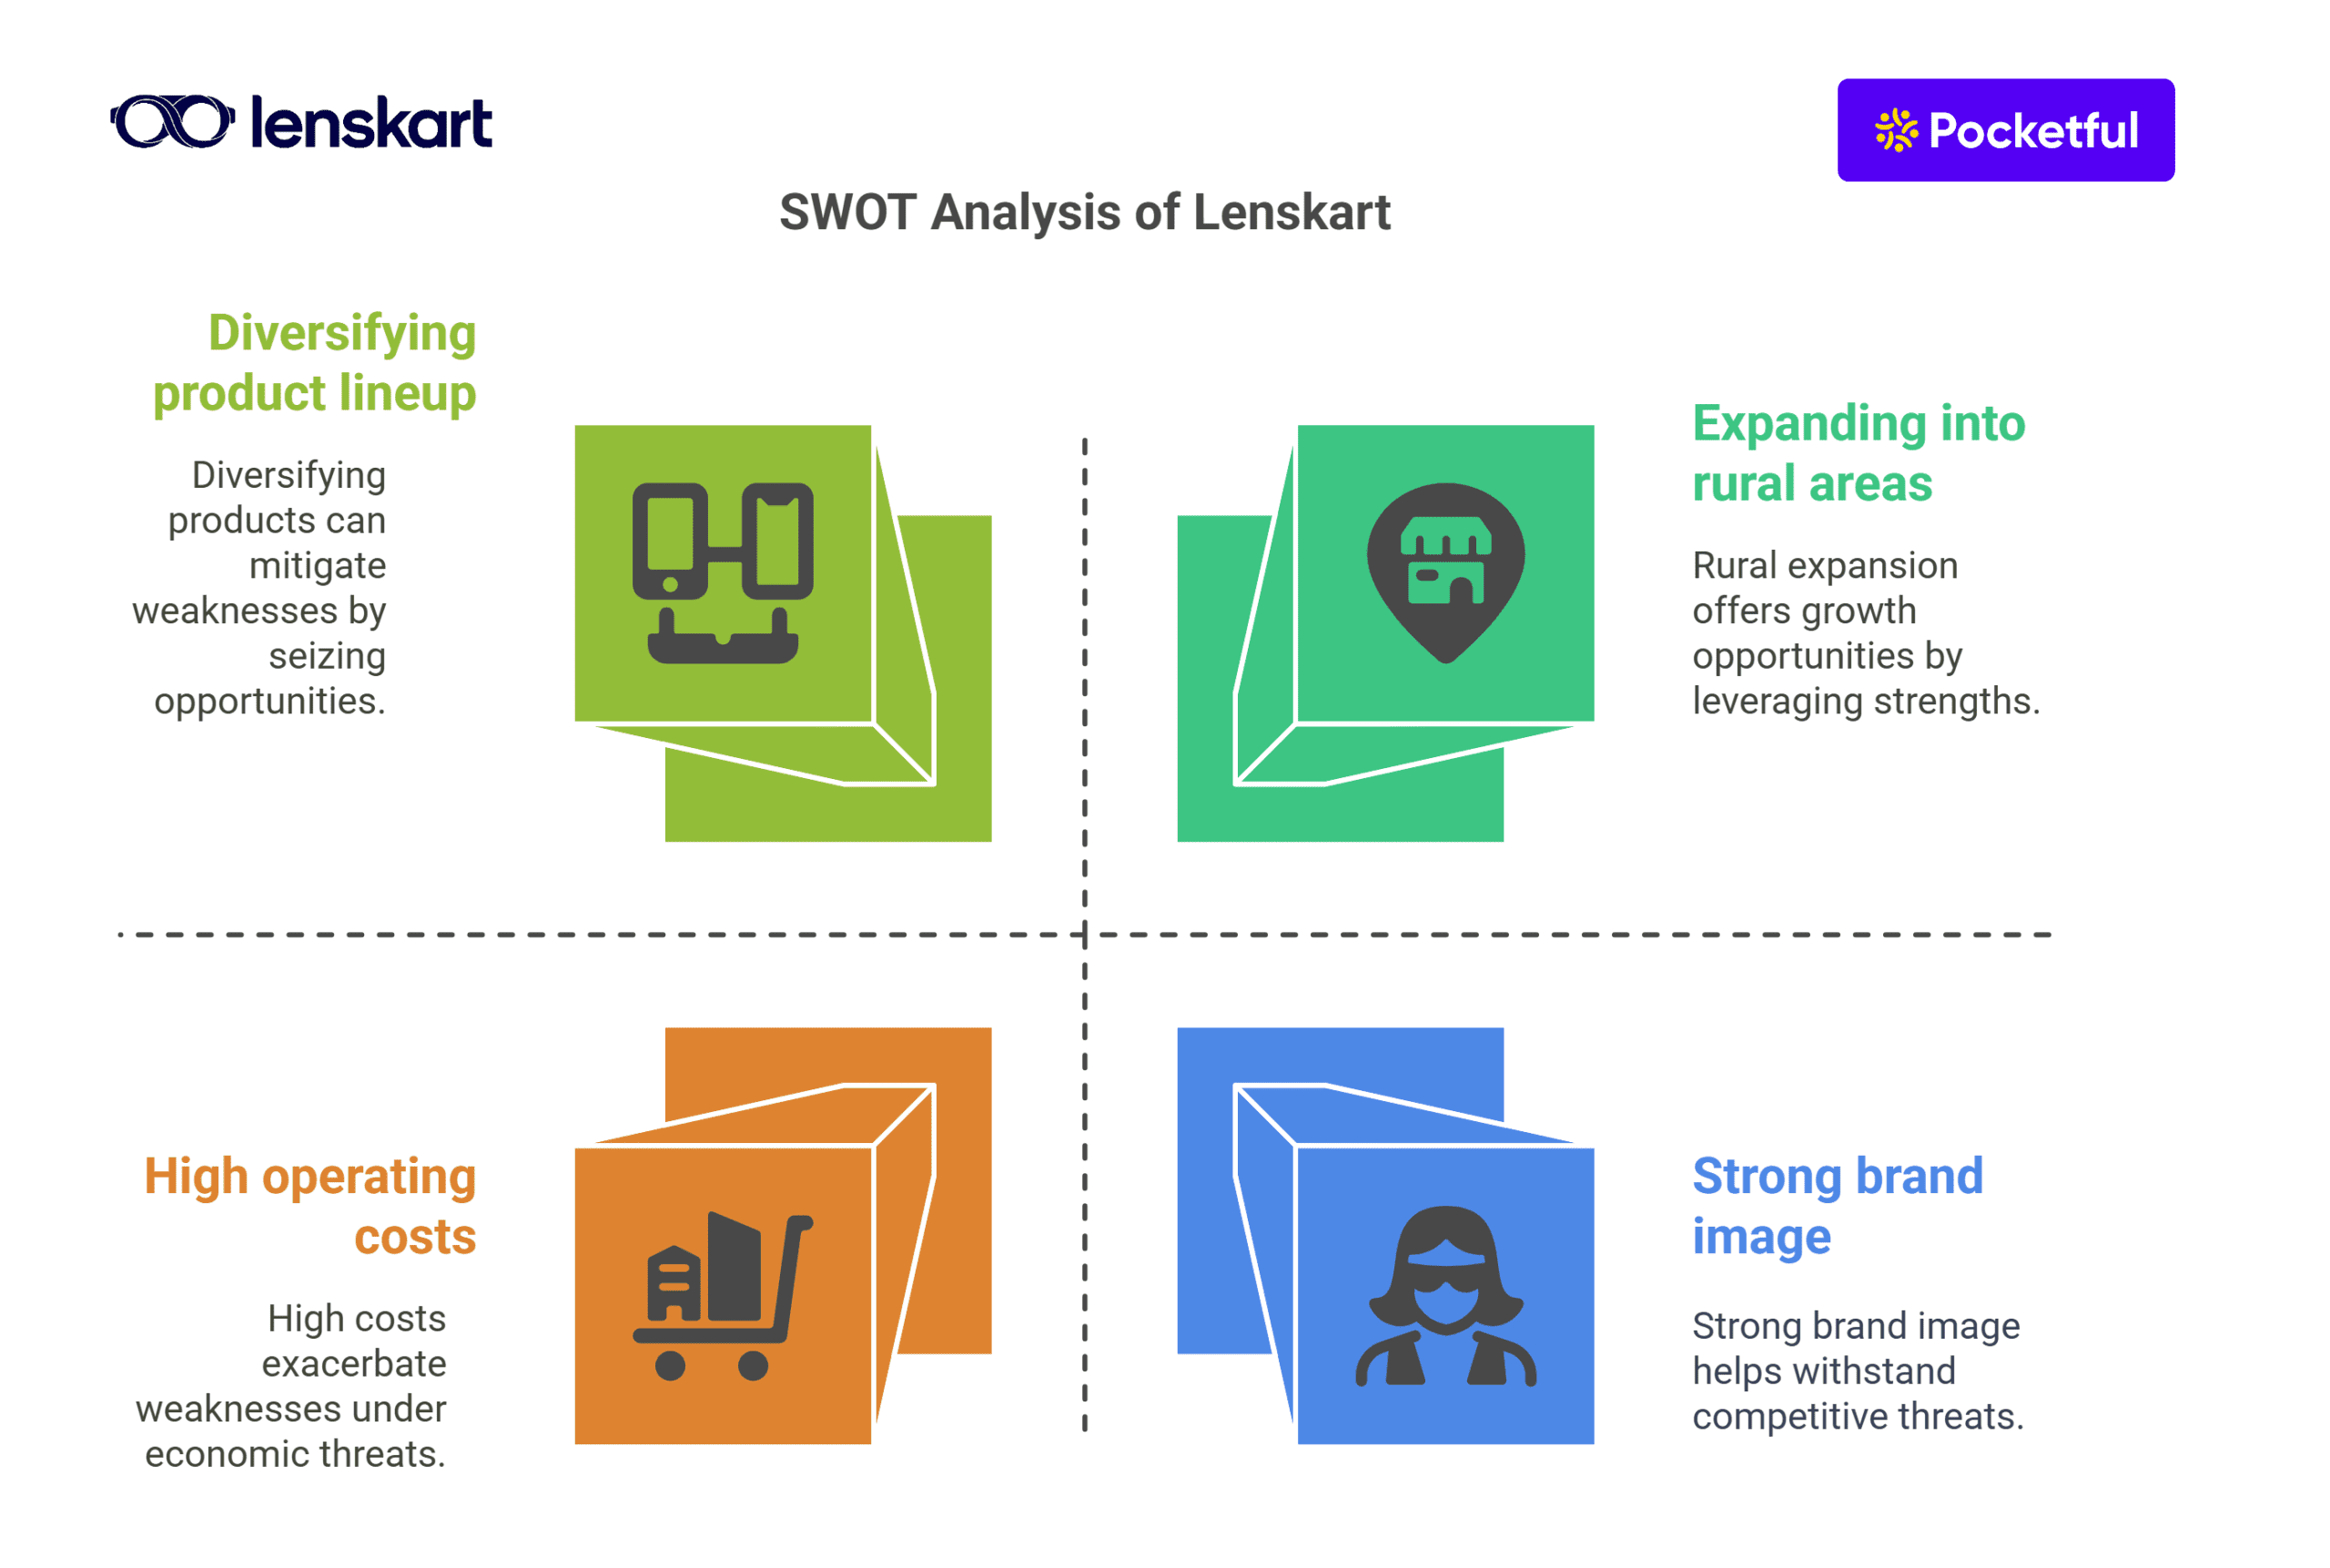
    SWOT Analysis of Lenskart

    SWOT Analysis of Lenskart

    Strengths

    • The company has a strong brand image because of collaborations with various celebrities.
    • It offers its products at affordable rates, which helps it in staying ahead of the competition. 
    • Their customer-centric services, such as home eye testing, free eye checkups, help them establish themselves as a distinguished entity in the eyewear industry.

    Weakness

    • The company’s primary revenue comes from the urban areas, hence they are heavily reliant on urban customers.
    • Lenskart primarily focuses on eyewear and thus doesn’t have diversified revenue streams.
    • The company’s offline store adds to its high operating costs and therefore reduces profits.

    Opportunities

    • The company can expand itself in the rural areas, which provides them with better growth opportunities.
    • Lenskart can add various other products to its product lineup and have a diversified source of revenue.
    • With the rise in smartphone usage, the demand for protective eyewear will also increase, which can lead to an increase in the company’s revenue.

    Threats

    • The company faces intense competition from the local manufacturers, along with other established brands like Titan.
    • Any economic downturn might lead to a decrease in demand for eyewear and protective sunglasses.
    • With advancement in medical technologies, the eye treatment costs are getting cheaper; hence, instead of buying eyewear and contact lenses, people are increasingly preferring eye surgeries over eyeglasses.

    Conclusion

    On a concluding note, Lenskart has changed the landscape of the Indian eyewear industry by successfully integrating offline trust with online convenience. They primarily focus on latest technology and offer the customer the convenience to try on frames using their smartphones and laptops at home. They filled the gap between traditional eyewear and stylish eyewear by introducing trendy eyewear frames. They have strategically partnered with various celebrities, which helps them enhance their brand visibility. In the past 15 years, it has established itself as a prominent player in the Indian eyewear market.

    Frequently Asked Questions (FAQS)

    1. Who is the owner of Lenskart?

      Lenskart is owned by Peyush Bansal, the founder and current CEO of the company.

    2. Where is the headquarters of Lenskart situated?

      The headquarters of Lenskart are situated in Gurgaon.

    3. Is Lenskart a unicorn company?

      Yes, Lenskart is a unicorn company, and its valuation is more than $1 billion.

    4. Is Lenskart a listed company?

      No, Lenskart is not a listed company. However, there are rumours that the company is expected to launch its IPO in 2025.

    5. Is John Jacob an Indian brand?

      Yes, John Jacobs is an Indian brand launched by Lenskart in 2017.

  • Parle Case Study: Business Model, Marketing Strategy, and SWOT Analysis

    Parle Case Study: Business Model, Marketing Strategy, and SWOT Analysis

    Whenever you think of biscuits, one of the names that instantly comes to your mind is Parle-G. Initially it was established as a candies manufacturing company and over time it has established itself as one of the largest biscuit manufacturers in India. 

    In this blog, we will give you an overview of Parle, its history, business model competitors along with the SWOT analysis.

    Parle Company Overview

    Parle is one of the oldest and well-known companies in the FMCG segment renowned for popular brands such as Parle G, Hide & Seek, Mango Bite, Melody, etc. In 2011, Parle G was the top-selling biscuit in India. The company was launched by the Chauhan family and initially it offered affordable snacks but later started baking biscuits. The company uses different marketing strategies to establish itself as a global brand. The company has its headquarters situated in Mumbai.

    History of Parle

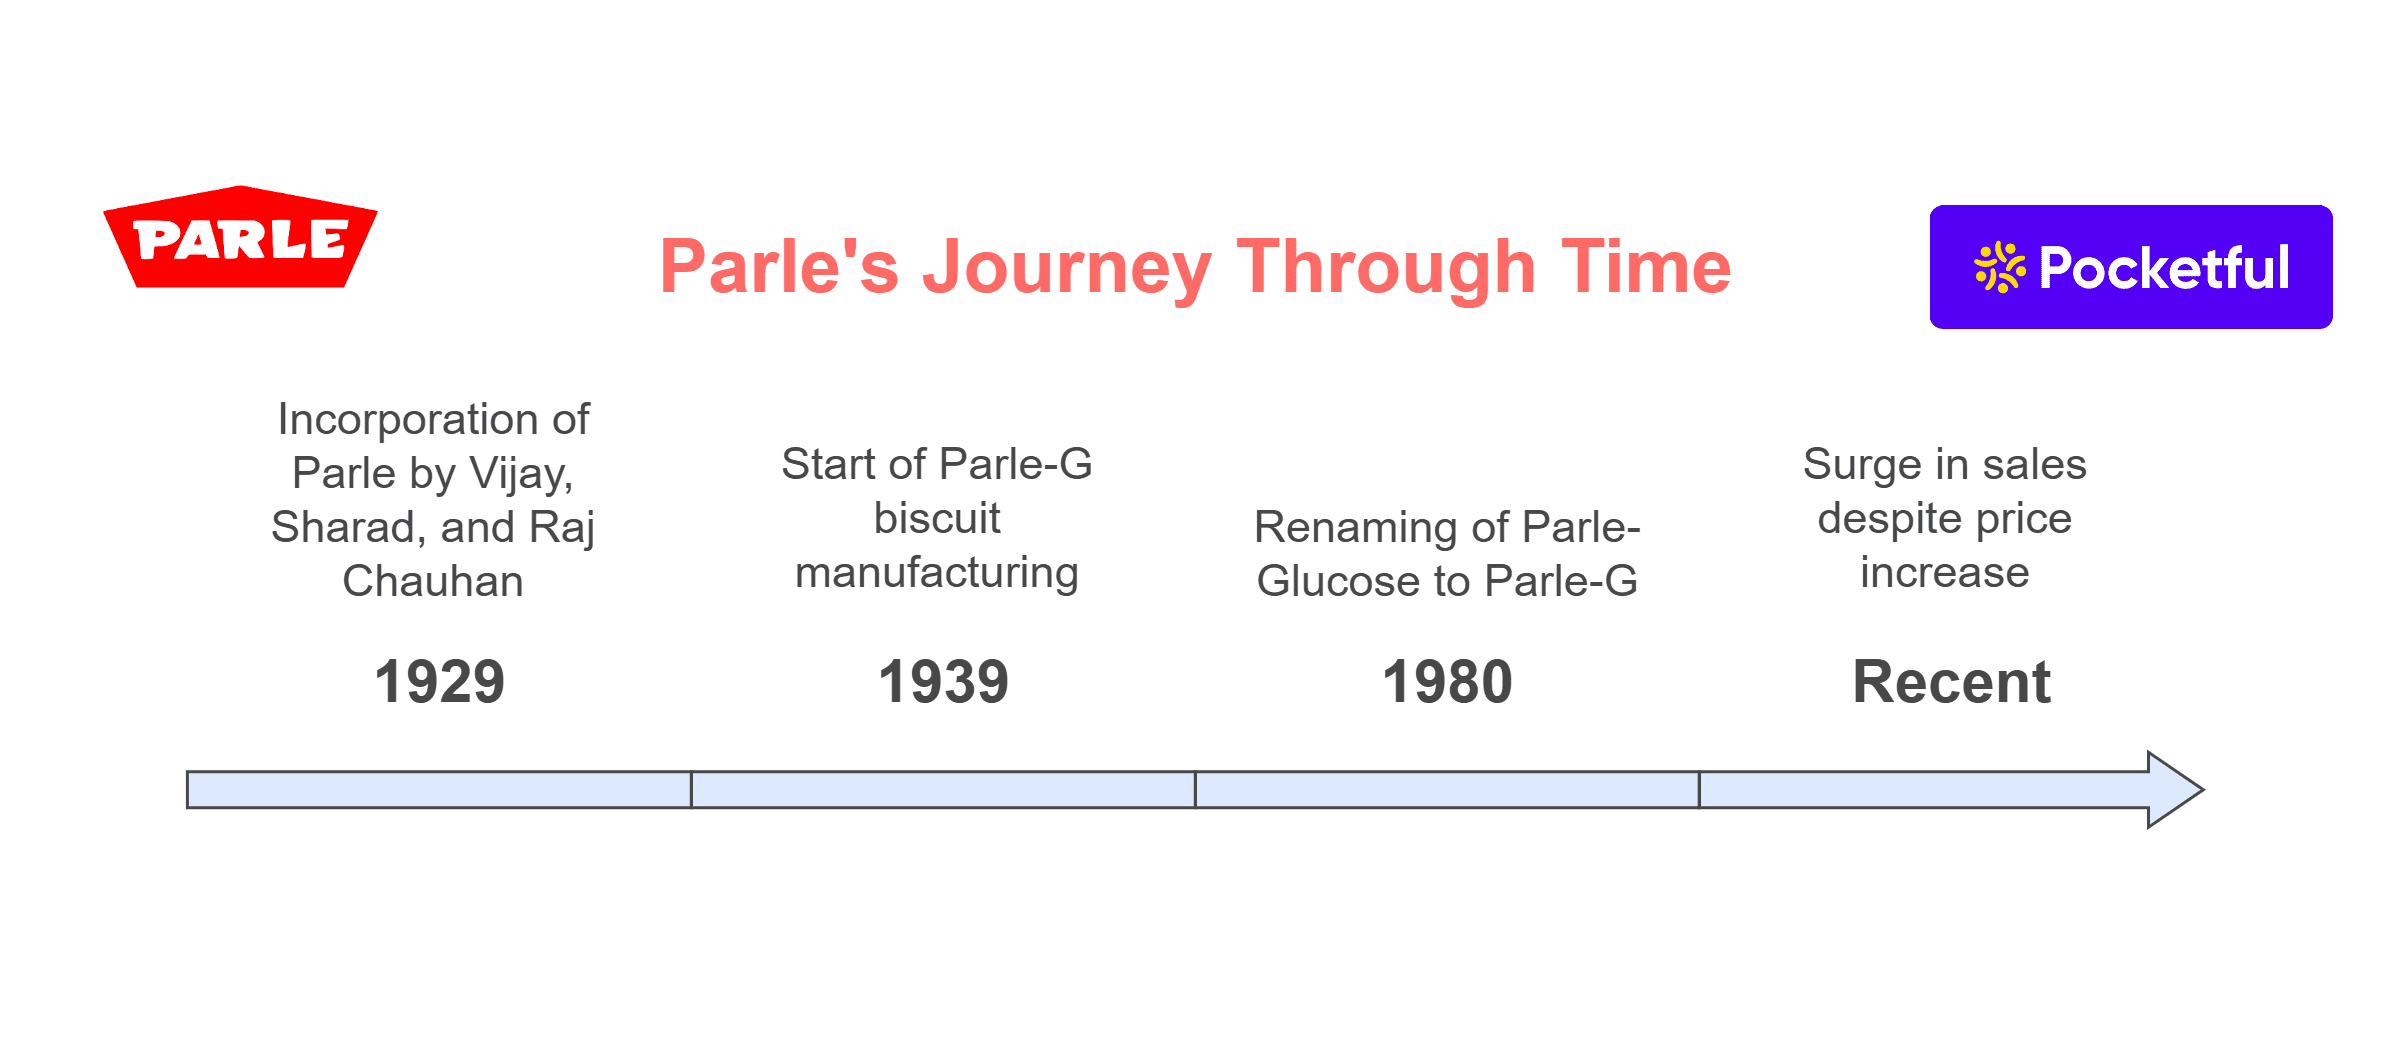
    The company was incorporated in 1929 by Vijay Chauhan, Sharad Chauhan, and Raj Chauhan. It started manufacturing Parle-G biscuits in 1939, which were glucose biscuits. The biscuit was initially named Parle-Glucose biscuit, but in 1980, it changed the name to Parle-G, in which G refers to glucose, and it was campaigned as G means genius. 

    Over the years, the company acquired various international brands such as Dr. Gerard of Poland. To compete with established brands like Kellogg’s and Nestle, it also introduces cereals into its product line. The company has recently increased the prices of Parle G biscuits, but despite this, it records a surge in sales. Currently, the company has more than 50,000 employees.

    Read Also: Haldiram’s Case Study: Business Model, Marketing Strategy, Financial, and SWOT Analysis

    Product Portfolio of Parle

    The Parle has a diversified product portfolio spread across four different categories:

    1. Biscuits: The company offers various biscuits such as Parle-G, Krackjack, Hide & Seek, Monaco, etc.
    2. Confectionery: The company was originally started as a candy manufacturer and sells candies like mango bite, melody, etc.
    3. Snacks: Parle also offers snacks such as wafers, namkeens, etc.
    4. Beverages: Parle has also diversified into the beverages sector and offers beverages like Frooti, Appy Fizz, etc.

    Business Model of Parle

    The business model of Parle is as follows:

    1. Low Cost: Parle primarily focuses on high-volume production, which helps them keep the cost very low. Parle-G is the flagship product of the company which is selling at a very nominal price.
    2. Distribution Network: The company has a strong distribution network, which helps them in reaching the remote areas of India. Through a wide distribution channel the company can easily increase its revenue.
    3. Emotional Connect: The company has successfully made an emotional connection with its customers through its innovative marketing campaign.
    4.  Small Production Facilities: The company has established several small production facilities spread across the country, allowing them to easily achieve high production volumes.

    Marketing Strategy of Parle

    The company uses various marketing strategies, which help them in promoting their brand. These activities include hiring popular celebrities as brand ambassadors, advertising campaigns, etc. The company also places its flyers in stores and promotes its products across social media platforms.

    Competitors of Parle

    Various market players give intense competition to Parle; the companies are as follows:

    1. Britannia Industries Limited: This is one of the prominent competitors of Parle. Their products like Good Day, Marie Gold, Treat, etc. give intense competition to Parle’s products.
    2. ITC Limited: ITC’s snacks and biscuits such as Dark Fantasy, Sunfeast Marie Light, etc. gives direct competition to Parle.
    3. Nestle India: Nestle’s products such as Munch, Kitkat, are very famous among the Indian consumers.
    4. Surya Food and Agro Limited: The company sells its biscuits under the brand name Priya Gold. Some of its most famous products are Marie Lite, Snakker, etc. providing affordable options to the Indian consumers.

    Read Also: Zepto Case Study: Business Model and SWOT Analysis

    SWOT Analysis of Parle

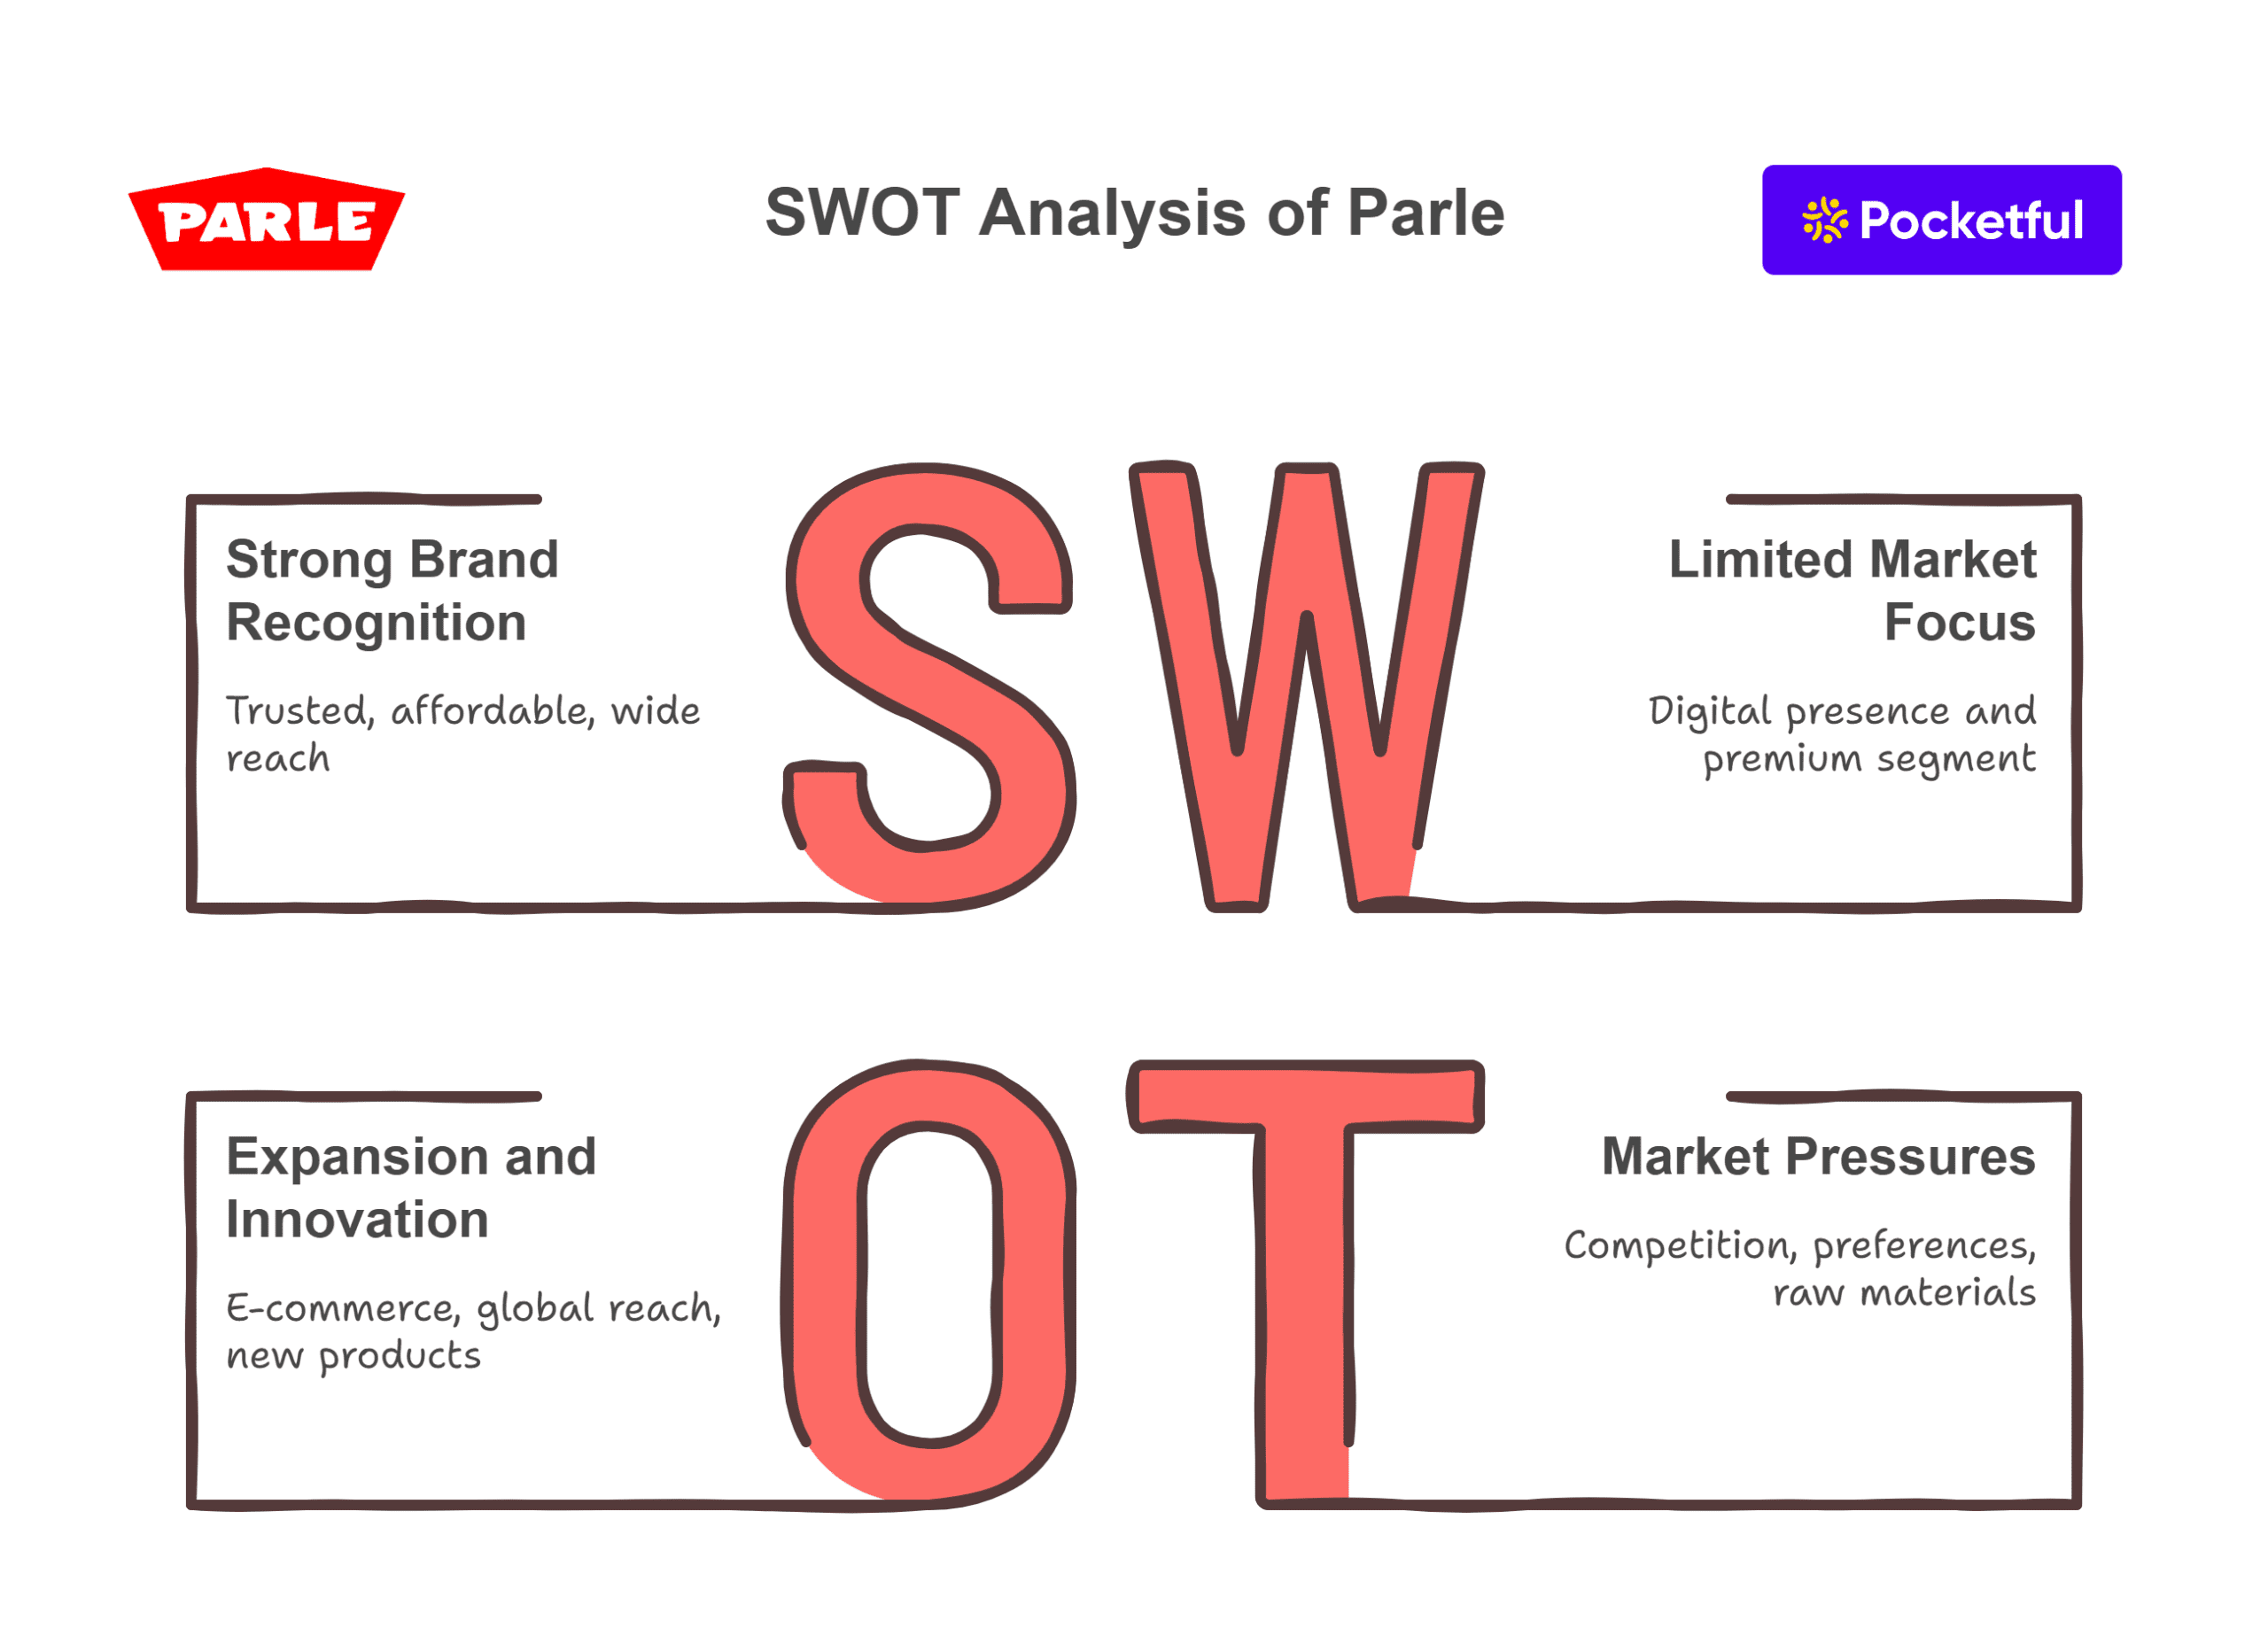
    Strength

    1. Brand Image: The company has a strong brand image and is recognised as a prominent player in the biscuit industry.
    2. Pricing: The products of Parle are priced in a manner that every Indian consumer can easily buy them.
    3. Distribution Network: The company has a strong distribution network spread across India, helping them in reaching every corner of the country.

    Weakness

    1. Limited Digital Presence: The company invests less on expanding its digital presence.
    2. Focus on only Mass Segment: The Parle primarily focuses on the mass segment, and has limited offering in the premium segment.
    3. Dependence: A major source of company revenue comes from its flagship products such as Parle-G and Hide & Seek.

    Opportunities

    1. E-Commerce: With the rise of online retail platforms, companies can increase their revenue.
    2. Global Expansion: In the world of globalization, the company can expand its business operations across the world and increase its revenue.
    3. New Products: It can launch new products and can also introduce new flavours in its existing product line to cater to changing consumer preferences.

    Threat

    1. Competition: The company faces intense competition from existing and new players, including products from local brands.
    2. Consumer Preference: The preferences of consumers are evolving; therefore, in order to stay ahead they must stay in touch with their consumers and incorporate their suggestions in future product offerings.
    3. Raw Material: Increasing raw materials prices can decrease the profit margins of Parle.

    Read Also: Bikaji Foods Case Study – Product Portfolio, Financial Statements, & Swot Analysis

    Conclusion

    Parle is not just a company, it is a household name famous for its products like Parle-G, Hide & Seek, Melody, etc. It started as a small candy manufacturing company and today it has evolved into a well-known brand known for its biscuits, beverages, etc. With the changing consumer preferences, the company is also planning to introduce new flavours and better products. It has recently increased the price of a few of their products; however, it has not impacted the sales of the company. The journey of Parle from being a small business to a well-known FMCG brand can be considered one of the inspiring stories of Indian business.

    S.NO.Check Out These Interesting Posts You Might Enjoy!
    1Zara Case Study: Business Model and Pricing Strategies
    2Intel Case Study: Marketing Strategy and Pricing Strategy
    3McDonald’s Marketing Strategy – Case Study
    4Havells Case Study: Business Model and SWOT Analysis
    5CAMS Case Study: Business Model, KPIs, and SWOT Analysis
    6Kalyan Jewellers Case Study: Business Model, Marketing Strategy & SWOT

    Frequently Asked Questions (FAQS)

    1. Which is the best Parle product?

      Parle-G biscuit is the most famous product of Parle. However, their other products are also famous such as Krackjack, Hide & Seek, candies like mango bite, melody, etc.

    2. Is Parle an Indian company?

      Yes, Parle is an Indian company and was founded in 1929 by the Chauhan brothers.

    3. Who are the major competitors of Parle?

      Parle faces intense competition from various local and global brands like Britannia, ITC, Nestle, etc.

    4. How can Parle maintain its low prices?

      Parle has established various manufacturing units across the country, and focuses on mass production which helps them in keeping their prices low.

    5. Is Parle listed on the Indian Stock Exchange?

      No, Parle is not listed on the Indian Stock Exchange.

  • Tata Motors Vs Ashok Leyland: Which is Better?

    Tata Motors Vs Ashok Leyland: Which is Better?

    When you think of moving cars and trucks on Indian roads, two names instantly pop up: Tata Motors and Ashok Leyland. From the car you drive to the bus you hop on every morning, chances are it rolled out of a factory owned by one of these giants. But while both have become household names, they’ve taken very different routes to become a key player in the Indian automobile sector. 

    Tata Motors is a bit of a jack-of-all-trades as you’ll find their name on practically everything, from compact city cars and rugged SUVs to commercial trucks and other electric vehicles. They’ve got their foot in almost every segment of the automobile world. Ashok Leyland, on the other hand, has carved out its niche by building tough, reliable trucks and buses that keep India moving.

    In this blog, we’ll learn about what sets them apart and help you decide who’s driving ahead in the areas that matter most to you.

    Tata Motors – An Overview 

    For decades, Tata Motors has been more than just a name on Indian roads. Established in 1945 under the wing of the legendary Tata Group, the company first started by building locomotives. But it wasn’t long before they set their eyes on something bigger and hit the road.

    In 1954, Tata Motors Ltd unveiled its first commercial vehicle as a result of its partnership with Germany’s Daimler-Benz. That was just the beginning and over the years, they’ve built everything from trucks and buses to stylish passenger cars and modern electric vehicles.

    One of their biggest achievements was in 1998 with the launch of the Tata Indica, the first car designed and built entirely in India. It was a game-changer and of course, who could forget the Tata Nano? It turned heads worldwide as the most affordable car on the planet.

    Then came 2008, as Tata Motors acquired not one but two legendary car brands: Jaguar and Land Rover from Ford Motor Company. With that bold move, they weren’t just playing in the big leagues, they were announcing themselves on the global stage.

    Fast forward to today, Tata Motors is steering into the future as it’s no longer just about building vehicles, it’s about reimagining mobility itself. From electric cars and connected tech to cleaner, smarter public transport, they’re focused on moving India, and the world, forward, one innovative step at a time.

    Read Also: Tata Motors Case Study: Business Model, Financials, and SWOT Analysis

    Ashok Leyland – An Overview 

    The company’s name, Ashok Leyland Ltd, has been synonymous with commercial vehicles for a long time, visible to anyone who ever caught a glimpse of a bus or a big truck passing by. Ashok Leyland was established in 1948, and as soon as India gained independence, it was known as Ashok Motors. Soon after, Ashok Motors partnered up with Leyland Motors, and this led to the formation of the brand we know today as Ashok Leyland.
    From the early days of assembling Austin cars to becoming one of the top commercial vehicle manufacturers in India, it’s been quite a journey. Over the decades, Ashok Leyland has built everything from buses that carry millions of people daily to powerful trucks that move goods across the country. They’re even behind some of the vehicles used by the Indian Army.

    What makes Ashok Leyland special is its forward-thinking and constant efforts to align its products with the needs of the customers. They’ve led the way in adopting cleaner and more efficient technologies, and are also pushing the frontiers in electric mobility and alternative fuels. Ashok Leyland, in the past few years, has become an international brand as well as it serves more than 50 countries across the world. 

    Comparative Study – Tata Motors vs. Ashok Leyland 

    PARTICULARSTATA MOTORSASHOK LEYLAND
    Current Price (₹)718243
    Market Cap (₹ Crore)2,64,25571,369
    52-W High (₹)1,179265
    52-W Low (₹)536190
    FII Holdings as of March 202517.84%23.32%
    DII Holdings as of March 202517.20%14.03%
    Book Value (₹)31541.6
    PE Ratio (₹)9.3523
    (Data as of 10 June 2025)

    Read Also: Mahindra & Mahindra vs Tata Motors: Which is Better?

    Financial Statements Comparison

    PROFIT & LOSS STATEMENT

    ParticularsTATA MOTORSASHOK LEYLAND
    Total Income4,45,93948,893
    Expenses4,07,36340,398
    Net Profit27,8623,351
    (All values are in INR crores and the data is as of March 2025)
    Tata Motors Vs Ashok Leyland income statement comparison

    BALANCE SHEET

    ParticularsTATA MOTORSASHOK LEYLAND
    Current Liabilities1,66,68426,551
    Other Liabilities93,35042,931
    Fixed Assets1,80,6088,078
    Current Assets1,60,32534,240
    Reserves & Surplus1,15,40811,938
    (All values are in INR crores and the data is as of March 2025)
    Tata Motors Vs Ashok Leyland Balance sheet Comparison

    CASH FLOW STATEMENTS

    ParticularsTATA MOTORSASHOK LEYLAND
    Cash Flow from Operating Activities63,102128
    Cash Flow from Investing Activities-47,594-5,758
    Cash Flow from Financing Activities-18,7866,957
    (All values are in INR crores and the data is as of March 2025)

    Read Also: Tata Motors vs Maruti Suzuki? Analysis of Auto Stocks

    Key Performance Indicators (KPIs)

    ParticularsTATA MOTORSASHOK LEYLAND
    Basic EPS (₹)78.810.58
    Operating Profit Margin (%)8.8917.47
    Net Profit Margin (%)6.336.90
    Return on Equity (%)23.9625.39
    Return on Capital Employed (%)18.4515.37
    Debt-to-Equity (x)0.544.08
    (Data as of March 2025)

    Which Company is Better? 

    It depends on what you are looking for, 

    If you want a company that manufactures everything such as cars, trucks, electric vehicles, and owns even luxury brands like Jaguar and Land Rover, Tata Motors is the winner. It’s bigger, has a global presence, and is leading the way in electric mobility too.

    But if you’re focused only on investing in companies involved in manufacturing of commercial vehicles like trucks and buses, Ashok Leyland can be a good investment option. It’s more specialised and reliable in the commercial vehicle segment. 

    However, it is necessary to conduct thorough research before investing in any of them. It is always recommended to consult a financial advisor before investing.

    Read Also: Tata Motors: Ordinary Shares vs DVR Shares

    Conclusion 

    Tata Motors and Ashok Leyland have both created their unique brand image in both the Indian and global automotive industry. Tata Motors is known for its diverse product range, from ordinary cars to high-end electric models, while Ashok Leyland continues to stick to its core competencies, i.e. manufacturing trustworthy and reliable trucks and buses. Regardless of whether you focus on R&D capabilities, a global presence, or consistent financial performance; both companies have something to offer. It’s not about which is better overall, it’s about which one fits your investment objectives best. You are advised to consult a financial advisor before investing.

    S.NO.Check Out These Interesting Posts You Might Enjoy!
    1Apollo Tyres Ltd. vs Ceat Ltd. – Which is better?
    2BHEL vs BEL -Best Defence and Manufacturing Sector Stocks
    3Asian Paints vs Berger Paints – Which is Better?
    4Maruti Suzuki India Vs Hyundai: Which Car Stock is Better?
    5Devyani International Vs Sapphire Foods – Which is Better?

    Frequently Asked Questions (FAQs)

    1. Which company is older, Tata Motors or Ashok Leyland?

      Tata Motors was founded in 1945, while Ashok Leyland started in 1948.

    2. Does Tata Motors make trucks too?

      Yes! Tata Motors offers a full range of commercial vehicles, including trucks and buses.

    3. Does Ashok Leyland make passenger cars?

      Ashok Leyland focuses only on commercial vehicles like trucks, buses, and defence vehicles.

    4. Who owns Ashok Leyland?

      Ashok Leyland is part of the Hinduja Group.

    5. Is Tata Motors an Indian company?

      Yes, it is an Indian company and part of the Tata Group.

  • Apollo Tyres Ltd. vs Ceat Ltd. – Which is better?

    Apollo Tyres Ltd. vs Ceat Ltd. – Which is better?

    Along with the automobile industry in India, the tyre sector is also growing rapidly, especially as the demand for electric vehicles and smart mobility solutions is increasing. In such a situation, it becomes important for investors to know which tyre company can prove to be a good investment in the long run.

    Apollo Tyres Ltd. and Ceat Ltd. are both well-known companies in the Indian market, whose business operations are spread across the country and abroad. Their different business strategies, focus on technology and future direction make them different from each other.

    In this blog, we will analyze both these companies in-depth including their business model, financial health, expansion plans and market performance to help you understand which company is a better investment option.

    Company Overview – Apollo Tyres Ltd

    Apollo Tyres Ltd. was established in 1972 and today it is counted among the leading tyre companies in India. The company’s headquarters is located in Gurugram, Haryana. Over the past five decades, Apollo has established a strong presence in the domestic market as well as the global market. Its growth can be gauged from the fact that its products are now sold in more than 100 countries.

    • Manufacturing and International Network : Apollo has several modern manufacturing facilities in India, such as plants located in Chennai, Limbda (Gujarat), and Andhra Pradesh. Apart from this, the company also has manufacturing units in the Netherlands and Hungary. Thus, this Indian company has now become a global tyre manufacturer. The company’s strong supply chain and technology innovation help it in its global competitiveness.
    • Product Portfolio and Segments : Apollo Tyres manufactures tyres for passenger cars, SUVs, trucks, buses, light commercial vehicles and two-wheelers. In India, it operates under the brand name “Apollo”, while in Europe it has its presence under the name “Vredestein”. The company maintains a balanced focus on mileage, performance, and safety.
    • Business Model and Partnerships : Apollo Tyres’ business model is based on three major channels – OEM (such as Tata, Mahindra, and Ashok Leyland), replacement market, and international exports. The company is also continuously working on tyres for EVs and high performance vehicles.

    Apollo Tyres Ltd. has established itself as an innovative and globally competitive brand in the Indian automobile industry. Its strong manufacturing capabilities, international expansion, and product diversity allow it to grow even stronger in the years to come.

    Company Overview – Ceat Ltd.

    Ceat Ltd. was founded in 1958 with roots in Italy but was later established in India and is now part of the RPG Group. The company initially manufactured tyres for commercial vehicles but over time also started manufacturing tyres for two-wheelers, passenger vehicles, agricultural and industrial vehicles. Today, Ceat is among the top tyre companies in India and is constantly expanding its portfolio.

    • Global Positioning and Production Capacity : Ceat tyres operations are no longer limited to India. The company exports its products to over 110 countries. Its major manufacturing plants in India are located in Nashik, Halol, Nagpur and Chennai. In recent years, the company has prioritised EV tyre manufacturing at the Nagpur unit, reflecting its future-focused vision.
    • Key Businesses and Services : Ceat manufactures tyres across various segments such as two-wheelers, cars, SUVs, trucks, buses and three-wheelers. Apart from this, the company also designs tyres for farm equipment and off-road vehicles. The brand identity is based on the balance of mileage, safety and performance. The company actively operates in both OEM and replacement markets.
    • Business Model and Market Approach : Ceat sells its tyres through three main channels: OEM (to auto companies), replacement (to customers), and export. It is also a supplier to prominent automobile companies like Bajaj Auto, Hero MotoCorp, Tata Motors and Mahindra. The company is now focusing on tyre technology for EV vehicles as well.

    Ceat Ltd. has built an image of a trusted tyre brand keeping in mind the needs of Indian roads and consumers. Its production capacity, investment in technology and diversified product range make it ready for future demands.

    Read Also: Mahindra & Mahindra vs Tata Motors: Which is Better?

    Comparative Analysis: Apollo Tyres Ltd. vs Ceat Ltd

    ParticularsApollo Tyres LtdCeat Ltd
    Current Price (₹)4703,792
    Market Cap (₹ Crores)29,85015,339
    52-W High (₹)5854,044
    52-W Low (₹)3682,322
    FII Holdings as of March 202513.43%15.27%
    DII Holdings (as of March 2025)28.09%21.52%
    Book Value (₹)2321,080
    PE Ratio2431.1
    (Data as of 9 June 2025)

    Financial Statements Analysis

    Income Statement Comparison

    ParticularsApollo Tyres LtdCeat Ltd
    Total Income26,21113,235
    Total Expenses24,21812,336
    EBIT1,992899
    Net Profit1,120449
    (All values are in INR crores and the data is as of March 2025)

    Balance Sheet Comparison 

    ParticularsApollo Tyres LtdCeat Ltd
    Current Liabilities7,3605,164
    Current Assets9,8153,432
    Reserves & Surplus14,7024,328
    (All values are in INR crores and the data is as of March 2025)

    Cash Flow Statement Comparison

    ParticularsApollo Tyres LtdCeat Ltd
    Cash Flow from Operating Activities1,8231,091
    Cash Flow from Investing Activities-202-922
    Cash Flow from Financing Activities-1,646-176
    (All values are in INR crores and the data is as of March 2025)

    Key Performance Ratios (KPIs)

    ParticularsApollo Tyres LtdCeat Ltd
    Operating Profit Margin (%)8.277.02
    Net Profit Margin (%)4.283.40
    ROE (%)7.5910.81
    ROCE (%)10.8315.36
    Debt to Equity (x)0.230.44
    (Data as of March 2025)

    Read Also: MRF vs Apollo Tyres: Which is Better?

    Future Plans – Apollo Tyres Ltd. vs Ceat Ltd.

    Apollo Tyres Ltd.

    • Target of $5 billion revenue and 15%+ EBITDA margin by FY26 : Apollo Tyres aims to achieve $5 billion (approximately ₹41,500 crores) revenue and over 15% EBITDA margin by FY 2025-26. For this, the company has focused on five key areas: sustainable growth, digitalization, technology innovation, human resource development, and brand building.
    • Target to use 40% sustainable materials by 2030 : Apollo Tyres has set a target to use 40% sustainable materials in its tyres by 2030. The company has recently developed tyres made from 75% sustainable materials, which are now in the testing phase.
    • Improving production efficiency through digital innovation centers : Apollo Tyres has set up digital innovation centers in Hyderabad and London, which are improving production efficiency using technologies such as AI, machine learning, IoT, and cloud computing.
    • Targeting $500 million sales in the US : Apollo Tyres is currently doing sales of $120-130 million in the US and plans to increase this to $500 million.

    Ceat Ltd.

    • Target to double export revenue to ₹4,000 crore by FY26 : Ceat Ltd. aims to double its export revenue to ₹4,000 crore by FY 2025-26, with a special focus on expansion in the car and truck tyre segment.
    • Leading position in the EV two-wheeler tyre segment : Ceat Ltd. has partnered with companies like Ather Energy in the EV two-wheeler tyre segment, giving it a strong presence in EV segment.
    • Capital expenditure of ₹1,000 crore in FY25 : Ceat Ltd. has set aside ₹1,000 crore for capital expenditure in FY 25, focused on capacity expansion at its Chennai and Ambarnath plants.
    • ₹72.67 crore investment for EPR compliance in FY24 : Ceat Ltd. has invested ₹72.67 crore in FY 2023-24 under EPR (Extended Producer Responsibility) compliance and introduced eco-friendly tyres.

    Who is better: Apollo Tyres or Ceat Ltd.?

    Apollo Tyres and Ceat Ltd.both have their own strengths. Apollo is currently focused on innovation, sustainability and international growth. The company is working rapidly on strengthening its foothold in the US and adopting the latest technology.

    On the other hand, Ceat is focused on the EV tyre segment, where it is already a leading supplier to EV manufacturers Ather. Also, the company is preparing to double its exports and is also increasing production capacity.

    Both companies are moving in slightly different directions, and are adopting different strategies to solidify their market position. It is hard to say which one is better and you must thoroughly analyze both companies or consult a financial advisor before investing.

    Conclusion 

    Apollo Tyres and Ceat Ltd. have both established themselves as a strong player in the tyre industry in their own ways. Apollo is expanding itself in the international market, while Ceat is focusing on electric vehicles and exports. Each company has a different business strategy, however both are trying to gain a better foothold in the tyre market. It is advised to consult a financial advisor before investing.

    S.NO.Check Out These Interesting Posts You Might Enjoy!
    1Bajaj Finserv and Bajaj Finance: Which is Better?
    2BHEL vs BEL -Best Defence and Manufacturing Sector Stocks
    3Asian Paints vs Berger Paints – Which is Better?
    4Maruti Suzuki India Vs Hyundai: Which Car Stock is Better?
    5Devyani International Vs Sapphire Foods – Which is Better?

    Frequently Asked Questions (FAQs)

    1. Which company is older: Apollo Tyres or Ceat Ltd.?

      Ceat Ltd. was established in 1958 while Apollo Tyres was started in 1972.

    2. Is Apollo Tyres a global brand?

      Yes, Apollo Tyres products are present in many countries including Europe and the USA.

    3. Does Ceat make tyres for electric vehicles?

      Yes, Ceat manufactures tyres especially designed for EV two-wheelers and supplies to many big companies.

    4. Which company has a higher export focus?

      Both the companies have export operations, but currently Ceat has set an ambitious target to double its export revenues.

    5. Is Apollo Tyres investing in sustainability?

      Yes, Apollo plans to use 40% sustainable materials in its tyres by 2030.

  • Bajaj Finserv and Bajaj Finance: Which is Better?

    Bajaj Finserv and Bajaj Finance: Which is Better?

    You may have come across Bajaj Finance and Bajaj Finserv if you have searched for loans, insurance or investment options on the internet. They both seem alike, belong to the same group and are commonly found in similar web searches, but they aren’t the same.

    So what exactly is the difference, and if you’re a customer or an investor, which one should you be looking at?

    In this blog, we’ll explain everything in a simple way about each company and which one might be a better fit for your portfolio. Whether you’re trying to understand whom to approach for a loan or deciding which stock to invest in, this guide is here to make it easy.

    Bajaj Finserv – Company Overview 

    Bajaj Finserv Limited is one of India’s leading financial services companies. It operates across a wide range of financial segments, including:

    • Consumer finance (like personal loans, home loans, EMI cards offered through subsidiaries)
    • Insurance (life and general)
    • Asset management
    • Wealth management
    • Mutual funds
    • Digital payments and more

    It’s known for its quick loan approvals, flexible EMIs, and strong digital presence that makes borrowing or investing super convenient for individuals and businesses alike.

    The company has its headquarters in Pune, Maharashtra and was founded in 2007 and is currently headed by chairman, Sanjiv Bajaj. The parent group is the Bajaj Group, which was founded by Jamnalal Bajaj in 1926. 

    Important Milestones 

    • From 2008 to 2012: Bajaj Finance grew rapidly by offering consumer durable loans on easy EMIs, one of the first of its kind in India.
    • From 2013 to 2017: Expanded into personal loans, business loans, and housing finance.
    • 2018: Bajaj Finserv crossed major growth thresholds as loan disbursements increased substantially and the assets under management crossed ₹1 lakh crore, with a combined customer base of 25 million.
    • 2020–2022: Entered the digital payments space and launched Bajaj Finserv Wallet, Bajaj Finserv Health, and focused on building a digital ecosystem.
    • 2023: Announced foray into mutual funds under the Bajaj Finserv Mutual Fund brand.

    Bajaj Finance – Company Overview 

    Bajaj Finance Limited is one of India’s top non-banking financial companies (NBFCs). It offers a wide range of financial products and services, including:

    • Consumer durable loans (like TVs, mobiles, appliances on EMI)
    • Personal loans
    • Home loans
    • Business loans
    • Credit cards 
    • Fixed deposits and investment products

    The brand is recognised for offering No Cost EMI on various products, including gadgets, furniture, travel, etc., which is readily available at many partner stores and online platforms.

    The business is headquartered in Pune, Maharashtra and started operations as Bajaj Auto Finance Limited in 1987. Interestingly, Bajaj Finance is a subsidiary of Bajaj Finserv.

    Important Milestones 

    • In 2007, Bajaj Auto underwent a corporate demerger. Its financial services arm became a separate entity, Bajaj Finserv Limited, and Bajaj Auto Finance was rebranded as Bajaj Finance Limited.
    • Rajeev Jain was the CEO, marking the beginning of a significant transformation.
    • Focus shifted from just auto finance to consumer lending, SME lending, and commercial lending.

    From 2010 to 2020

    • Introduced EMI cards, allowing customers to shop for electronics, furniture, and appliances on easy instalments.
    • Rapidly expanded into digital lending, e-commerce finance, and partnerships with retailers and brands. 
    • Built a wide offline and online network, facilitating extremely fast and hassle-free loan disbursals.

    From 2020–Present

    • Launched the Bajaj Finserv App for digital financial solutions.
    • Stepped into the digital payments ecosystem with digital wallets and co-branded credit cards.
    • Leveraged AI, data analytics, and cloud technology for personalised financial services.
    • Despite market challenges like COVID-19, it bounced back strongly with innovative financial products and digital-first strategies.

    Read Also: Bajaj Finance Case Study: Business Model, Financials, Competitors, and KPIs

    Comparative Study of Bajaj Finserv and Bajaj Finance

    PARTICULARSBAJAJ FINSERVBAJAJ FINANCE
    Current Price (₹)1,9568,945
    Market Cap (₹ Crore)3,12,5325,55,868
    52-W High (₹)2,1359,710
    52-W Low (₹)1,5116,425
    FII Holdings as of March 20257.19%18.91%
    DII Holdings as of March 20259.34%17.42%
    Book Value (₹)4531,556
    PE Ratio (₹)35.233.4
    As of 6 June 2025

    Financial Statements Comparison

    PROFIT & LOSS STATEMENT

    ParticularsBAJAJ FINSERVBAJAJ FINANCE
    Total Income1,33,82169,724
    Expenses85,78222,892
    Net Profit17,53916,761
    (All values are in INR crores and the data is as of March 2025)
    Bajaj Finserv and Bajaj Finance

    BALANCE SHEET

    ParticularsBAJAJ FINSERVBAJAJ FINANCE
    Current Liabilities5,16,7453,66,042
    Current Assets6,41,6394,60,437
    Reserves & Surplus72,23596,568
    (All values are in INR crores and the data is as of March 2025)
    Bajaj Finserv and Bajaj Finance

    CASH FLOW STATEMENTS

    ParticularsBAJAJ FINSERVBAJAJ FINANCE
    Cash Flow from Operating Activities-62,113-68,154
    Cash Flow from Investing Activities-7,986-2,765
    Cash Flow from Financing Activities70,19170,527
    (All values are in INR crores and the data is as of March 2025)

    Inference

    Bajaj Finserv has about ₹1.3 Lakh crore in revenues, which also includes revenues from its stake in Bajaj Finance. This approach reduces dependence on lending alone and promotes a more balanced portfolio. On the contrary, Bajaj Finance reported an impressive profit of ₹16,761 crore. Additionally, the company’s AUM surged past ₹3 lakh crore. 

    Read Also: Bajaj Housing Finance IPO Case Study: Products, Financials, And SWOT Analysis

    Key Performance Indicators (KPIs)

    ParticularsBAJAJ FINSERVBAJAJ FINANCE
    Basic EPS (₹)55.60268.94
    Operating Profit Margin (%)35.8967.20
    Net Profit Margin (%)13.1024.05
    Return on Capital Employed (%)35.4546.79
    Return on Equity (%)12.2517.20
    Debt-to-Equity (x)1.823.74
    (Data as of March 2025)

    Which Company Is Better? 

    You can base your investment decision based on the following points:

    • If you want to invest specifically in the lending business, go for Bajaj Finance.
    • If you want diversified exposure (loans, insurance, mutual funds, etc.), then Bajaj Finserv is a better long-term pick.

    However, it is advised to analyse the company’s financial statements and future business plans before investing. You should also consult a financial advisor to make an informed investment decision. 

    Read Also: Bajaj Auto Case Study: Business Model, Product Portfolio, and SWOT Analysis

    Conclusion 

    Ultimately, Bajaj Finance and Bajaj Finserv are two sides of the same coin, closely connected, but established for different purposes. If you’re a customer looking for loans, EMIs, credit cards, or fixed deposits, Bajaj Finance is the brand you’ll be dealing with. It’s fast, efficient, and focused on direct financial services. But if you’re an investor thinking long-term and want a slice of the entire financial services, from lending to insurance to digital solutions, then Bajaj Finserv gives you a more diversified exposure as the parent company. So, the “better” company depends on what you’re looking for. Whichever company you choose, one thing’s for sure that both companies have established a strong reputation in India’s financial services industry.

    S.NO.Check Out These Interesting Posts You Might Enjoy!
    1Jio Financial Services: Business Model And SWOT Analysis
    2AU Small Finance Bank Case Study: Services, Performance, Financials, and SWOT Analysis.
    3Hindustan Unilever Case Study: Business Model, Financials, and SWOT Analysis
    4HDFC Bank Case Study: Business Model, Financial Highlights, and SWOT Analysis
    5Bandhan Bank Case Study: Business Model, Financial Statement, SWOT Analysis

    Frequently Asked Questions (FAQs)

    1. Are Bajaj Finance and Bajaj Finserv the same company?

      No, they’re not the same, but they’re related. Bajaj Finance is a subsidiary of Bajaj Finserv.

    2. Which company gives loans, Bajaj Finance or Bajaj Finserv?

      Bajaj Finance offers loans, EMIs, credit cards, and deposits. Bajaj Finserv does not directly give loans.

    3. Is Bajaj Finance safe for FDs?

      Yes, Bajaj Finance has high credit ratings (CRISIL AAA/Stable & ICRA AAA/Stable), making it a reliable FD option.Q4. Which company has more profits?

    4. Which company has more profits?

      Bajaj Finserv has marginally higher profits than Bajaj Finance, but it must be taken into consideration that Bajaj Finance is the subsidiary of Bajaj Finserv due to which a proportion of profits earned by Bajaj Finance is also reflected in profits of Bajaj Finserv.

    5. Is Bajaj Finserv a bank?

      No! It’s a non-banking financial holding company. It owns stakes in other businesses dealing in finance, insurance, and wealth management.

  • Open Free Demat Account

    Join Pocketful Now

    You have successfully subscribed to the newsletter

    There was an error while trying to send your request. Please try again.

    Pocketful blog will use the information you provide on this form to be in touch with you and to provide updates and marketing.