You may have come across Bajaj Finance and Bajaj Finserv if you have searched for loans, insurance or investment options on the internet. They both seem alike, belong to the same group and are commonly found in similar web searches, but they aren’t the same.
So what exactly is the difference, and if you’re a customer or an investor, which one should you be looking at?
In this blog, we’ll explain everything in a simple way about each company and which one might be a better fit for your portfolio. Whether you’re trying to understand whom to approach for a loan or deciding which stock to invest in, this guide is here to make it easy.
Bajaj Finserv – Company Overview
Bajaj Finserv Limited is one of India’s leading financial services companies. It operates across a wide range of financial segments, including:
- Consumer finance (like personal loans, home loans, EMI cards offered through subsidiaries)
- Insurance (life and general)
- Asset management
- Wealth management
- Mutual funds
- Digital payments and more
It’s known for its quick loan approvals, flexible EMIs, and strong digital presence that makes borrowing or investing super convenient for individuals and businesses alike.
The company has its headquarters in Pune, Maharashtra and was founded in 2007 and is currently headed by chairman, Sanjiv Bajaj. The parent group is the Bajaj Group, which was founded by Jamnalal Bajaj in 1926.
Important Milestones
- From 2008 to 2012: Bajaj Finance grew rapidly by offering consumer durable loans on easy EMIs, one of the first of its kind in India.
- From 2013 to 2017: Expanded into personal loans, business loans, and housing finance.
- 2018: Bajaj Finserv crossed major growth thresholds as loan disbursements increased substantially and the assets under management crossed ₹1 lakh crore, with a combined customer base of 25 million.
- 2020–2022: Entered the digital payments space and launched Bajaj Finserv Wallet, Bajaj Finserv Health, and focused on building a digital ecosystem.
- 2023: Announced foray into mutual funds under the Bajaj Finserv Mutual Fund brand.
Bajaj Finance – Company Overview
Bajaj Finance Limited is one of India’s top non-banking financial companies (NBFCs). It offers a wide range of financial products and services, including:
- Consumer durable loans (like TVs, mobiles, appliances on EMI)
- Personal loans
- Home loans
- Business loans
- Credit cards
- Fixed deposits and investment products
The brand is recognised for offering No Cost EMI on various products, including gadgets, furniture, travel, etc., which is readily available at many partner stores and online platforms.
The business is headquartered in Pune, Maharashtra and started operations as Bajaj Auto Finance Limited in 1987. Interestingly, Bajaj Finance is a subsidiary of Bajaj Finserv.
Important Milestones
- In 2007, Bajaj Auto underwent a corporate demerger. Its financial services arm became a separate entity, Bajaj Finserv Limited, and Bajaj Auto Finance was rebranded as Bajaj Finance Limited.
- Rajeev Jain was the CEO, marking the beginning of a significant transformation.
- Focus shifted from just auto finance to consumer lending, SME lending, and commercial lending.
From 2010 to 2020
- Introduced EMI cards, allowing customers to shop for electronics, furniture, and appliances on easy instalments.
- Rapidly expanded into digital lending, e-commerce finance, and partnerships with retailers and brands.
- Built a wide offline and online network, facilitating extremely fast and hassle-free loan disbursals.
From 2020–Present
- Launched the Bajaj Finserv App for digital financial solutions.
- Stepped into the digital payments ecosystem with digital wallets and co-branded credit cards.
- Leveraged AI, data analytics, and cloud technology for personalised financial services.
- Despite market challenges like COVID-19, it bounced back strongly with innovative financial products and digital-first strategies.
Read Also: Bajaj Finance Case Study: Business Model, Financials, Competitors, and KPIs
Comparative Study of Bajaj Finserv and Bajaj Finance
| PARTICULARS | BAJAJ FINSERV | BAJAJ FINANCE |
|---|---|---|
| Current Price (₹) | 1,956 | 8,945 |
| Market Cap (₹ Crore) | 3,12,532 | 5,55,868 |
| 52-W High (₹) | 2,135 | 9,710 |
| 52-W Low (₹) | 1,511 | 6,425 |
| FII Holdings as of March 2025 | 7.19% | 18.91% |
| DII Holdings as of March 2025 | 9.34% | 17.42% |
| Book Value (₹) | 453 | 1,556 |
| PE Ratio (₹) | 35.2 | 33.4 |
Financial Statements Comparison
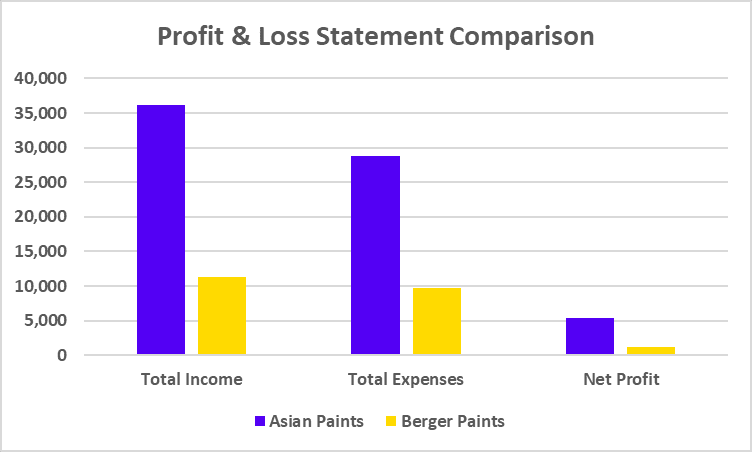
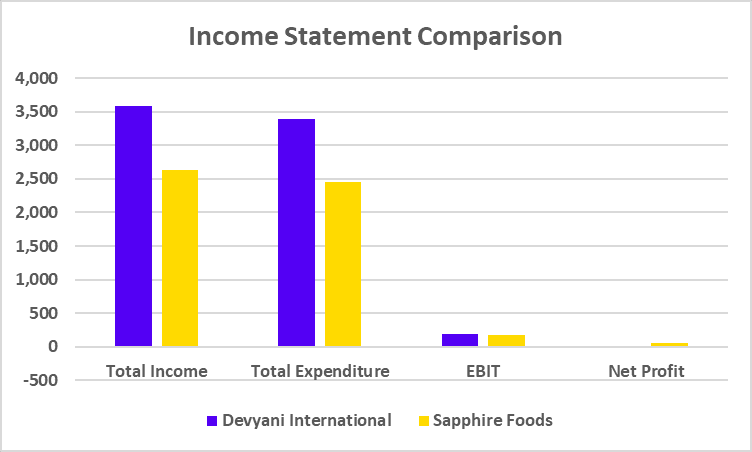
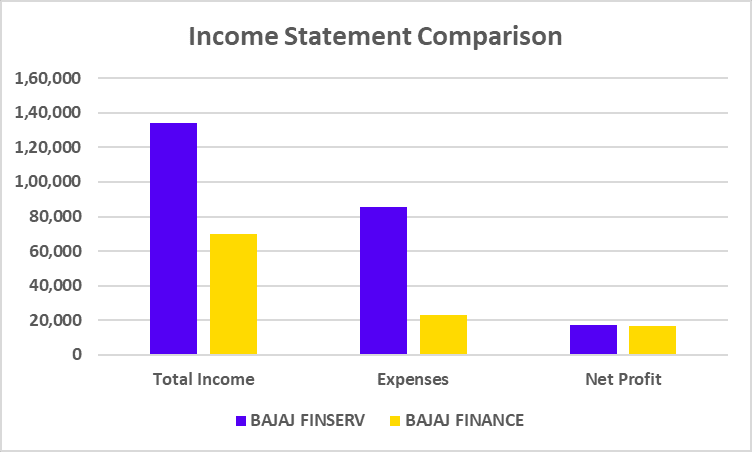
PROFIT & LOSS STATEMENT
| Particulars | BAJAJ FINSERV | BAJAJ FINANCE |
|---|---|---|
| Total Income | 1,33,821 | 69,724 |
| Expenses | 85,782 | 22,892 |
| Net Profit | 17,539 | 16,761 |
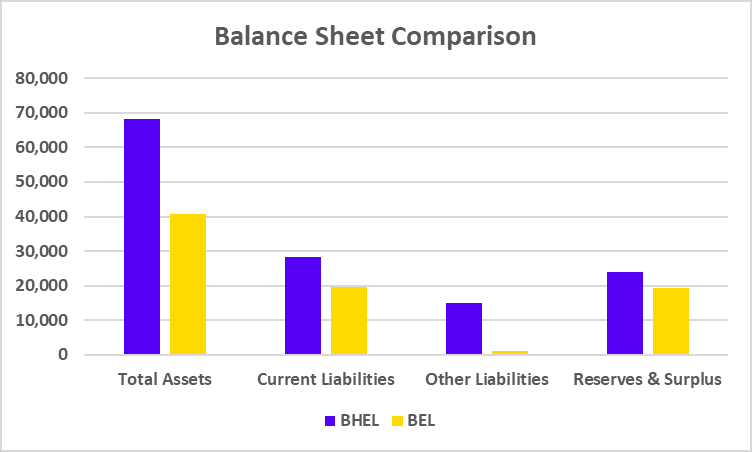
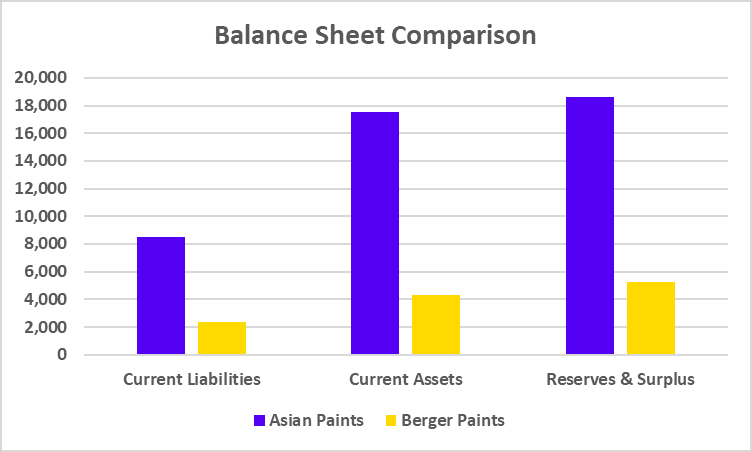
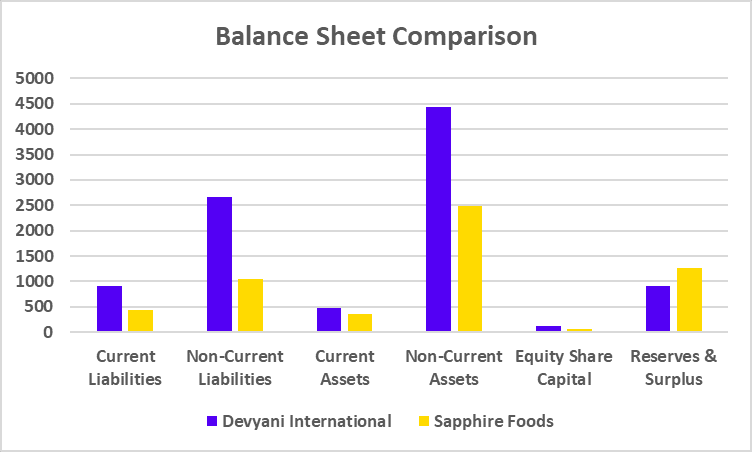
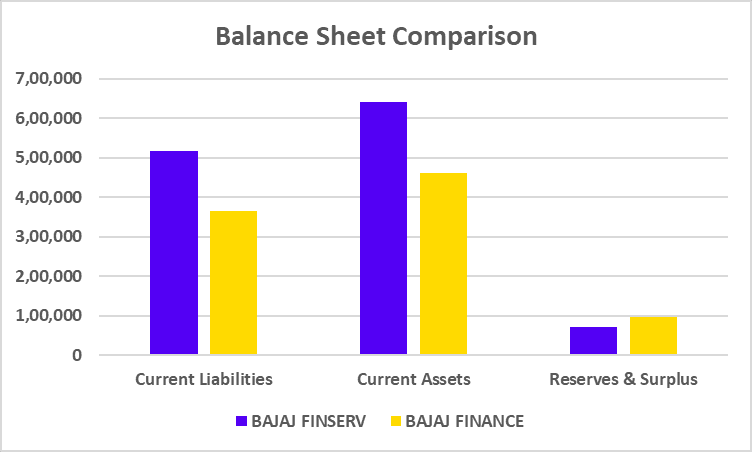
BALANCE SHEET
| Particulars | BAJAJ FINSERV | BAJAJ FINANCE |
|---|---|---|
| Current Liabilities | 5,16,745 | 3,66,042 |
| Current Assets | 6,41,639 | 4,60,437 |
| Reserves & Surplus | 72,235 | 96,568 |
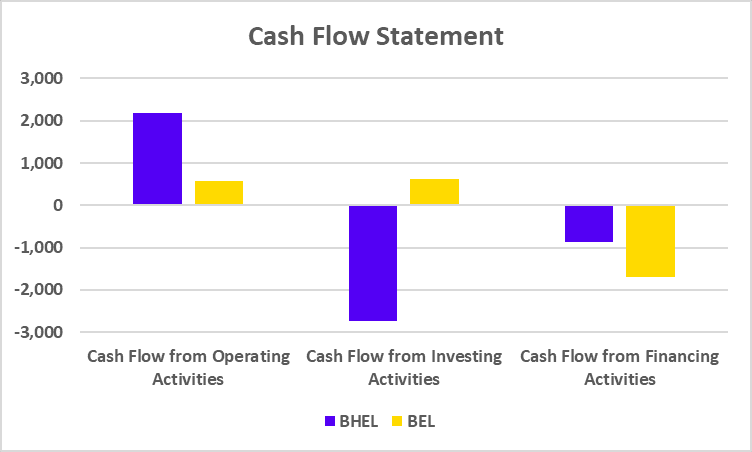
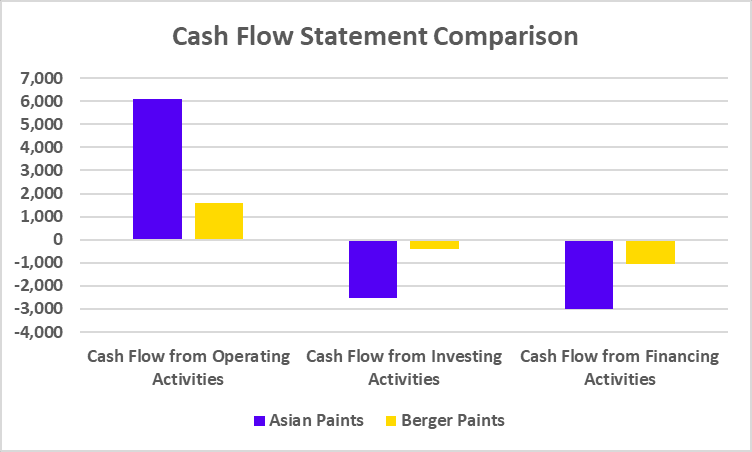
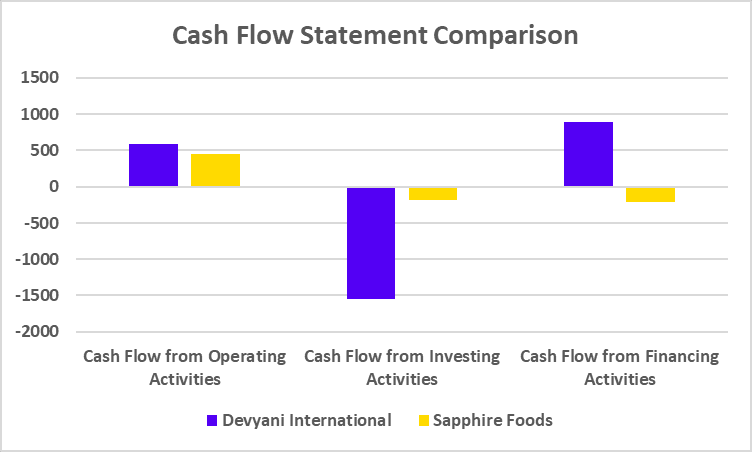
CASH FLOW STATEMENTS
| Particulars | BAJAJ FINSERV | BAJAJ FINANCE |
|---|---|---|
| Cash Flow from Operating Activities | -62,113 | -68,154 |
| Cash Flow from Investing Activities | -7,986 | -2,765 |
| Cash Flow from Financing Activities | 70,191 | 70,527 |
Inference
Bajaj Finserv has about ₹1.3 Lakh crore in revenues, which also includes revenues from its stake in Bajaj Finance. This approach reduces dependence on lending alone and promotes a more balanced portfolio. On the contrary, Bajaj Finance reported an impressive profit of ₹16,761 crore. Additionally, the company’s AUM surged past ₹3 lakh crore.
Read Also: Bajaj Housing Finance IPO Case Study: Products, Financials, And SWOT Analysis
Key Performance Indicators (KPIs)
| Particulars | BAJAJ FINSERV | BAJAJ FINANCE |
|---|---|---|
| Basic EPS (₹) | 55.60 | 268.94 |
| Operating Profit Margin (%) | 35.89 | 67.20 |
| Net Profit Margin (%) | 13.10 | 24.05 |
| Return on Capital Employed (%) | 35.45 | 46.79 |
| Return on Equity (%) | 12.25 | 17.20 |
| Debt-to-Equity (x) | 1.82 | 3.74 |
Which Company Is Better?
You can base your investment decision based on the following points:
- If you want to invest specifically in the lending business, go for Bajaj Finance.
- If you want diversified exposure (loans, insurance, mutual funds, etc.), then Bajaj Finserv is a better long-term pick.
However, it is advised to analyse the company’s financial statements and future business plans before investing. You should also consult a financial advisor to make an informed investment decision.
Read Also: Bajaj Auto Case Study: Business Model, Product Portfolio, and SWOT Analysis
Conclusion
Ultimately, Bajaj Finance and Bajaj Finserv are two sides of the same coin, closely connected, but established for different purposes. If you’re a customer looking for loans, EMIs, credit cards, or fixed deposits, Bajaj Finance is the brand you’ll be dealing with. It’s fast, efficient, and focused on direct financial services. But if you’re an investor thinking long-term and want a slice of the entire financial services, from lending to insurance to digital solutions, then Bajaj Finserv gives you a more diversified exposure as the parent company. So, the “better” company depends on what you’re looking for. Whichever company you choose, one thing’s for sure that both companies have established a strong reputation in India’s financial services industry.
Frequently Asked Questions (FAQs)
Are Bajaj Finance and Bajaj Finserv the same company?
No, they’re not the same, but they’re related. Bajaj Finance is a subsidiary of Bajaj Finserv.
Which company gives loans, Bajaj Finance or Bajaj Finserv?
Bajaj Finance offers loans, EMIs, credit cards, and deposits. Bajaj Finserv does not directly give loans.
Is Bajaj Finance safe for FDs?
Yes, Bajaj Finance has high credit ratings (CRISIL AAA/Stable & ICRA AAA/Stable), making it a reliable FD option.Q4. Which company has more profits?
Which company has more profits?
Bajaj Finserv has marginally higher profits than Bajaj Finance, but it must be taken into consideration that Bajaj Finance is the subsidiary of Bajaj Finserv due to which a proportion of profits earned by Bajaj Finance is also reflected in profits of Bajaj Finserv.
Is Bajaj Finserv a bank?
No! It’s a non-banking financial holding company. It owns stakes in other businesses dealing in finance, insurance, and wealth management.