India’s electric vehicle revolution makes up a vital component of the country’s journey towards zero carbon emissions. The EV movement started when companies Gensol Engineering and BluSmart Mobility introduced their plans for sustainable technology-based zero-emission cab rides in the metro cities of India.
Who knew that the clean-technology ecosystem of India would face substantial damage because of financial mismanagement, alongside fund diversion and regulatory misconduct discovered behind its eco-friendly exterior?
This blog explores the BluSmart-Gensol scam, along with the resulting consequences and its implications on India’s electric vehicle industry.
Background on Gensol Engineering & BluSmart
Gensol Engineering: Founded in 2007 and based in Ahmedabad, Gensol Engineering Limited focuses on delivering integrated solar energy solutions. They offer services like engineering, procurement, and construction for solar projects. They also provide technical consultancy and carbon credit advisory services.
In recent years, Gensol has ventured into electric vehicle manufacturing and leasing to deliver clean energy transportation solutions.
BluSmart Mobility: Back in 2019, Anmol Singh Jaggi, Puneet Singh Jaggi and Puneet K Goyal came together to start BluSmart Mobility. It was established as India’s first ride-hailing service that was completely electric.
The company operates mainly in urban hubs such as Delhi NCR, Mumbai, and Bangalore, and provides a fleet of electric vehicles that promote zero-emission transportation solutions. It also got attention from big players like BP Ventures and ResponsAbility Investments, who decided to invest in it. The company also collaborated with Tata Motors and Tata Power for buying 10,000 EVs and development of electric charging infrastructure respectively.
How are BluSmart & Gensol Related?
The business operations of Gensol Engineering and BluSmart Mobility were closely-connected to each other. Here is how they are related;
- Anmol Singh Jaggi plays an important role in both companies, i.e., he is the managing director of Gensol Engineering and a Co-founder of BluSmart Mobility. His brother, Puneet Singh Jaggi, is also a key management personnel in both companies.
- Gensol Engineering offered financial backing and essential infrastructure for BluSmart’s operations.
- Gensol provided electric vehicles and the technology setup that BluSmart needed for operating their fleet of EVs. BluSmart’s operations relied significantly on Gensol for both vehicle procurement and maintenance.
Timeline of the Gensol-BluSmart Scam
SEBI conducted a forensic investigation in April 2025 that revealed a multi-crore financial scam triggered by the promoters of Gensol Engineering through improper EV financing, which affected BluSmart Mobility’s business operations directly. Gensol presented itself as an innovative ESG-centric company until its fraudulent actions became widely known, thereby creating doubt on sector governance and regulatory scrutiny practices in India.
The timeline of the scam is as follows:
1. Loans Taken for the Procurement of EV
Gensol took out a loan of ₹978 crore from different lenders, two of which were government-backed IREDA and PFC. The money was supposed to be used to buy electric cars and lease them to BlueSmart Mobility.
2. Diversion of Funds
Rather than being allocated for the purchase of electric vehicles, a major portion of the funds was redirected to buying luxury real estate, personal expenses unrelated to business activities, and only a fraction of the EVs were procured.
3. Layering & Cover-Ups
The money trail was deliberately concealed using a network of shell companies and a series of intercompany transactions.
BluSmart made it look like they had more leased electric vehicles than they did, probably to bring in more investments.
Read Also: Scam 1992: Harshad Mehta Scam Story
How Was The Scam Uncovered?
A detailed timeline about how the scam came to light is mentioned below:
1. On March 3 and 4, 2025, the credit rating agencies Care Rating Limited and ICRA Ltd. decided to lower the credit ratings they gave for the company’s loans and credit options. They dropped the ratings to ‘D’, the lowest rating possible because the company was behind on its debt payments.
2. ICRA stated that documents shared by Gensol regarding its debt servicing were falsified, raising concerns about its corporate governance and liquidity position.
3. On March 5, 2025, Gensol put out an investor release on the stock exchange, and it was signed by their CEO, Anmol Singh Jaggi. In this release, the company clarified that it had no involvement in the falsification claims made by the rating agencies.
4. SEBI then asked the credit rating agencies for information about the downgrade of the ratings given to Gensol.
5. The CRAs mentioned that, based on recent news about BluSmart Mobility (which is connected to Gensol) defaulting on bond payments on February 24, 2025. This kicked off a review of the ratings assigned to the instruments of Gensol.
6. The CRAs mentioned that when they asked for the term loan statements, Gensol gave them statements from all the lenders except for the IREDA and PFC. However, Gensol shared some conduct letters that supposedly came from these two companies. These letters mentioned that Gensol has been keeping up with its loan payments.
7. CARE mentioned that Gensol asked to take back the ratings that were given to them. To back this up, Gensol provided a no-objection certificate that they claimed was issued by their lenders.
8. However, after checking with IREDA and PFC about the conduct letters and NOCs, both lenders denied issuing such letters. SEBI then requested detailed information from the lenders about the debt service status of loans granted to Gensol, including loan sanction letters and account statements.
9. After looking over the details from the lenders mentioned, it was noticed that the company has had several instances where it did not keep up with the loan payments.
10. It was noted that out of ₹ 977.75 crores taken as loan by the company from IREDA and PFC as term loans, ₹663.89 crores was for buying 6,400 electric vehicles.
11. In its response, Gensol admitted that it had acquired only 4,704 electric vehicles, falling short of the 6,400 EVs for which it had previously obtained funding. Additionally, Go-Auto Private Limited confirmed that it sold 4,704 EVs to the company for a total of ₹567.73 crores. After this, the financial statements of both companies were examined. Upon examination, it was observed the company has also availed the additional equity contribution of 20%, taking their total loan amount to ₹829.86 crores. Based on these figures, the company only used ₹567.73 crores out of ₹829.86 crores, which shows ₹262.13 crores of funds unaccounted for.
12. The analysis revealed that after the money was sent from Gensol to Go-Auto to buy electric vehicles, it often ended up with Gensol or was sent to companies linked to Anmol Singh Jaggi and Puneet Singh Jaggi, who are the promoters and directors of Gensol, which was later used for unrelated expenses.
13. The promoters of Gensol used funds to buy a luxury apartment in the Camellias, DLF, Gurgaon. This was achieved through layered transactions, and the apartment is owned by a firm named Capbridge Ventures LLP, whose designated partners are Anmol Singh Jaggi and Puneet Singh Jaggi.
14. Looking at how Gensol used the loans they got from the lenders, SEBI concluded that the company did not handle the funds properly and barred the company’s promoters from securities markets and from holding any key position in any listed company.
Read Also: Satyam Scam Case Study: Know The Story Indians
Impact of Gensol-BluSmart Scam on Stakeholders
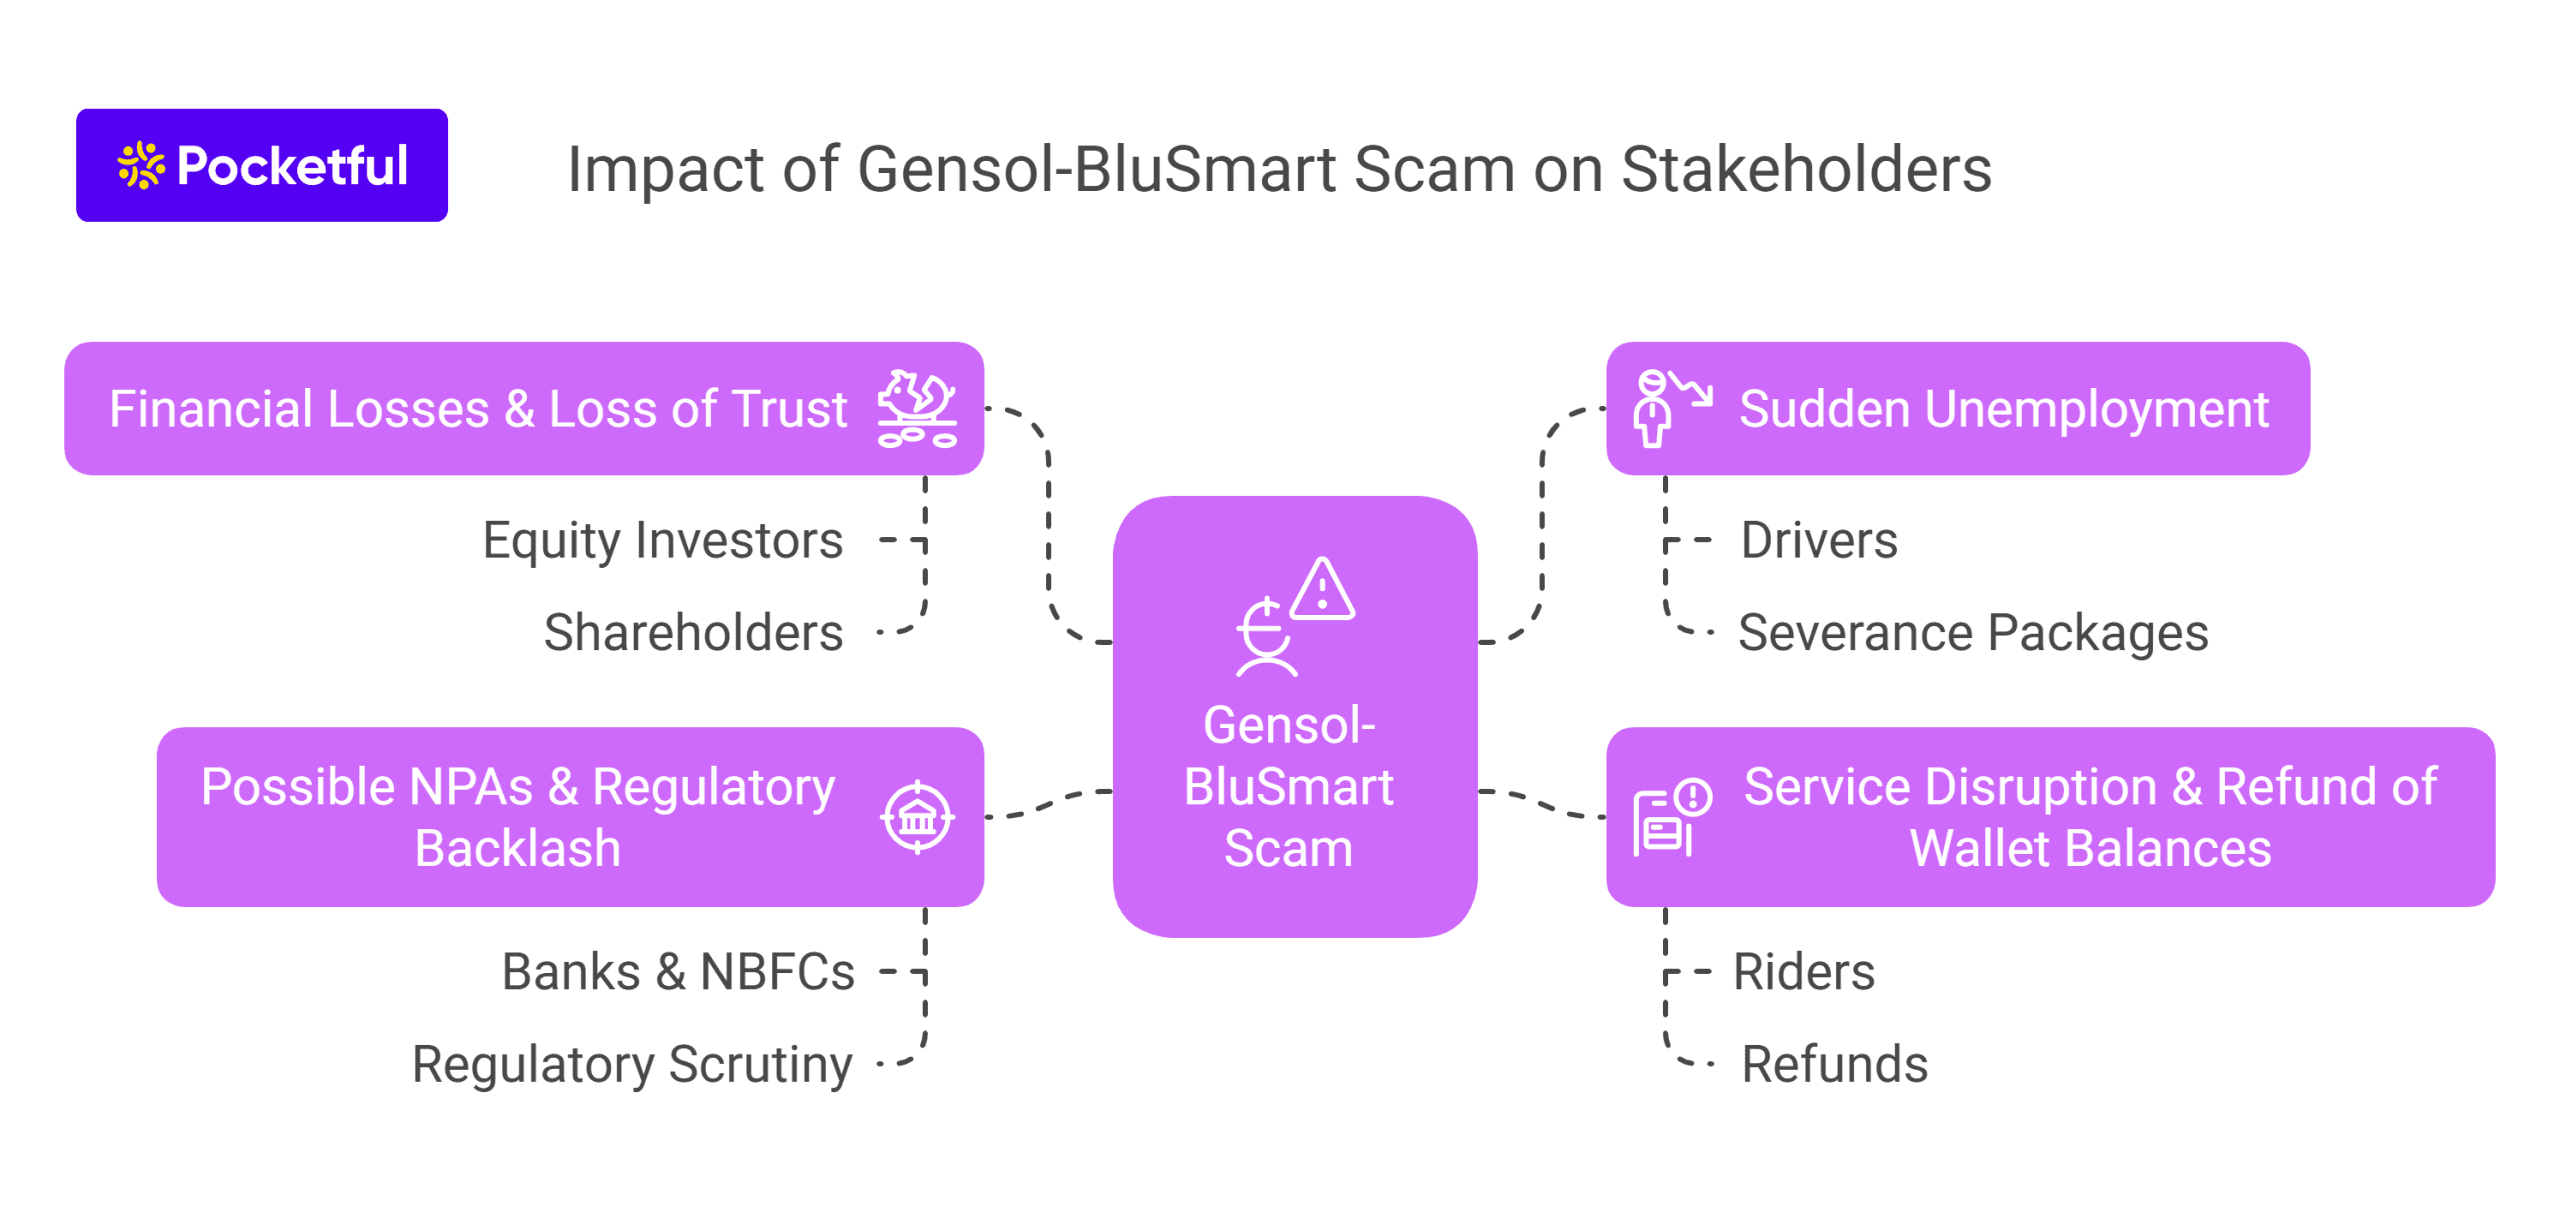
The impact of the Gensol-BluSmart scam on stakeholders is mentioned below:
1. Financial Losses & Loss of Trust
Equity Investors, like BP Ventures and responsAbility, took some big hits on their valuations. Gensol’s stock price fell, causing significant losses for shareholders. Venture capital firms are taking a fresh look at how they can better evaluate green energy startups in India.
2. Sudden Unemployment
Thousands of drivers suddenly found themselves without jobs when BluSmart decided to halt its operations. There has been no clear information on severance packages, any outstanding bonuses, or if they are planning to take back the vehicles. A lot of drivers were dependent on their jobs to pay loans or support their families.
3. Service Disruption & Refund of Wallet Balances
Riders with prepaid credits in their BluSmart wallet accounts experienced a complete service outage. The company has pledged to issue refunds within 90 days; however, trust has been eroded. People are now unsure about trusting new green mobility apps that do not show much transparency.
4. Possible NPAs & Regulatory Backlash
Banks & NBFCs that lent money to Gensol for their EV fleet are now facing issues with loans that are not being paid back, which have now become NPA.
Consequences
The consequences of the Gensol-BluSmart scam are mentioned below:
1. The two brothers are now prohibited from serving as directors or in key management roles at Gensol or any other publicly listed company until further notice.
2. They are prohibited from buying and selling or trading any securities, in any form or manner, until further notice.
3. If they have any open positions in exchange-traded derivatives contracts as of the date of the Order, they are required to close or square off these positions within 7 days of the Order date or by the contract’s expiration, whichever happens first.
4. The parties involved are allowed to settle their payment obligations for transactions that happened before the end of the trading on the date of the Order.
Implications for India’s EV Sector
The Gensol-BluSmart scam has had a negative impact on the India’s EV sector as highlighted below:
- Investor Sentiment Dented – Global investors who were enthusiastic about India’s green mobility efforts are now being a bit more careful. ESG investments are going to need stricter audits and transparency. Early age EV startups may encounter hurdles when it comes to securing funding.
- Expect Stricter Regulatory Oversight – One can expect tighter regulations coming from SEBI, RBI and NITI AYOG regarding, use of EV related loans and subsidies, fleet ownership documentation, etc.
- Trust Deficit Among Stakeholders – EV ride-hailing companies may now struggle to bring new drivers on board. Customers might be stressed about getting refunds and whether they will get reliable services.
To sum it up, although this incident is certainly a negative event, India’s EV ambitions, such as achieving 30% EV adoption by 2030, remain intact.
Conclusion
The Gensol-BluSmart scam is an important event for the EV sector as the company’s unethical practices have resulted in erosion of investor trust. However, the scam will not stop India’s EV mission, but is an opportunity to create a more transparent and accountable environment that attracts investors. The upcoming EV growth phase depends heavily on the development of advanced technologies alongside transparent accounting practices.
Read Also: Financial Scams in India: Types, Resolution, and Awareness
Frequently Asked Questions
What is the Gensol Engineering scam about?
It is about the company’s misuse of funds acquired for purchase of EVs for personal use and unrelated business expenses.
Who are the key people involved in the scam?
Anmol Singh Jaggi and Puneet Singh Jaggi, directors of Gensol, are the key people involved in the scam.
How is BluSmart connected to the scam?
BluSmart leased EVs from Gensol and allegedly overstated EV leasing numbers to inflate its fleet size and operational capacity.
What action did SEBI take against Gensol Engineering promoters?
SEBI banned the Jaggi Brothers from serving as a key management personnel of any publicly listed company and barred them from the securities market.
What cities were affected by BluSmart’s shutdown?
Major cities like Delhi NCR and Bengaluru were affected by the BluSmart shutdown.