Category: Investing

  • ETF vs Mutual Fund: Key Differences

    ETF vs Mutual Fund: Key Differences

    A lot of people who are just getting started with investing hit the same wall: ETF vs mutual fund. Both sound similar on the surface, as these are regulated by SEBI, pool money from investors, and are good for diversification.

    But when you actually start comparing and analysing these, you will find that there are differences that are left unnoticed, which can impact your investment journey and goals a lot. This is one of the reasons why you need to know the difference between ETFs and mutual funds well.

    So, for those who are planning to start investing, this guide is everything you need. Explore the complete mutual fund vs ETF details here and ensure that you have a better plan to start with.

    What Is an ETF?

    ETF stands for Exchange Traded Fund. It is an investment option that pools money and then invests in various assets. These assets are like stocks, bonds, and others.

    Most ETFs in India track a popular index. Like the Nifty 50 ETF tracks the Nifty 50 index. When the Nifty goes up, your ETF goes up. When it falls, so does the ETF. There is no fund manager trying to outsmart the market here. The fund just mirrors the index.

    Because there is no active research or stock-picking involved, the costs are much lower. And since prices update in real time, you can buy at 10 AM and sell at 2 PM if you want to. That kind of flexibility is not possible with a regular mutual fund.

    If you are willing to invest in ETFs, some of the options are:

    • Equity Index ETFs (Nifty 50, Sensex, Nifty Next 50)
    • Gold and Silver ETFs
    • International index ETFs like those tracking the Nasdaq 100

    What Is a Mutual Fund?

    A mutual fund is a pool of money. It is collected from thousands of investors, and this is managed by a professional fund manager. All this is done at an Asset Management Company (AMC). The fund manager decides where to invest this money and how much based on the goals.

    Mutual funds are mostly actively managed. This means that, based on the market conditions, these funds are evaluated, and the investment in assets is changed. The investment is done based on the Net Asset Value (NAV). 

    You can go for lumpsum or even SIP based investment. There are certain conditions linked to the withdrawal and redemption of some of the funds. This is perfect for beginners as well.

    ETF vs Mutual Fund: Quick Comparison

    FeaturesETFMutual Fund
    How do you buy itThrough a stock exchange, like buying shares.Through AMC, a broker, or an investment app
    PricingReal-time changes throughout the dayFixed end-of-day NAV
    ManagementMostly passive (tracks an index)Active or passive
    Expense ratioLow, often 0.05% to 1%Higher, up to 2.5% for active funds
    Demat account neededYesNo
    SIP optionNot straight forwardEasy, starts at Rs 500
    Minimum investmentCost of 1 unitRs 100 via SIP
    TransparencyDaily portfolio disclosureMonthly disclosure
    Best forCost-conscious, market-savvy investorsBeginners, SIP investors, hands-off approach

    The Cost Difference – Here is What You Must Know

    This is where ETFs genuinely shine. The expense ratio of an ETF is low. It can be Average something around 0.10% per year as well. But when it comes to the mutual funds, it is bit higher. This can be around 1.5% per year as well.

    Now, both these numbers really look small. But when you actually calculate these, the ETF vs mutual fund choice becomes even more clear.

    Check the same here.

    If you invest Rs 10 lakh and your fund grows at 12% per year, here is how the expense ratio affects your returns over 20 years:

    • At 0.10% expense ratio (ETF): approximately Rs 94.8 lakh
    • At 1.5% expense ratio (active mutual fund): approximately Rs 73.7 lakh

    That is a difference of roughly Rs 20 lakh, purely from fees. And you did not do anything differently. The market gave the same returns. Costs just ate into them.

    This is not an argument against mutual funds. Active funds can and do outperform. But it is worth knowing what you are paying for.

    Read Also: ETF vs FOF: Key Differences

    Trading Flexibility: ETF Has the Edge

    Because ETFs are listed on exchanges, you have full control over when you buy and sell. You can place limit orders, stop-loss orders, and buy during intraday dips. If there is a big market event and you want to act immediately, you can.

    With a mutual fund, you are always at the mercy of the end-of-day NAV. Even if you place an order at 9:30 AM, your buy or sell goes through at the NAV declared at 4 PM. During volatile days, this can sometimes work in your favour or against you, depending on how the market moves after your order.

    For most long-term retail investors, though, this difference rarely matters much in practice. If you are investing with a 10 to 15-year horizon, whether you bought at Rs 100 or Rs 101 today is not what determines your outcome.

    ETF vs Mutual Fund: Tax Treatment

    When it comes to taxation, both of these follow the same form as follows:

    • Held for more than 1 year: Long Term Capital Gains (LTCG) at 12.5%, with gains up to Rs 1.25 lakh per year exempt
    • Held for less than 1 year: Short Term Capital Gains (STCG) at 20%

    So, if you see this, there is not much difference when it comes to taxes.

    Active vs Passive Investing: The Real ETF vs Mutual Fund Debate

    The ETF vs mutual fund discussion is often a debate. But it is not about which is better, but more about the difference between passive and active investing. Both are great choices but still you would need to make decision at times.

    Most ETFs are passively managed. They aim to replicate the performance of a market index such as the Nifty 50 or Sensex. Their target is to match the performance and not outperform. 

    When it comes to mutual funds, these are mostly actively managed. They aim to offer higher returns to the investors. Also, these funds are being managed by experts and so changes in the composition are quite common based on the market conditions. 

    Index mutual funds offer a middle ground. Like ETFs, they follow a passive investment strategy, but they function like regular mutual funds. Investors can start SIPs, invest without a Demat account, and enjoy a simpler investment experience. This is good for all investors in general. 

    So Which One Should You Actually Go With?

    Now this is one of the most important questions. This is where many people get confused. While both of these are great choices, you need to ensure that you follow based on detailed analysis and understanding of the market.

    To help you out, here is a quick idea for you:

    Go with a mutual fund (or index fund) if you are just starting out, want to invest via SIP every month without much effort, do not have a Demat account yet, or prefer professional management and are okay paying a slightly higher fee for it.

    Go with an ETF if you already have a Demat account, want to keep costs as low as possible, are comfortable with placing buy and sell orders yourself, or want real-time flexibility in your investing.

    And honestly, for most people who have been investing for a year or two, a combination works well. A few low-cost ETFs for the core of your portfolio, and selective actively managed mutual funds where you believe active management adds genuine value, particularly in mid or small cap categories.

    Read Also: ETF vs Index Fund: Key Differences

    Conclusion

    Whether you lean towards ETFs or prefer the simplicity of mutual funds, where you invest matters as much as what you invest in. Pocketful lets you do both from a single platform, trade ETFs like shares with zero commission, and invest in direct mutual fund plans without any distributor fees cutting into your returns.

    If you have been sitting on the sidelines thinking you will figure this out later, this is a good time to start. Open your Pocketful account today and put your money to work.

    S.NO.Check Out These Interesting Posts You Might Enjoy!
    1Mutual Fund vs ETF. Are They Same Or Different?
    2Best ETFs in India to Invest
    3ETF vs Stock – Which One is the Better Investment Option?
    4Gold ETF vs Gold Mutual Fund: Differences and Similarities
    5SIP in ETF: How to Invest Regularly in ETFs

    Frequently Asked Questions (FAQs)

    1. Which is better for beginners: ETF or mutual fund?

      Beginners can invest in either based on their target. ETF is good when they want a passive option. A mutual fund is when they are looking for an active investment. But in general, a mutual fund is a way better choice.

    2. Do ETFs give higher returns than mutual funds?

      Not necessarily. ETF returns depend on the index they track, while mutual fund returns depend on the fund manager’s investment decisions. So, you can find mutual funds that offer better returns.

    3. Can I start a SIP in an ETF?

      Yes, but the process is not as seamless as a mutual fund SIP. You generally need to place ETF purchase orders regularly through your broker, whereas mutual funds offer automated SIP facilities.

    4. Do I need a Demat account to invest in ETFs?

      Yes. ETFs are traded on stock exchanges like shares, so a Demat and trading account are required. Mutual funds can be purchased directly from an AMC or investment platform without a Demat account.

    5. Can I invest in both ETFs and mutual funds?

      Yes. Many investors combine both. This is a good plan for diversification and a balanced result. ETF will help you with exposure and low-cost. A mutual fund can offer expert support and growth.

  • What should you do if your stock portfolio is stuck in losses?

    What should you do if your stock portfolio is stuck in losses?

    What Should You Do If Your Stock Portfolio Is Stuck In Losses

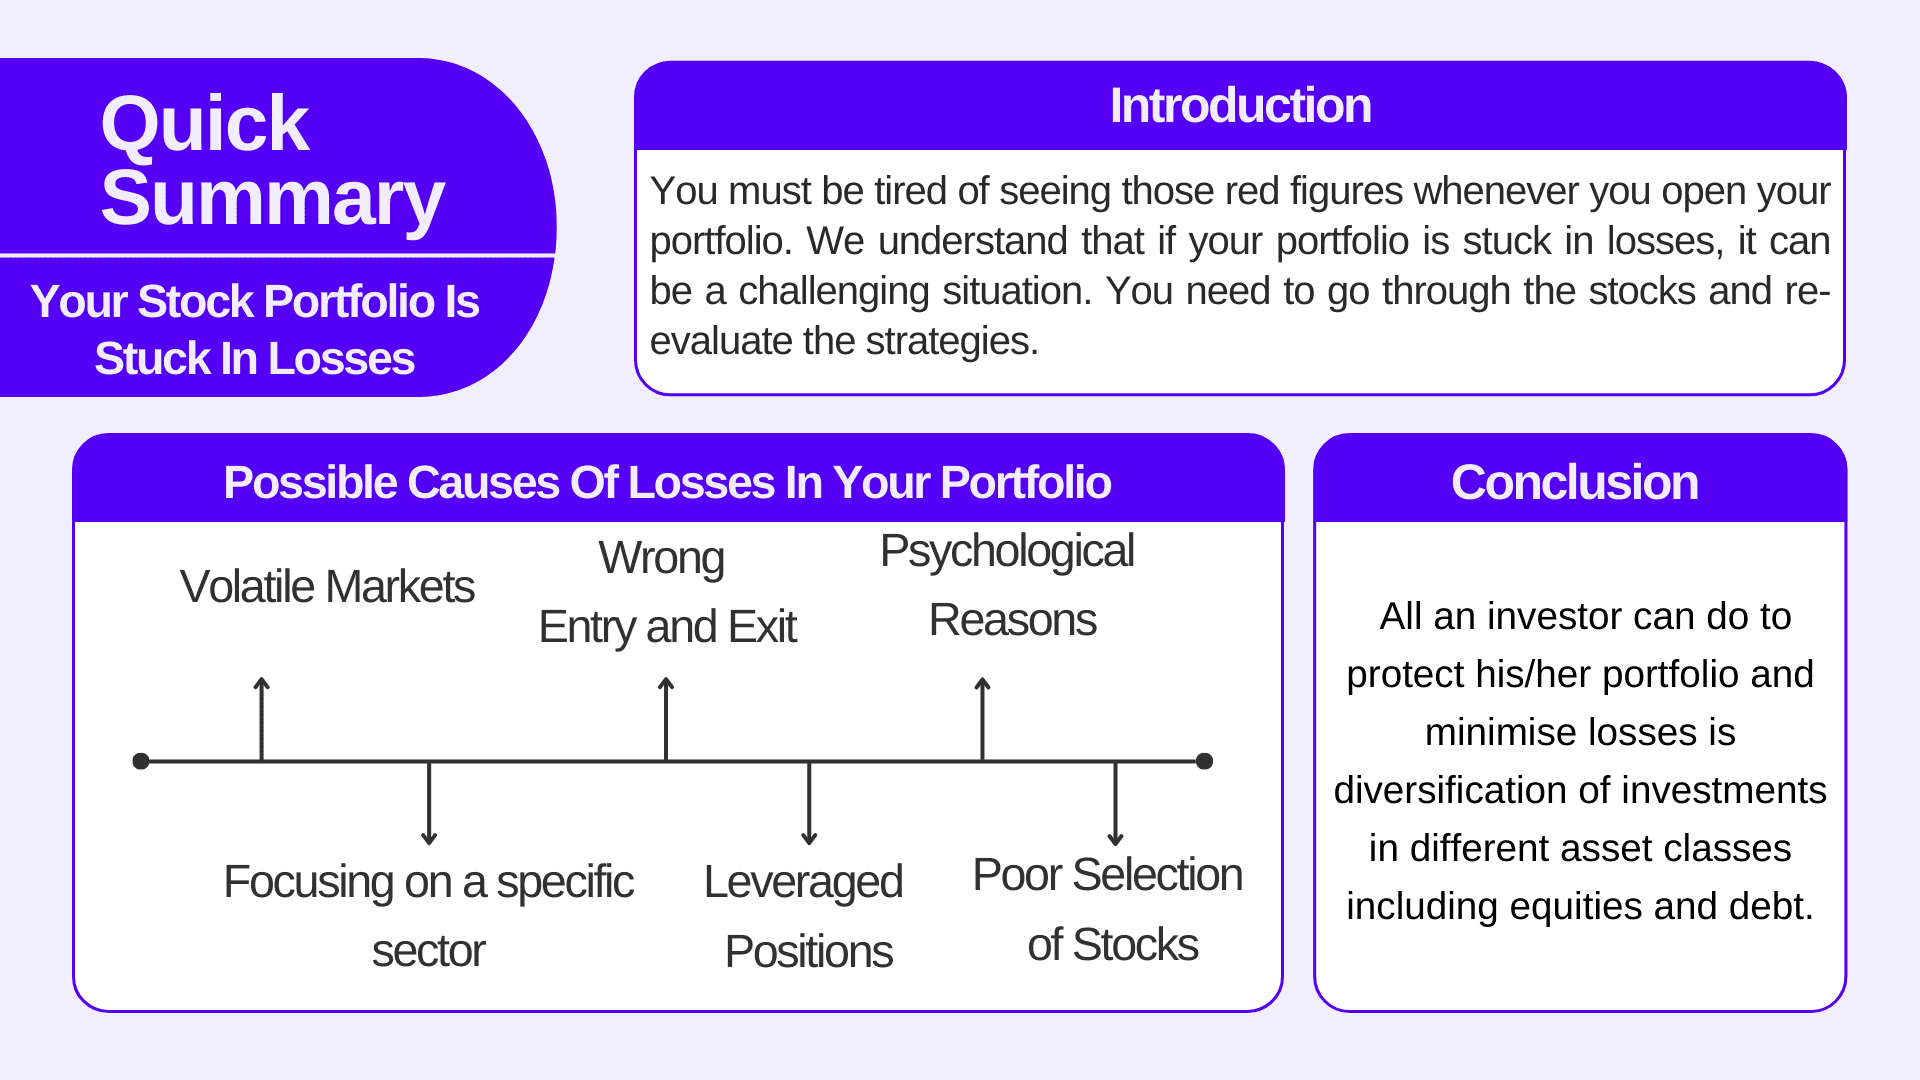
    You must be tired of seeing those red figures whenever you open your portfolio. We understand that if your portfolio is stuck in losses, it can be a challenging situation. You need to go through the stocks and re-evaluate the strategies. It is necessary to analyse your portfolio with a level-headed mindset and consider different factors before reaching any decision. You need not worry because we got you covered and in today’s blog, we will be exploring key steps to help you navigate the losses and work towards a more strategic approach.

    Possible causes of losses in your portfolio

    Possible causes of losses in your portfolio

    Below listed are some of the causes that can land you in losses.

    1. Volatile Markets
    2. Focusing on a specific sector
    3. Wrong Entry and Exit
    4. Leveraged Positions
    5. Psychological Reasons
    6. Poor Selection of Stocks

    Let’s understand above mentioned reasons in depth:

    Volatile Markets

    Stock market fluctuations are normal and any sort of volatility in the short-term can lead to unrealised losses. Economic uncertainties like global economic conditions and geo-political events can contribute to volatility in the market. Therefore, if you are a short-term investor you need to be careful about the economic activities and global events.

    Focus on a specific sector

    Warren Buffet once said, “Do not keep all your eggs in one basket”. Hence, concentrating on one sector can expose your portfolio to sector-specific risks. Any kind of challenge in that particular sector can impact the performance of the stocks of that particular sector.

    Wrong Entry and Exit

    A lack of technical analysis and bad trading decisions can lead to poor timing of entry in the market. Buying stocks when they are at their highs can affect the overall performance of your portfolio.

    Leveraged positions

    If you do margin trading chances are likely that you will end up amplifying your losses because any kind of trend reversal in the market can worsen your situation and you will be forced to liquidate your portfolio at unfavourable prices.

    Psychological Reasons

    Herd mentalities won’t work when trading in the stock market. If you are someone who frequently invests or trades on tips and bets on random stocks you will lose all your capital because people can have different financial goals and risk appetite.

    Poor selection of stocks

    It is important to analyse any stock technically and fundamentally before investing. Without proper study, stock selection can be tough and can impact your portfolio.

    Read Also: 10 Top Investors In India And Their Portfolios

    How to deal with red portfolio

    how to recover losses

    Let’s discuss the ways through which you can manage the losses and turn your portfolio into green.

    Revaluation

    Analyse the reason you initially invested in the losing stock. Are there any kind of fundamental changes since then? We say that candlestick charts are astrological graphs of any stock. Go through these charts and try to know the current trend of that stock. The initial reason for investment should still align with your long-term investment goals. If you find anything fishy then consider exiting the stock.

    Long-term perspective

    If you are a long-run investor and revisit your portfolio every now and then, it may lead to disappointments because those red figures might bother you. As company goes through several phases, it might be the case that your stock is in red now because of temporary reasons. If company’s philosophy is aligned and management is good then stocks often generate good returns to Investors but yes that takes patience. Since patience is the key to successful investing in the stock market you need to wait for the stock to recover from the losses.

    Some wise person once said “Checking your portfolio daily is like putting up a web-cam in the forest to see if the trees are growing.”

    Portfolio-review

    Review your portfolio periodically say once every quarter and keep a check on your investment strategies. Consider rebalancing your portfolio quarterly, half-yearly or annually according to your current financial situation and market conditions.

    Follow Stop-loss

    Strict stop-loss is a prudent decision. Learn to respect the stop loss. If there is a sudden fall in the margin or ratios of the stock, consider selling and reallocating the funds. Stop loss is designed to limit an investor’s loss in a position. There is no point of staying investing in a stock that has underperformed over the years and is no longer giving you returns.

    Invest practically and not emotionally.

    Risk-Appetite

    Reassess your risk tolerance. If the losses are causing significant stress or anxiety, it may be an indication that your risk tolerance needs adjustment. Your portfolio should match your comfort level and your goal of investments.

    Diversification

    Do not concentrate your investment amount on an individual stock or in stocks of the same sector. Diversify your portfolio in order to reduce stock specific and sector specific risks. This can help you in mitigating the losses because not all the stocks in your portfolio will give you losses.

    Exit your mistakes in Bull Market

    Go through the overall market trends including the global economy. Sometimes market gives golden opportunities to investors to exit their mistakes, as in Bull run, most of the stocks do well irrespective of their fundamentals.

    “No stock in an uptrend has ever gone bankrupt.” – Walter Deemer

    Advice from professionals and experience.

    If you are a newbie, you must understand the fact that a journey in the stock market is a roller coaster ride. If you are not able to navigate your losses and diversify your portfolio, go for professional advice. An experienced person can give market insights and help you make investment decisions as per your risk and financial goals

    Invest at regular intervals

    One of the best ways to avoid losses and reduce the risk is regular investment. We have already discussed about selling the investments if they are not generating returns, but we also want to make you aware of the art of averaging the stocks. Falling markets give us losses and we all know this. But instead of panic selling, you can choose take benefit of downtrend and average the stock if it’s fundamentally strong.

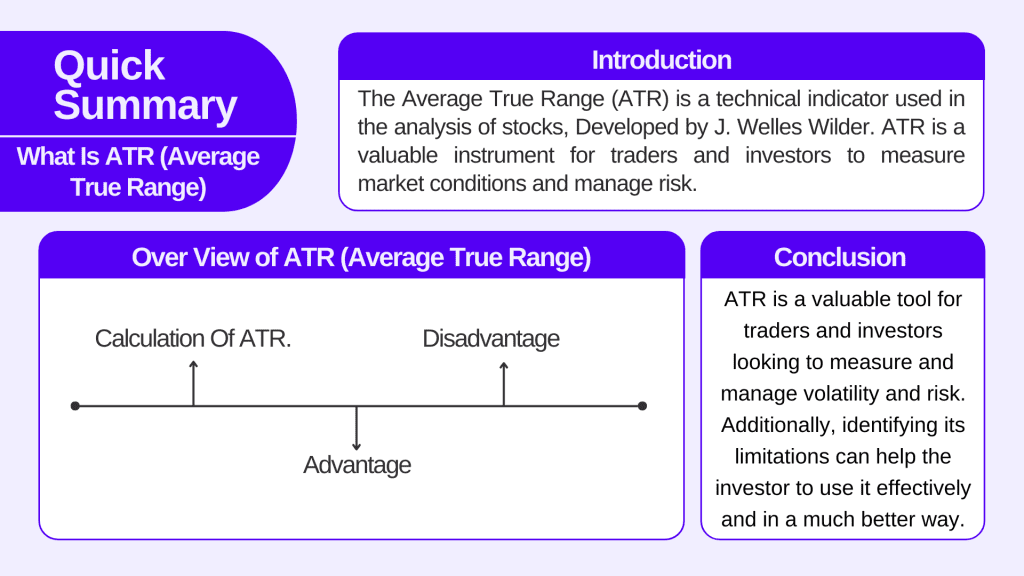
    Also, check out the blog on ATR.

    Note: Averaging of stocks is defined as buying more shares of that stock over time to lower the average buy price of the stock provided the price of the share is trading below your initial buy price.

    Conclusion

    conclusion

    It is important to be mindful of your investments because there is no guaranteed technique to escape losses in the stock market. All an investor can do to protect his/her portfolio and minimise losses is diversification of investments in different asset classes including equities and debt. You should know that only an optimistic approach will work well with your developed strategies throughout your investment journey. The stock market inherently carries risk and it’s unavoidable. Any investor should make decisions based on his/her own rationale. You just need to be consistent and patient and the market will surely reward you with profits.

    The decision is tough but will be worth it!

    Frequently Asked Questions (FAQs)

    1. If your portfolio is stuck in losses what should be the first step?

      The first step should be analysing the reasons for the losses – It can be either stock specific (e.g. Yes Bank) or market specific (e.g. Covid-19). Force selling in a market specific scenario is not ideal.

    2. Should an investor consider selling stock immediately once the portfolio turns red?

      No, by doing so s/he will be selling the stocks in a panic state. Sit back and analyze the technical and fundamentals of the stock. Always take the decision with a clear mind.

    3. How can diversification help you minimise your risk?

      Diversifying your portfolio can help you in eliminating the stock specific or sector specific risks.

    4. Can professional advice help you reduce losses?

      Yes, professionals can help you making an informed decision.

    5. How to control emotions when trading in the stock market?

      When trading in the stock market you should be disciplined. Further, educate yourself so that you can make better investment decisions and formulate profitable strategies. Always remember that Emotional biases are easier to understand but difficult to overcome.

  • Fixed Deposit vs Stocks – Key Differences Compared

    Fixed Deposit vs Stocks – Key Differences Compared

    Where to invest? How much to invest? Should I go with investing in stocks, or should I go with bank fixed deposits?

    These questions commonly arise whenever you have an ample amount of money and you are economical. In this blog, we will explore the difference between investing in stocks and fixed deposits. Before we learn about the key differences between stocks and fixed deposits, let’s have some basic ideas about financial planning. What is financial planning, and why do we need financial planning?

    Financial Planning means channelling one’s income into consumption and savings, where consumption is defined as the unavoidable expenditure incurred by an individual on his basic needs, and the residual amount after spending is known as savings. The savings can be used to meet the financial goals.

    Types of Saving Instruments

    In a country like India, saving instruments can be divided into two parts

    1. Traditional Savings instrument
    2. Investments

    Most people in India generally opt for traditional savings instruments because there is a lack of financial literacy. Some of the most common traditional methods to save are listed below.

    • Fixed deposits
    • Recurring Deposits
    • Post Office

    Some of the most widely used new-age investment options apart from traditional saving instruments are

    • Stocks
    • Mutual Funds
    • Commodities  

    Now, let us dig deep into the concept of the most used methods of traditional and modern investing i.e., Fixed Deposits and Stocks.

    What are fixed deposits?

    FD

    Let’s make it easy, simplified and crisp with a short example.

    Suppose, you received a Diwali Bonus of Rs.50000, and instead of buying something expensive, you decided to go for a Fixed Deposit. Now you will visit your nearest bank branch and will deposit your money to earn some amount of interest and will just sit back for some years. You will reach out to the bank once again when your Fixed Deposit matures to get your principal amount as well as the interest that you have earned over the years.

    Therefore we can say that fixed deposit (FD) is a tenured deposit account provided by banks or NBFCs (Non-banking financial companies ) which provides investors with a higher interest rate than a regular savings account until the given maturity date. Investment in fixed deposits is considered a risk-free investment.   

    Merits & Demerits of Investing into FDs

    There are certain merits and demerits of saving your money in FDs

    Merits of Investing in Fixed Deposit

    1.     Guaranteed Rate of Interest

    2.     Easy to Monitor

    3.     Tax Benefits

    4.     Loan Against FD

    5.     Flexible Period

    6.     Better option for senior citizens

    Demerits of Fixed Deposits.

    1.     May not beat inflation

    2.     Lower rate of return

    3.     Penalty on pre-mature withdrawal.

    4.     Lack of re-investment opportunity.

    Taxation of Fixed Deposits in India (Example):

    In India, the interest income earned from fixed deposits is subject to taxation under the Income Tax Act. Here’s a simplified example to explain how FD interest is taxed. Suppose Mr. Y has a bank FD of Rs.1 lakh and as per the current rate he is earning an interest 6.5% per annum on his FD, which amounts to 6500 (6.5% of 1 lakh). Now he is liable to pay tax on 6500 as per his income slab. By now, you must have understood the basics of Fixed Deposits. Now let’s throw some light on the most discussed yet so undervalued concept of investing i.e., stocks

    What do you mean by investing in stocks?

    STOCK MARKET

    A stock, also known as equity, represents a part of an individual’s ownership in a corporate or government company. Investing in stocks carries a level of higher risk because the value of a stock can be influenced by various factors, including the company’s financial performance, economic conditions, and market sentiment. However, stocks have historically offered higher returns compared to other investment options. Many investors choose to build a diversified portfolio of stocks to spread their risk. Diversification involves owning a basket of stocks from different sectors to reduce the impact of poor performance in any one stock. Stocks can be diversified into large-cap, mid-cap and small-cap companies

    Large-cap 

    Companies are generally growth-oriented companies that are considered safer while investing. They are less risky and give lower returns than other companies since risk and reward in the stock market go hand in hand.

    Mid Cap 

    Companies possess higher risk when compared with large-cap companies and they are suggested for investors who are well-versed with the concept and idea of investing in stocks.

    Small cap 

    Companies carry higher risk since they are start-ups, having good potential to perform in longer investment horizon.

    Read Also: Which is Better: Fixed Deposit or Residential Property Investment

    From where can we buy or sell stocks?

    Stocks are bought and sold on stock exchanges, organized marketplaces where buyers and sellers join together to trade. Stock exchanges in India are NSE and BSE. If we talk about the returns of the stock market, they are highly volatile and are dependent on the performance of the market. If you are planning to invest in stocks from the point of view of the short term, then be ready for the volatility you might face. Still, if you stay invested for a longer horizon, the market will surely reward you for your patience with outstanding higher returns, which can fight inflation.

    Taxation of Equity in India

    Just like taxation on FDs, stocks are also subject to tax deductions. The taxation on equity is divided into two parts, the first being the short-term capital gain and the second being the long-term capital gain.

    1. Short-Term Capital Gain  

    The realized gain within 365 days of investing is considered short-term and taxable at 15%.

    1. Long-Term Capital Gain 

    The realized gain after 365 days of investing is considered long-term and is taxable at 10% over and above 1 Lakh.

    Merits & Demerits of Stocks

    How to become aware during Stock marketplace investment?

    Now, let’s discuss the merits and demerits of investing in stocks.

    Merits of investing in stocks

    1.     Inflation rate adjusted Returns

    2.     Dividend income

    3.     Liquidity

    4.     Tax benefits

    5.     Wealth creation

    Demerits of investing in stocks

    1.     Volatility of markets

    2.     Higher Risk of Loss

    3.     Brokerage

    In India, 3% of the current population is investing in stock markets and we hope that with our blogs we will be able to make our upcoming population financially more aware.

    After having an overview of the basics of Fixed Deposits and stocks.

    We can now easily create a table of differences between stocks and FDs.

    Basis of DifferenceFixed DepositStocks
    LiquidityIt has very little liquidity as compared to stocks.Stocks have high liquidity.
    RiskInvestment in Fixed Deposit is considered risk-free.Investment in stocks possesses higher risk.
    Investment HorizonPre-decided investment horizon.Suggested for individuals having high-risk appetites.
    Rate of Interest (Return)GuaranteedMarket Linked
    TaxationInterest is fully taxable.Long
    ExpensesNo expensesTransaction Cost
    Inflation RateReturns of FD may or may not beat inflation.It offers inflation-adjusted returns.
    Duration of investmentGenerally suggested for the shorter horizon.It is suggested for individuals having long-term investment horizons.

    Read Also: A Guide To Fixed Deposits: Exploring Types And Interest Rates

    Conclusion

    CONCLUSION

    Therefore, it is always suggested to select between the two as per your investment objective, financial goal and risk appetite. Eventually, there is no one-size-fits-all answer, and the optimal choice depends on your preferences. Do not forget to consult a financial planner to tailor your investment strategy if you are confused.

    Frequently Answered Questions (FAQs)

    1. Which is considered safer, Fixed deposits or stocks?

      Fixed deposits are generally considered safer as they provide a fixed return.

    2. Which investment option offers higher returns between stocks and FDs?

      Stocks offer higher returns than FDs.

    3. Who provides FDs?

      Banks and Non-Banking Financial Institutions provide FDs.

    4. What is STCG in stocks?

      STCG in stocks stands for short-term capital gains, which are 15% of your realized gains.

    5. Who decides the interest rate on FDs?

      Banks and NBFCs decide interest rates on FDs, which vary from bank to bank.

    Selection Methodology and Important Disclaimer

    The stocks included in this list are selected primarily on the basis of their market capitalisation, which represents the total market value of a company’s outstanding shares. The companies are arranged in descending order of market capitalisation, with larger companies appearing first, followed by relatively smaller companies. This methodology is intended to provide a structured approach for identifying companies based on their market size and overall presence within a sector.

    However, market capitalisation should not be considered the sole factor while evaluating investment opportunities, as it does not guarantee future performance, profitability, or returns. Investors should also assess other important factors such as financial health, business fundamentals, management quality, valuation metrics, industry outlook, and market conditions before making investment decisions.

    The information provided is for educational and informational purposes only and should not be construed as investment advice, recommendation, solicitation, or an offer to buy or sell any securities by Pocketful Fintech Capital Private Limited.

  • What is Asset Under Management (AUM) in Mutual Funds

    What is Asset Under Management (AUM) in Mutual Funds

    Before learning about AUM, let us know a little about AMCs.

    AMC stands for Asset Management Company and manages and operates the mutual funds. It pools money from retail and institutional investors and invests that fund in a diversified portfolio of stocks, bonds, and other financial instruments. AMCs have dedicated research teams and fund managers who make decisions on the allocation of assets and portfolio management. AMCs earn fees for managing mutual funds, a percentage of the fund’s AUM.

    What is AUM?

    AUM assets under managemnet

    AUM stands for asset under management. AUM in mutual funds refers to the total market value of all the assets a mutual fund manages on behalf of its customers. It is an essential metric in the financial markets. A larger AUM generally implies a larger fund with more investors. The respective mutual fund scheme AUMs can be found in the monthly fact sheet of the AMCs on their website or online mutual fund research platforms.

    Indian Mutual Funds Industry

    Before getting into the Indian mutual funds industry, let us know about the history of mutual funds. To make India financially stable, strong, and independent and encourage saving and investment, the first mutual fund was established in 1963, Unit Trust of India, by a combined initiative of the Government and the Reserve Bank of India by an act of Parliament. The mutual funds industry has grown significantly over the years. Unit Scheme 1964 was the first scheme that UTI launched.

    In 1993, the first set of SEBI Mutual Fund Regulations existed for all mutual funds except UTI. The former Kothari Pioneer (now merged with Franklin Templeton Mutual Fund) was the first private-sector mutual fund registered in July 1993.

    With the entry of private sector funds in 1993, a new age began in the Indian MF industry, giving Indian investors a wider and better choice of Mutual fund products.

    The MF Industry’s AUM has grown from ₹ 22.24 trillion as of October 31, 2018, to ₹46.72 trillion as of October 31, 2023, more than a 2-fold increase in 5 years (source- AMFI website). The Indian Mutual Funds industry has witnessed robust growth over the years. The sector provides investors with different mutual fund categories like equity, debt, and hybrid funds catering to their risk profiles and preferences. Not only this, the mutual fund industry in India has also undergone a digital transformation.

    Read Also: Mutual Funds: Meaning, Types, Features, Benefits and How They Work.

    Calculation of AUM

    calculation of AUM

    AUM in mutual funds is calculated by adding up the market value of all the securities, cash, and other assets mutual funds hold.

    The formula for the same is listed below

    AUM= Market Value of Securities + Cash & Cash equivalents + Other Assets

    For example, a mutual fund holds the following

    The market value of securities = Rs. 50 Crore

    Cash & Cash equivalents = Rs. 7 Crore

    Other Assets = Rs. 3 Crore

    Therefore, AUM = Rs. 50 Cr. + Rs. 7 Cr. + Rs. 3 Cr. amounts to Rs. 60 Crore.

    It’s important to note that the actual calculation may involve more detailed considerations, especially in a real-world scenario where the portfolio may consist of various types of securities, derivatives, and other financial instruments. Moreover, the market values of securities can fluctuate, affecting the AUM over time.

    Remember that the total value of AUM keeps changing depending on the performance of the assets.

    Significance of AUM in different Mutual Funds Categories

    What is a high AUM in mutual funds? It's Worth
    1. Larger AUM in equity funds, whether large or mid-cap, reflects a broader investor base and better scale of operations. However, a larger AUM while investing in small-cap companies can pose challenges. Therefore, small caps do not concentrate much on AUM.
    2. Smaller AUM in sectoral and thematic funds may indicate a more focused approach to investment since these funds often focus on specific sectors and themes.
    3. In the case of hybrid funds, a mixture of equity and debt, a larger AUM can provide better diversification benefits.
    4. Fixed-income funds like bonds also need a larger AUM for better diversification.

    Factors affecting AUM

    Does AUM impact Mutual Funds? What are the key factors?
    1. Performance of the Market

    When markets are performing and in a rising phase, investors are more likely to invest, resulting in increased inflows and higher AUM for investment companies. In falling markets, investors redeem the funds, resulting in a decline in AUM.

    1. Fees & Expenses

    The expenses charged by asset management companies can influence AUM. Lower fees can make the funds more eye-catching to investors.

    1. Advertisement & Distribution of Funds

    Effective marketing and distribution policies are vital in attracting new investors and growing a firm’s investor base. Successful marketing campaigns and a strong distribution network can help the MF house generate inflows and increase AUM.

    1.  Economic Conditions

    The global economic environment can also affect AUM. When a country is economically stable and in its growth phase, more investments will occur, leading to higher inflows.

    1. Past performance

    The historical show of a company plays a vital role in determining AUM. Funds generating consistent positive returns will eventually attract new investors.

    For this, first, we need to understand what is the expense ratio. The expense ratio is defined as the annual cost of managing and operating mutual funds. AMCs charge these expenses and are a percentage of AUM., for example, management fees, administrative expenses, and Distribution expenses. Formula for calculating Expense Ratio = (Total Fund Expenses / AUM) *100. Therefore, there is an inverse relationship between AUM and the expense ratio.

    As AUM increases, the overall percentage of expenses relative to assets decreases. Keep in mind that AUM influences the calculation of the expense ratio and plays a vital role in structuring the overall cost of the fund and

    Conclusion

    CONCLUSION

    To wrap it up, AUM is an important metric for investors when it comes to selecting mutual funds. It can only provide insight about the AMC but cannot be the sole factor when making investment decisions also, a higher AUM does not signify better returns and performance by the mutual funds. The significance of AUM can fluctuate across different fund categories.

    Read Also: History of Mutual Funds in India

    Frequently Answered Questions (FAQs)

    1. What is AUM?

      AUM stands for asset under management and is the total market value of all the assets that a mutual fund manages on behalf of its customers

    2. What is the formula for calculating AUM?

      The formula for calculating AUM is
      AUM= Market Value of Securities + Cash & Cash equivalents + Other Assets

    3. How is the expense ratio and AUM related?

      Expense ratio and AUM share an inverse relationship, i.e., an increase in AUM decreases the expense ratio.

    4. Who manages the mutual fund?

      Asset Management companies manage mutual funds.

    5. When was the first mutual fund in India established?

      1st mutual fund in India was established in the year 1963.

  • How does the Price of Oil affect the Stock Market?

    How does the Price of Oil affect the Stock Market?

    Oil prices can significantly impact the stock market and are closely inter-related. Oil is an important commodity that contributes to the growth or downfall of an economy and is extensively applied in various industries. Oil prices are defined by a complex interplay of supply and demand dynamics, geopolitical events, production decisions by major oil-producing countries, and changes in the global economy. When the price of oil rises or falls, it can cause various effects that leave footprints throughout the financial markets.

    How Does The Price Of Oil Affect The Stock Market

    In today’s blog, we will be discovering the ways in which changes in the price of oil can affect the stock market. Whether you’re an investor, or simply interested in knowing about the theories of the financial world, understanding the relationship between oil prices and the stock market is crucial for making sound trading decisions and analyzing the current economic trends that are prevailing in the market. The relationship between oil prices and the stock market is complex and intricate.

    How does the Price of Oil affect the Stock Market                                                                    

    Below listed are some of the key points which depict the relationship between the stock market and oil prices

    1. The direct impact of the change in oil prices is on the energy sector stocks which include oil producers and exploration companies. Increased oil prices will have a positive impact on the profitability of these companies. As a result, the stock prices of all the oil companies will soar high.
    2. Oil prices can have a noteworthy impact on inflation. An increase in the price of oil can lead to high production and transportation costs which will increase the general price level of the economy.
    3. Any kind of change in oil prices can also affect other sectors. For example, companies like manufacturing and chemicals that use oil as the key input can have negative effects on their production capacity and their profit margins will be reduced significantly.
    4. Changes in oil prices can also affect the spending capacity of consumers because they will have to pay more money for oil-related products and will be forced to think before buying.
    5. Geopolitical events in major oil-producing regions can disrupt oil supplies and lead to price spikes. These events can increase market uncertainty.
    6. Oil prices are generally denominated in foreign currency i.e., the U.S. dollar. Any kind of increase in the oil price will strengthen the dollar and weaken the Indian currency.

    Read Also: How Interest Rate Changes Affect the Stock Market

    Companies that are majorly affected by the change in oil prices

    Companies that are majorly affected by the change in oil prices

    1. Airlines & Transportation

    Fuel cost comprises one of the most important parts of the operating expenses of the aviation sector. If oil prices are low then the profit margin of these companies will automatically increase. Consumers, in such a case, may get a chance to enjoy lower airfares.

    2. Paint companies

    A fall in the price of oil can reduce the production costs of paint companies. Derivatives of crude oil are important in the production of paints.

    3. Automobile companies

    If there is a sustained increase in prices customers’ choice of fuel-efficient vehicles may change which in turn may affect the demand of some vehicles.

    4. Oil refineries & Marketing Companies

    Oil refineries are meant to convert crude oil into useful products like gasoline and diesel. A spike in oil prices can affect the input costs of these companies.

    5. Agriculture

    Geopolitical events in major oil-producing regions can disturb oil supplies and lead to an increase in prices of oil. These events can increase market uncertainty.

    Oil Crisis

    One of the most famous examples of oil crisis in history is the 1973 oil crisis. This had a deep impact on the global economy and energy policies. Here’s a brief overview of the 1973 oil crisis:

    The oil crisis of 1973 was the end result of some geo-political events. In the year 1973, Egypt and Syria attacked Israel. The U.S. provided military aid to Israel which Arab countries did not like. In reaction, the OPEC countries applied an Oil Embargo on the United States. An Oil Embargo is defined as an economic situation where the transportation of petroleum is limited by some entities to or from an area). This led to a reduction in the global supply of oil. Oil prices at that time were at sky-highs and this caused inflation and higher energy costs. The crisis resulted in increased investment in the development of alternative energy sources, such as nuclear, solar, and wind energy. The purpose of giving the reference to the oil crisis in today’s blog was to give a historical example of how geopolitical conflicts can impact the energy sector. For our readers’ knowledge let us have some basic ideas about OPEC countries.

    1. OPEC stands for the Organisation of the Petroleum Exporting Countries. This organization was formed in the year 1960
    2. OPEC countries are a group of countries that collaborate to coordinate and control the pricing policies of petroleum products.
    3. Currently, there are 13 OPEC countries.
    4. India imports 84% crude oil to fulfill its requirements from countries like Saudi Arabia, Iraq, Iran, and UAE.

    Read Also: How to Trade in the Commodity Market?

    Conclusion

    The relationship between oil prices and the stock market is not always the same and aligned. To conclude, some companies may take advantage of lower oil prices while others may suffer if their core business is dependent on the energy sector. The investor should take note of ongoing oil prices and news updates if any before investing in oil-related companies because chances are likely that oil prices may change and these fluctuations are unavoidable. By now you must have understood that oil prices do have a major impact on the stock market.

    FAQs (Frequently Answered Questions)

    1. How does the price of oil affect the stock market?

      Oil prices affect sectors across the stock market in different ways energy company benefits if the stock prices increase and other companies might suffer losses.

    2. What is the full form of OPEC?

      OPEC stands for the Organisation of the Petroleum Exporting Countries.

    3. From which country India imports maximum oil?

      India imports 84% oil from U.A.E.

    4. What affects the oil prices?

      Any kind of change in supply-demand dynamics and geopolitical events can lead to a change in the price of oil.

    5. How can investors navigate the impact of oil price changes?

      Investors can lower their risk of loss by diversifying their portfolios and concentrating their investments in oil-related stocks.

  • How Interest Rate Changes Affect the Stock Market

    How Interest Rate Changes Affect the Stock Market

    What is Interest Rate?

    Interest rate is defined as the price that you pay when you borrow money from someone or it can also be known as income that you earn on your investments like bonds, FDs, and government securities. We will talk about interest rates in the context of lending and borrowing money. Interest rates in India are managed and regulated by RBI and play an important role in the economic growth of a country.

    How Interest Rate Changes Affect The Stock Market

    RBI manages various types of interest rates. Let’s have a glimpse at these rates.

    1. Repo Rate
      The rate at which the RBI lends money to commercial banks. Any kind of change in repo rate can affect the cost of borrowing for banks as well as retail consumers. The repo rate is considered a key tool to control inflation and stimulate economic growth.

    2. Reverse Repo rate
      The rate at which RBI borrows money from commercial banks. This rate is comparatively lower than the repo rate.
    3. Cash Reserve Ratio
      CRR, or cash reserve ratio, is the amount that commercial banks need to maintain with RBI in the form of cash. Banks do not receive any kind of interest on this from RBI.
    4. Statutory Liquid Ratio
      SLR is the minimum amount in percentage that a bank needs to keep either liquid or as investments in government securities.

    The RBI uses these interest rates and tools to manage monetary policy, control inflation, and maintain financial stability. Our major focus today will be on the repo rate and how even a slight change can have wide-ranging effects on the broader economy.

    Why interest rates are changed?

    why interst rate changes

    RBI changes these repo rates as a part of its monetary policy so that it can achieve its financial objectives. Now, what is monetary policy? Policy framed by the RBI to control and manage the supply of money in the economy. Monetary policy can either be contractionary or expansionary. When the money supply is increased and interest rates are reduced. This is known as the expansionary monetary policy. The vice-versa is known as the contractionary monetary policy. Coming back to our topic RBI changes the repo rate because of the following reasons,

    1. To control inflation in the economy.
    2. To focus on the economic growth of the economy.
    3. Situations prevailing in the global economy

    The decisions related to the repo rate are made during the RBI’s monetary policy meetings, which occur at regular intervals. Before moving further, we will give you some basic idea about the concept of inflation and deflation. Inflation is the general increase in the price level of goods and services in an economy. Consumers tend to pay more than the actual value of the good. The purchasing power of consumers decreases. In such a case under the monetary policy, the government of India increases the interest rate to fight inflation. This will decrease the flow of money in the economy.

    Deflation is the opposite concept of inflation. A general decrease in the price level of goods and services is called deflation. The purchasing power of the consumer is increased. RBI, in this situation, will lower the interest rate in order to increase the flow of money in the economy. We all know that the stock market of any economy is a true indicator that signals the pace of economic growth. So, we need to analyze the fact of how a change in repo rate can impact the markets.

    Read Also: How to Start Stock Market Trading With Low or Limited Capital

    Impact of rate change on the Indian stock market.

    The impact depends on the direction and magnitude of the interest rate changes, as well as the broader economic context.

    Interest rates can be changed in two ways

    • Interest rate hikes
    • Interest rate cuts

    When it comes to interest rate hikes, the cost of borrowing money increases which will make it difficult for the companies to avail loans and this will eventually reduce the profitability of the businesses. This will lead to lower earnings of the companies and decreased prices of the stock.

    Any sort of increase in the rate of interest can make other investment options more attractive. From the consumer’s point of view, there can be a significant change in his spending habits since there we be lesser disposable income in his hand thereby affecting his savings and investments. Interest Rate cuts, on the opposite side, lead to a decline in the cost of borrowing making it easier for the investor to grow which will lead to higher earnings and higher stock growth.

    The immediate impact of interest rate changes on the stock market may vary. Short-term interest rate changes might lead to short-term stock market volatility, while long-term rate trends can have a more lasting effect on the stock market.

    Impact of change in rate by the US Federal Reserve on the Indian stock market

    Impact of interest rate change

    Federal Reserve, since we all know is the central bank of the United States, can either increase or decrease the interest rate depending on the situation and needs of the economy. A change in the rate of the U.S. Federal Reserve affects the economy globally. The relationship between the actions of the Fed and the Indian stock market is influenced by several factors. Some of these factors are listed below.

    1.  If the Fed increases the rate of interest, foreign investors will find the U.S. markets more lucrative to invest in. They will withdraw their funds from the Indian stock market and deploy it in the U.S. so that they can enjoy higher returns.
    2. A slight change in the rate of interest by the Fed can have a significant impact on the exchange rates of currency. If the interest rate increases the U.S. dollar will strengthen and the Indian rupee will weaken.
    3. If U.S. rates rise substantially, it may lead to higher interest costs for Indian companies that have borrowed in U.S. dollars or have exposure to foreign currency debt.

    Read Also: Impact of Interest Rate Change on Financial Markets

    Conclusion

    To conclude interest rate and stock market share an inverse relationship. If you wish to receive consistent returns investing for a longer horizon is suggested. These short-term stances of rate change will create many complications. However, an investor should be well aware of the consequences of the rate change on the market so that he can make informed decisions. They should adopt a diversified investment strategy and take into account their own financial goals, and risk tolerance.

    S.NO.Check Out These Interesting Posts You Might Enjoy!
    1Mutual Fund vs PMS: Which is Better?
    210+ Best Investment Plan for Monthly Income in India
    3Hybrid Mutual Funds – Definition, Types and Taxation
    4What is an Open-Ended Mutual Fund & How to Invest in it?
    5Mutual Fund vs ETF. Are They Same Or Different?
    6Mutual Funds vs Direct Investing: Differences, Pros, Cons, and Suitability
    7How Interest Rates Impact Mutual Funds in India

    Frequently Answered Questions (FAQs)

    1. How does interest rate affect bond prices?

      Bond prices and interest rates have inverse relationships i.e., when the central bank increases the interest rates, bond prices decrease, and vice versa.

    2. Do all stocks react to interest rate changes in a similar way?

      No, stocks across sectors react differently to interest rate changes.  

    3. Who regulates and manages the interest rate in the stock market?

      Reserve Bank of India controls and manages the interest rates.

    4. Why does RBI increase the interest rate?

      RBI increases the interest rates in order to control inflation and for the overall growth of the economy.

    5. What happens to borrowing costs when RBI increases the interest rates?

      Borrowing cost for the companies increases if RBI increases the rates.

  • Understanding The Different Ways To Invest In The Indian Stock Market

    Understanding The Different Ways To Invest In The Indian Stock Market

    Starting your journey into the world of finance is never an easy task, especially if you do not know where to start. Have you ever wondered what the ideal way to expand your financial footprint is? Participating in the growth of companies is a perfect way to increase your corpus, but you need to know your options to make the right choice. You can consider direct equities and professionally managed funds as part of your financial planning, and it can ease the process for you. If you are new to the world of finance, these are great options to make your first move.

    However, you cannot just open an account and start investing. You need to know what you are getting into. This informative piece will walk you through the basics of everything you need to know as a beginner, and you can make the right choice depending on your needs and preferences. Below, you can find an overview of the entire process of understanding the financial world.

    Getting Familiar With The Indian Stock Market

    In the simplest terms, the stock market refers to the medium through which people can buy and sell the shares of different companies. These are companies whose stocks or shares are publicly traded. These corporations tend to sell a portion of their ownership to the public and institutional investors through an Initial Public Offering (IPO).

    As is often discovered when researching the stock market India, these mediums are facilitated by an elaborate framework of exchanges that are governed and controlled by the SEBI. Therefore, a comprehensive comprehension of the system will help you identify how to invest in the stock market.

    Different Ways To Invest In The Indian Stock Market

    As it is safe to assume by now, purchasing company shares is simply not the only option. While this activity remains the centerpiece of stock market participation, there are different types of investments that you can consider depending on your needs and financial commitments. The stock market in India has several broad-based investment products:

    • Direct equity
    • Mutual funds
    • Exchange Traded Funds (ETFs)
    • Initial Public Offerings (IPOs)
    • Futures & Options (F&O)

    Here is a brief overview of how each of these works:

    1. Direct Equity

    By investing in direct equity, you are simply purchasing a company’s share. This method is the riskiest and most time-consuming of all, as it requires researching potentially profitable companies before buying.

    2. Mutual Funds

    A mutual fund is a pool of money from many investors managed by a professional who invests in stocks, bonds, or other assets, making it ideal for people who prefer not to research stocks. Here are the main types of mutual funds:

    • Equity Funds: Invest mainly in company stocks and aim for long-term growth.

    • Multi-Asset Funds: Spread money across different asset classes such as stocks, bonds and gold.
    • Small-Cap Funds: Invest primarily in smaller companies with higher growth potential and risk. 
    • Debt Funds: Invest mainly in fixed-income securities such as bonds and government securities.

    3. Exchange Traded Funds (ETFs)

    An ETF is a fund that tracks an index or sector and trades on the exchange like a share, providing mutual fund diversification at lower costs and real-time trading flexibility.

    4. Initial Public Offerings (IPOs)

    An IPO is when a private company offers shares to the public for the first time. Investors apply at the offer price before the stock is listed, with gains or losses depending on demand at the time of listing.

    5. Bonds

    Bonds are fixed-income investments where investors lend money to a company or government for a specified period in exchange for regular interest payments and the return of the principal amount at maturity.

    A Guide On How To Invest In The Stock Market: Step-by-Step Directions

    Clearly, building a diversified portfolio is critical for a successful stock market investment. Moreover, it is important to establish realistic financial expectations because not only are stocks subject to price fluctuations, but they also have the potential to lose value entirely.

    Alongside this, it is crucial that you conduct thorough research regarding a particular stock before you decide to purchase it. Moreover, you must never act on rumors or recommendations since they tend to have no basis in reality.

    If you have ever searched for how to invest in the Indian stock market, you know the process can initially seem overwhelming. Why diversification is important and the various products that you can choose are explained below, along with step-by-step directions for making your first investment. Here are the steps to get started accordingly:

    • Firstly, you are required to open a Demat and Trading account through a registered broker. This means that you will need your PAN and Aadhaar cards, in addition to a bank account, to complete the Know Your Customer (KYC) formalities.
    • Secondly, once you have completed this activity, it is time to consider how you want to invest in the stock market. Once you have decided on products that fit your financial criteria, the next step is to fund your account. You can do this by transferring money from your bank account to your trading account.
    • Then, after completing these activities, you need to log on to your Trading Platform and complete purchase instructions. It is advisable that you begin by purchasing a small amount of shares so that you can familiarize yourself with the process and the way share prices fluctuate.

    Read Also: How Does the Stock Market Work in India?

    Things To Consider Before Investing In The Stock Market

    Wealth creation is a gradual and deliberate process, so it is important to consider your financial situation and investment objectives before putting money into the stock market. If you are learning how to invest in the stock market, consider these factors:

    • Financial Goals: Be clear about what you are investing for, such as building long-term wealth, buying a home or planning for retirement. Your goals can help determine how much you need to invest and where.
    • Risk Tolerance: Understand how much loss you can comfortably handle without making impulsive decisions. Higher potential returns can often come with higher levels of risk.
    • Investment Time Frame: Consider how long you can keep your money invested. Long-term goals may allow you to stay invested through short-term market fluctuations, while short-term goals may require a different approach.
    • Diversification: Avoid putting all your money into a single stock, sector or asset. Spreading investments across different assets can help reduce the impact of poor performance in one area.
    • Financial Capacity: Invest an amount that fits comfortably within your income, expenses and existing financial commitments. Avoid investing money you may need for essential expenses or emergencies.    

    Considering the options above rather than choosing one stock investment type is a wise decision for long-term profitability.

    Conclusion

    Since the process of building wealth is slow, you should set realistic expectations regarding your investments’ performance. By adhering to the tips outlined above, you can ensure that you have taken all the necessary precautions to safeguard your earnings and grow your wealth while managing potential risks. At this point, it is important to emphasize that navigating the share market is not an easy task.

    S.NO.Check Out These Interesting Posts You Might Enjoy!
    1How Does the Stock Market Work in India?
    2Different Types of Trading in the Stock Market
    3Difference Between Intraday Trading and Delivery Trading
    4How to Earn Money in Share Market?
    5What is Delivery Trading?

    Frequently Asked Questions (FAQs)

    1. What is the best way to start investing for a newbie?

      You can go with mutual funds or ETFs, as they manage the risk and provide diversification.

    2. Do I need to wait till I have a big amount of money to begin investing?

      No, you can start right away with SIPs in mutual funds that require as little as 500 rupees every month.
    3. What is the difference between direct equity and mutual funds?

      While direct equity requires you to conduct extensive research to choose the best stocks to mitigate risk, mutual funds allow you to take advantage of diversification and the stock-picking expertise of fund managers.

    4. What are the different ways to invest in the Indian stock market?

      You can invest through direct equities, mutual funds, ETFs, IPOs and other market-linked investment options.

    5. Are mutual funds suitable for stock market beginners?

      Mutual funds can be an option for beginners who prefer diversified investments managed by a professional fund manager.

  • Is It Better To Buy Stocks When The Market Is Up Or Down?

    Is It Better To Buy Stocks When The Market Is Up Or Down?

    It is technical to decide the right time as to when to buy a stock. Your investment’s chances to perform well depend on when you enter the market. Well, when we talk about stock buying, the first question that comes to our mind is whether to buy a stock in a bull run or a bearish trend. 

    No worries! We have got you covered. Below are a few points you could consider before buying stocks in the stock market to clarify when it is the right time to enter the market. In the following blog, the topics that we’ll be covering are:

    • Understanding the market trend
    • Buying stocks in a bull market
    • Buying stocks in a bear market
    • Causes of market correction
    • What to do when the market corrects
    • Conclusion

    Understanding the market trend

    What does it mean when we say the market is up or down? 

    Up trend

    So, when we say that the market is up, it is making higher highs continuously, and we can observe a bull run in the economy. The indexes and stock prices are constantly rising, giving tremendous returns to people who have invested in the favour of the market. For example, before the 1992 Harshad Mehta scam was exposed, we observed a bull run in the economy. 

    Downtrend

    On the other hand, when we say that the market is down, it implies that the market is constantly making lower lows. Thus, we can observe a bearish market movement in the economy. The market indexes and the stock prices of the company are continuously falling. A fun fact about the stock market is that you can make money even in declining markets. You can profit from the market if you short your positions and bet against the rising trend. 

    What moves the market?

    Now that we have understood the meaning of up and down in the market. Let’s discover the reasons for the up or down in the stock market. The stock market works on the simple economics concept of demand and supply. The market forces of demand and supply determine the prices of the stocks. One thing to remember is that the supply for the no. of stock in the stock market is limited as a listed company can only issue a countable number of shares. The demand depends upon the company’s financial performance and the news in the market surrounding it. Generally, we see a rally in share prices when the company declares good financial results. Apart from this, companies announcing dividends, mergers, or acquisitions also significantly impact the price movement. On the contrary, other legal, geopolitical, technological, global, and social factors also affect the markets holistically. 

    Buying stocks in an Up upmarket

    As we have discussed above, about the up trend in the stock market. The bull run generally occurs when the overall economy is strengthening, when the stock prices are up by 20% following a 20% previous decline in the share prices. We can observe a bull run with increased investor confidence in the market; companies will be more willing to launch IPOs, and the businesses will get higher valuations for their equity. 

    Buying stocks during a bull run is considered less risky because it doesn’t make sense for you to sit on the cash pile and ignore the ongoing rally in the market. Investing your money in the stock market when the market is up requires less research. But still, 

    Buying stocks in a down market

    Talking about the downtrend in the market. A downtrend is followed by the 20% fall in the stock prices from the recent highs amid widespread pessimism and negative investor sentiment. Generally, bear runs occur when the overall economy falls, and rising unemployment persists in the nation. Another definition of a bear market is when investors are more risk-averse than risk-seeking.

    Buying stocks when the overall market is down is a strategy opted by various big investors, as when the whole economy is down, you could get shares at a discounted price than their real worth.

    Causes of Market Correction

    Causes of Market Correction

    Market corrections are generally short-term in nature. However, chances are likely that corrections can be a call for the bearish market. But in the long run, markets and stocks manage to retrieve their original levels once the correction is over. A correction is generally a 10% to 20% drop in value from a recent peak. Corrections are seen on the stock indexes or even on the shares of your favourite company. Some of the causes of market correction are listed below.

    1. Not-so-favourable economic data like job reports, lower GDP, etc. 
    2. A change in interest rate by the central bank (RBI in India) eventually makes it difficult for consumers to get loans at a lower rate.
    3. Political instability, conflicts, trade tensions, or unexpected geopolitical events can create market uncertainty and fear.
    4. Lower earnings from the part of top-performing companies represent the benchmark for the performance of the indices.
    5. General profit booking at the market’s highs and some technical indications like a bearish candlestick pattern can also lead to market corrections.

    A market correction can be quite challenging, but you do not need to start liquidating your portfolio or selling your assets (unwanted selling during a market correction can lead to realizing losses); instead, consider it an opportunity to enter the market at lower valuations.

    Read Also: What Is The Gap Up And Gap Down Strategy?

    What to do when the market corrects?

    what to do when the market corrcts

    We have mentioned earlier that there are typically two types of participants in the market i.e., trader and investor. From the point of view of a trader, one needs to analyse the technical charts and patterns, book their unrealised gains and start looking for some other trading opportunity. But an investor needs to have a long-term mindset and he should have a well-thought-out plan in place to navigate market corrections. Investors generally consider market corrections as a fortunate action since it provides them with an opportunity to buy on dips or lows.

    Investors generally develop a curated portfolio with a dynamic allocation of assets. Our suggestion to the investor would be to stick to the investment strategy which they initially adopted and instead of realising your gains, average the stocks that you are holding in your portfolio.

    (Note- Averaging is buying more stocks when the price of the stock falls since it lowers the overall buy price of the stock that an investor holds.) Market corrections are like second chances for investors since they get an opportunity to re-evaluate their holdings analyse the stocks that have underperformed and adjust the holding as per their risk appetite. The market has historically recovered and continued to grow over the long term. Avoid making knee-jerk reactions based on short-term events. If you are an investor, you should have an ample amount of funds or sufficient cash in hand so that you can either average the existing stocks or buy any fresh stocks since portfolio readjustment is a part of happy investing.

    Read Also: What is a good rule for investing in stocks?

    Conclusion

    conclusion

    We all know that market corrections are inevitable, and one should keep their emotions in check while trading or investing in the market. When the market bottoms itself out, leave your holdings in isolation and do not try to time the markets because sometimes anticipating corrections creates more loss than the actual correction. Buying on dips will help you create wealth, and buying on lows will help you generate short-term profits.

    For example, if someone had invested in the market during the 2008 global financial crisis or COVID-19, the returns generated on his/her portfolio would have been phenomenal. This is the power of the stock market. To conclude, always invest or trade as per your risk appetite and financial goals. The market will always give you second chances to buy stocks at their highs or lows. Decisions and capital are all yours!

    Successful investing requires patience and discipline.

    FAQs (Frequently Asked Questions)

    1. What are the two categories of capital markets?

      Two categories of capital markets are primary market and secondary market.

    2. Define Correction.

      A correction is generally a 10% to 20% drop in value from a recent peak.

    3. Mention two causes of market correction.

      Two causes of market correction are stock earnings and changes in interest rates.

    4. What is the averaging of stocks?

      Averaging means buying more stocks when the market is down.

    5. When should we buy a stock while investing?

      While investing in the stock market, one should buy according to their risk tolerance, investment horizon and capital.  

    Selection Methodology and Important Disclaimer

    The stocks included in this list are selected primarily on the basis of their market capitalisation, which represents the total market value of a company’s outstanding shares. The companies are arranged in descending order of market capitalisation, with larger companies appearing first, followed by relatively smaller companies. This methodology is intended to provide a structured approach for identifying companies based on their market size and overall presence within a sector.

    However, market capitalisation should not be considered the sole factor while evaluating investment opportunities, as it does not guarantee future performance, profitability, or returns. Investors should also assess other important factors such as financial health, business fundamentals, management quality, valuation metrics, industry outlook, and market conditions before making investment decisions.

    The information provided is for educational and informational purposes only and should not be construed as investment advice, recommendation, solicitation, or an offer to buy or sell any securities by Pocketful Fintech Capital Private Limited.
  • Fibonacci Retracement – Meaning, How to Use & Strategy

    Fibonacci Retracement – Meaning, How to Use & Strategy

    The origin of the Fibonacci series can be traced back to the ancient Indian mathematic scripts. This series was first introduced by an Italian mathematician Leonardo of Pisa, who was also known as Fibonacci. He lived from the late 12th century to the 13th century. His seminal work, “Liber Abaci” (The Book of Calculation), which was published in 1202 helped him introduce the Fibonacci sequence to Europe. The Fibonacci sequence is a series of numbers in which each number is the sum of the two previous numbers, generally starting with 0 and 1. The Fibonacci series is a set of infinite numbers i.e., no matter how many numbers you add to the series, it never ends.  

    Fibonacci Retracement

    The Fibonacci series is as follows,

    (0, 1, 1, 2, 3, 5, 8, 13, 21, 34, 55, 89, 144, 233, 377)

    In the above set of numbers if you divide any number by the previous number; the ratio is always around 1.618. The Golden Ratio, approximately 1.618, also called Phi is a mathematical constant derived from the Fibonacci sequence. It has many applications in nature, art, and science. Our readers need to keep in mind that 0.618, when expressed in percentage is 61.8%. A number divided by the next highest number comes near to .6180

    (13/21=.6190, 21/34=.6176, 34/55=.6181, 55/89=.6179). The estimate nears 0.6180 as the numbers increase. This forms the base for the 61.8% retracement. A number divided by another two places higher comes near to .3820

    (13/34=.382, 21/55=.3818, 34/89=.3820, 55/=144=3819). This is the base for the 38.2% retracement

    A number divided by another three places higher comes near to .2360

    (13/55=.2363, 21/89=.2359, 34/144=.2361, 55/233=.2361).  

    What is Fibonacci Retracement?

    fibonacci retracemnet

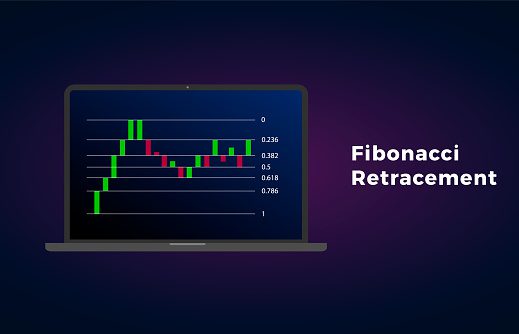
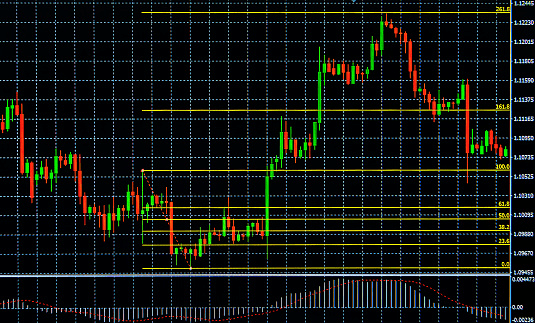
    Fibonacci retracement is an indicator of technical analysis that is used in the stock market. The purpose of this tool is to recognize potential support and resistance levels in a candlestick chart of different financial assets. It is constructed on the Fibonacci sequence and the Golden Ratio, and it is a well-known indicator among traders and technical analysts.

    Calculation Of Fibonacci Retracement

    Calculation Of Fibonacci Retracement

    The commonly used retracement levels by analysts are 23.6%, 38.2%, 50.0%, 61.8%, and 76.4%.

    Any trader needs to follow these steps to calculate the retracement levels of a particular stock.

    Step 1. You need to identify a significant price move on your chart. This move can be either an uptrend or a downtrend. The starting point that a trader marks on the chart after applying the indicator should be a significant swing high or swing low.

    Step 2. Determination of the Fibonacci Ratios

    23.6% (0.236): we calculate this level by taking 23.6% of the pre-decided price range and adding it to the low point of an uptrend or subtracting it from the high point for a downtrend.

    38.2% (0.382): To Calculate 38.2% of the price range the trader needs to follow the same addition or subtraction technique as above.

    61.8% (0.618): To Calculate 61.8% of the price range use the same addition or subtraction method as above.

    Other levels of the Fibonacci Retracements like 50% or 76.4% are also calculated similarly.

    Step 3. Once you are done with the calculation of retracement levels start drawing horizontal lines at the calculated Fibonacci retracement levels. These lines represent the support and resistance levels for future price action that is expected to happen.

    Now, start observing how the price of the asset reacts to these retracement levels. Any kind of bounce or reversal near these levels may provide buyers and sellers with some good trading opportunities.

    Example of Fibonacci Retracement:

    Let us understand Fibonacci Retracement with an easy and simplified example

    Suppose you have identified a swing low of Rs.1000 and a swing high of Rs.1500 in an uptrend of a stock.

    After determining these points, you need to calculate the price range by subtracting the swing low from the swing high

    which implies that the price range will be (Rs.1500 – Rs. 1000) which equals Rs. 500

    Having found the difference between the price ranges you can now calculate the retracement levels

    Firstly, calculate 23.6% of the price range and add it to the swing low i.e., 23.6%*500=118+1000=1118

    Then calculate 38.2% of the price range and add it to the swing low i.e., 38.2%*500=191+1000=1191

    Now for the retracement level of 50%, divide the price range by 2 and add it to the swing low i.e., 500/2=250+1000=1250.

    Similarly, calculate the 61.8% of the price range and add it to the swing low i.e., 61.8%*500=309+1000=1309

    The values so derived (1118, 1191, 1250 and 1250) are the expected retracement levels.

    Since we all know that Fibonacci retracement is a leading indicator as well as a widely used and famous tool in technical analysis applied by traders, it also has some advantages and limitations that traders should keep in mind before making any sort of trading decision.

    Advantages of Fibonacci Retracement

    Advantages of Fibonacci Retracement

    Traders commonly value the following advantages of Fibonacci retracement

    1. Fibonacci retracement can be applied to various financial markets, including stocks, commodities, forex, and cryptocurrencies, on different timeframes like hourly, daily, weekly, and monthly, making it a multipurpose indicator for technical analysts.
    2. Traders use Fibonacci retracement in combination with other technical analysis tools, such as trendlines, moving averages, or oscillators. When different indicators give the same indication, like Fibonacci, chances are that the stock will move in the desired direction.
    3. Fibonacci retracement is used by traders to identify stop-loss orders range as per their risk levels.
    4. Fibonacci retracement can be used to identify potential profit targets. Traders often use the levels as reference points for setting profit targets.
    5. Fibonacci retracement is particularly useful for swing traders who often look for short- to medium-term price movements to earn from the stock market.

    Disadvantages of Fibonacci Retracement

    Disadvantages of Fibonacci Retracement
    1. Selecting the starting and ending points for the Fibonacci retracement analysis can be a tough task. It depends from trader to trader on what point they are choosing, which can eventually lead to varying retracement levels and trading decisions. This can lead to unnecessary confusion.  
    2. Relying solely and completely on Fibonacci retracement may lead to false buy or sell signals or missed trading opportunities.
    3. Even though traders use this indicator widely, there is no assurance that the price will precisely bounce at the estimated Fibonacci retracement levels.
    4. Fibonacci retracement may be difficult for beginner traders to understand since it might be confusing for them to choose the swing high or swing low.  
    5. Different timeframes can yield different retracement levels. Traders may face variations in levels on daily, weekly, or intraday charts.

    Relation between Fibonacci Series and Fibonacci Retracement

    The Fibonacci series and the numbers derived from it, such as the Golden Ratio (1.618), are used in the construction of Fibonacci retracement levels.

    The important retracement levels in Fibonacci retracement are ratios that are derived from the Fibonacci series. For example, the 61.8% retracement level corresponds to the inverse of the Golden Ratio (1/1.618).

    Fibonacci retracement is a real-world application of the Fibonacci series in technical analysis. Traders use the Fibonacci series and its ratios to find levels of support and resistance in financial markets for making sound trading decisions.

    Read Also: 5 Must-Read Best Swing Trading Books for Trader

    Conclusion

    conclusion

    Remember that the effectiveness of Fibonacci retracement levels varies, and they should be used in combination with other technical analysis indicators and risk management strategies to make informed trading decisions. Additionally, the choice of starting and ending points can be somewhat subjective, so practice and experience are essential when applying Fibonacci retracement in real trading sessions.

    FAQs (Frequently Asked Questions)

    1. Which are the most popular Fibonacci retracement levels?

      The most popular Fibonacci levels are 0.236, 0.382, 0.618.

    2. Is Fibonacci a leading or lagging indicator?

      Fibonacci is a leading indicator.

    3. Can I use Fibonacci in intraday trades?

      Yes, Fibonacci can be used on various timeframes including intraday.

    4. Who discovered the Fibonacci series?

      Leonardo Pisano discovered the Fibonacci series in the 12th century.

    5. What is the Fibonacci Series?

      The Fibonacci sequence is a series of numbers in which each number is the sum of the two preceding ones, typically starting with 0 and 1.

  • What is ATR (Average True Range): Calculation, Advantages & Disadvantages Of ATR

    What is ATR (Average True Range): Calculation, Advantages & Disadvantages Of ATR

    In our previous blogs, we have discussed about stocks and technical analysis.

    For reference, here are some insights into technical analysis.  

    Technical Analysis

    Technical analysis is a method of analysing financial markets and making trading or investment decisions based on the historical price. It is primarily focused on studying past price movements and chart patterns to predict future price direction. Technical analysts identify support and resistance levels, which are price levels where an asset tends to find buying or selling pressure, respectively. Various technical indicators, including moving averages, Relative Strength Index (RSI) and Moving Average Convergence Divergence (MACD), provide quantitative measures of price momentum. The average true range is one such technical indicator. Let us go through an in-depth analysis of ATR.

    What Is ATR (Average True Range)

    What is ATR?

    ATR Average true range

    The Average True Range (ATR) is a technical indicator used in the analysis of stocks, primarily for estimating the volatility and price range of an asset. Developed by J. Welles Wilder in his book “New Concepts in Technical Trading Systems.” ATR is a valuable instrument for traders and investors to measure market conditions and manage risk.

    Here are the key points about the Average True Range:

    1. The ATR is designed to measure the volatility of an asset, representing the average range between the daily high and low prices. A higher ATR value indicates greater volatility, while a lower value indicates lower volatility.
    2. The ATR is derived from the True Range, which is the greatest of the following three values:
    • The current day’s high minus the current day’s low.
    • The absolute value of the current day’s high minus the previous day’s close
    • The absolute value of the current day’s low minus the previous day’s close.
    1. To calculate the Average True Range, a moving average is taken of the True Range values over a specified period. The most commonly used period is 14 days, but traders can adjust this period as per their preferences.
    2. Higher ATR values imply that the asset is going through greater price fluctuations, which can be understood as increased uncertainty or risk. Lower ATR values indicate relatively stable or less volatile market conditions.
    3. A rising ATR can confirm the strength of a trend, especially when in combination with other technical indicators. It suggests that the market is experiencing strong price movement.
    4. The choice of the ATR’s look-back period depends on the trader’s goals and time period. Shorter periods provide more responsive values, while longer periods offer a smoother, more stable measure of volatility.

    The Average True Range is a multipurpose tool of technical analysis that when used in combination with other indicators and strategies can help in making informed trading decisions. It helps traders better analyse and manage the risks linked with market volatility, allowing for more precise stop-loss and position sizing.

    Read Also: Best Options Trading Chart Patterns

    Calculation of ATR.

    calcualtion of ATR

    The Average True Range (ATR) is calculated by following a specific formula. It involves several steps and the use of True Range values for a selected number of periods.

    Here’s the formula and a step-by-step explanation of how to calculate the ATR:

    Step 1:

    Calculate True Range (TR)

    True Range represents the greatest of the following three values for a given trading period.

    1. The difference between the current day’s high and the current day’s low.
      (Current Day’s High – Current Day’s Low)
    2. The absolute value of the difference between the current day’s high and the previous day’s close
      (Current Day’s High – Previous Close)
    3. The absolute value of the difference between the current day’s low and the previous day’s close. (Current Day’s Low – Previous Day’s Close)

    Step 2:

    Calculate the Average True Range (ATR)

    The ATR is calculated as a moving average of True Range values over a specified number of periods (usually 14 days is the default period).

    Here’s how to do it:

    1.   Select the number of periods (e.g., 14).

    2.   For the first True Range value (TR1), simply take the TR of the first period.

    3.  For the next ATR calculations, use the following formula:

    • ATR = [(Prior ATR x 13) + Current TR] / 14
    • Where “Prior ATR” is the ATR value calculated for the previous period, “Current TR” is the True Range value for the current period, and “14” represents the selected number of periods.

    The process is repetitive for each subsequent period. Then continue to calculate the ATR by using the prior ATR and the current True Range.

     Here’s an example to illustrate the calculation of the ATR:

    Let’s say we want to calculate the 14-day ATR of a stock:

    Day 1:

    ATR1 = 2 (True Range for the first day)

    Day 2:

    ATR2 = [(2 x 13) + 4] / 14 = 2.07

    Day 3:

    ATR3 = [(2.07 x 13) + 3] / 14 = 2.01

    Day 4:

    ATR4 = [(2.01 x 13) + 6] / 14 = 2.06

    The ATR value provides an indication of the average price range and volatility over the selected number of periods. Traders use it to assess the level of price volatility, set stop-loss levels, and determine position sizes based on their risk tolerance.

    Advantages & Disadvantages Of ATR

    Pros and cons ofusing ATR

    The Average True Range (ATR) is a widely used technical indicator in trading and investing. Like most tools, it comes with its own set of advantages and limitations.  

     Here are the advantages and disadvantages of using the ATR:

    Advantages of ATR:

    • ATR is a purely mathematical indicator, which means it provides objective data. It’s not influenced by subjective opinions or emotions, making it a reliable tool for risk management.
    • Traders can adjust the look-back period for the ATR to match their specific trading strategies and time horizons. Common periods include 14 days, but you can choose longer or shorter periods based on your needs.
    • A rising ATR often indicates increased price volatility, which can confirm the strength of a trend. This is especially useful for trend-following traders.

    Disadvantages of ATR:

    • ATR is based on historical price data, and it doesn’t predict future price movements. It provides information about past volatility, which may not always reflect current or future market conditions.
    • Like many technical indicators, the ATR is a lagging indicator, which means it reacts to price movements that have already occurred. This lag may limit its effectiveness in rapidly changing or highly volatile markets.
    • ATR can generate false signals, especially in choppy or sideways markets. Traders need to use it in conjunction with other indicators or tools to minimize false signals.
    • For beginners, the concept of ATR and its calculations can be complex. Understanding how to use ATR effectively may require some time and practice.
    • ATR provides information on volatility but doesn’t offer insights into other important factors like trend direction, market sentiment, or the potential impact of news events.

    Conclusion

    CONCLUSION

    To conclude, the ATR is a valuable tool for traders and investors looking to measure and manage volatility and risk. However, it’s essential to use it in combination with other indicators and analyse it carefully to create a comprehensive trading or investment strategy. Additionally, identifying its limitations can help the investor to use it effectively and in a much better way.

    Read Also: Rising Window Candlestick Pattern

    FAQs (Frequently Asked Questions)

    1. What is the full form of ATR?

      ATR stands for Average True Range.

    2. What is prior ATR?

      Prior ATR” is the ATR value calculated for the previous period.

    3. Who developed ATR?

       ATR was Developed by J. Welles Wilder in his book “New Concepts in Technical Trading Systems”.

    4. What is the default period of true range for calculating ATR?

      The default period of the true range for calculating ATR is 14 days.

    5. Is ATR a leading or lagging indicator?

      ATR is a lagging indicator.

  • Open Free Demat Account

    Join Pocketful Now

    You have successfully subscribed to the newsletter

    There was an error while trying to send your request. Please try again.

    Pocketful blog will use the information you provide on this form to be in touch with you and to provide updates and marketing.