Category: Investing

  • Top 10 Largest Economies in the World 2026

    Top 10 Largest Economies in the World 2026

    The global economy in 2026 is very different from what many people anticipated three years ago. Some that were expected to dominate are now dealing with internal problems nobody saw coming. And then there is India, crossing one of its biggest economic milestones in recent history.

    If you have ever wondered which countries are running the global economy right now, this blog breaks it down simply. 

    But how do we measure which economy is bigger than the other? That is where GDP comes in. 

    What is GDP? 

    It stands for Gross Domestic Product.  It is basically the total value of everything a country produces, goods, services, everything in a year. 

    How to Calculate?

    GDP = C + I + G + X

    Where, 

    • C = Household Consumption 
    • I  = Business Investments 
    • G = Government Spending
    • X = Net exports (what the country sells to the world less what it buys)

    List of Top 10 Economies in the World 2026 – At a Glance

    RankCountryNominal GDP (USD Trillion)GDP Growth (in%)
    1United States$32.380.0232
    2China$20.850.0441
    3Germany$5.450.0079
    4Japan$4.380.0072
    5United Kingdom$4.260.008
    6India$4.150.0648
    7France$3.600.0086
    8Italy$2.740.0052
    9Russia$2.660.0109
    10Brazil$2.640.0191

    Note: All rankings in this blog are based on Nominal GDP, because it reflects actual market value in current US Dollars, making it the standard used by the IMF, World Bank, and most financial institutions. 

    Overview of Top 10 Economies in the World

    1. United States 

    The US has been at the top for so long. But the numbers are genuinely staggering. The American economy alone makes up about 26% of the entire world’s GDP.

    What keeps it there? 

    Liquid capital markets, innovations, strong consumer spending, and the US dollar. 

    Nearly 59% of global foreign exchange reserves are held in dollars. That gives America a structural advantage that no other country currently has.

    India’s IT sector earns a huge chunk of its revenue from American clients. Indian startups dream of NASDAQ listings. 

    2. China 

    For years, China’s plan was simple: manufacture everything, export aggressively, and grow fast, which also kind of worked for them.  China contributes around 35% of total global manufacturing output. Semiconductors, batteries, steel, electronics. It is at the centre of the most global supply chains. 

    But 2026 has been rough for China. Youth unemployment that’s higher than the government would like, and ongoing trade restrictions from the US and Europe are not going away anytime soon. This is why many global companies are now following a “China+1” strategy, i.e., they want a backup manufacturing location outside China. India is one of the top candidates for that.

    3. Germany 

    For some, Germany at number three comes as a surprise, but the rationale behind this is apparent. 

    Whether it’s cars, industrial machines, chemicals or medicines, German engineering is world-class. Brands such as Siemens, BMW, and BASF are not just companies; they are some of the best in the world.

    The country also accounts for about 24% of the EU GDP, and it is the backbone of the stability of the European economy. 

    However, Germany hasn’t done very well in the last couple of years. Germany, too, was affected by high energy prices following the Russia-Ukraine conflict. 

    Growth has been weak. The question now is whether Germany can transform itself for the next decade.

    4. Japan 

    The country built its economic reputation on electronics, robotics, and automotive engineering. Global giants like Sony, Toyota, Honda, and Nintendo belong to Japan. Japan also has one of the highest savings rates in the world, which funds massive domestic investment.

    The problem Japan has been dealing with for decades is demographic. The population is ageing and shrinking. Fewer workers, lower consumption, and a government that’s had to get very creative with monetary policy just to keep things moving.

    5. United Kingdom 

    Brexit changed things for the UK more than many of its supporters expected. After leaving the European Union’s single market, goods exports dropped significantly. 

    The UK still has strengths. London remains one of the world’s top financial centres. Legal and professional services are world-class, including innovation in pharmaceuticals and technology. 

    6. India 

    While India is currently 6th in nominal size, it has the highest GDP growth rate of 6.48% among all the top countries. This one deserves a moment, and if you are an Indian and reading this, it is worth appreciating.

    The major growth drivers are the service sectors’ software exports, and PLI schemes have been fruitful for sectors like electronics, mobile phones, and auto components. Infrastructure spending has increased significantly. Digital adoption from UPI payments to ONDC is at its peak. 

    However, GDP per capita in India is still quite low. Income inequality remains a serious concern. But for investors, the macro picture is encouraging.

    7. France 

    France has a very specific economic identity spanning its luxury goods, aerospace, defence, and agriculture sectors. It is the world’s top exporter of luxury products, from fashion to wine to perfume.

    It is also responsible for nearly 10% of European arms exports in the 2020-24 period and around 16% of the EU’s total GDP.

    The economic fundamentals are sound, but in recent years, political instability has been an issue. 

    8. Italy

    It is among those countries that have been suffering from the same structural issues for a long time: high public debt, low productivity growth and an outdated banking system that should have been fixed many years ago.

    The global financial crisis of 2008 seriously affected Italy, and it took nearly 20 years for the country to recover. However, 2026 is showing some signs of stabilisation. 

    Tourism has recovered very well. Luxury exports continue to hold up. Additionally, the government is estimating growth of approximately 3% over the next few years.

    9. Russia

    Despite the strong Western sanctions imposed after the Ukraine conflict, the Russian economy has been fueled by oil and gas revenues. Russia is among the top crude oil, natural gas, wheat and fertiliser producers in the world. Global commodity demand, especially from Asia and the Middle East, has continued to flow to Russia.

    That said, the long-term picture is complicated. International isolation has cut Russia off from Western technology, foreign investment and financial systems.

    Russia is less important to the global economy now as a trading partner and more important as a variable that influences energy prices, food security and geopolitical stability, all of which have knock-on effects on markets everywhere, including India.

    10. Brazil

    Brazil closes out the top ten as Latin America’s largest economy.  It is the world’s third-largest food exporter of soybeans, beef, sugar, coffee, and a major supplier of iron ore and oil.

    Brazil’s economic ranking has bounced around over the years because of political volatility and governance challenges. But the global commodity demand cycle has worked in Brazil’s favour recently, and GDP growth projections for the coming years look more optimistic.

    Read Also: Fastest Growing Industries in India

    India’s Bigger Picture

    Let us come to India for a moment, because it is the most important part of this story for us.

    It is not just symbolic to cross Japan. It shows a real change in the structure. Global companies are investing in Indian manufacturing at a pace we have not seen before. Foreign portfolio investors are increasingly viewing Indian equities as a core allocation and not just an emerging market. The role of the rupee in the settlement of international trade is gradually increasing.

    The IMF forecasts India’s economy to grow at a CAGR of over 10% till 2029. If that is the case, we will be challenging Germany for third place within a decade. There is no guarantee, of course, and growth forecasts are always surrounded by a certain degree of uncertainty, but the direction is clear.

    For retail investors in India, to invest in a country whose economic weight is growing in the world is a very different thing from investing in a country that is stagnating. 

    Conclusion 

    The world’s top 10 economies together account for roughly 67% of global GDP. The decisions made in Washington, Beijing, Berlin, and Tokyo ripple across every market on the planet, including Indian Markets.

    What is different in 2026 is India’s rise from a promising emerging market to the world’s fourth-largest economy. This is one of the more important economic stories of this decade.

    Staying informed about where global economic power is, and where it is heading, is interesting and useful, actually useful for anyone trying to make smarter financial decisions.  

    S.NO.Check Out These Interesting Posts You Might Enjoy!
    1Top 10 Richest People in the World 2026
    2Top Assets by Market Cap Worldwide
    3Top 10 Richest Persons in India
    4Top 10 Most Traded Commodities in the World
    5Top 10 Sectors in the Indian Stock Market

    Frequently Asked Questions (FAQs)

    1. What is the largest economy in the world in 2026?

      The US has been at number one for so long.

    2. What is India’s rank among the world’s largest economies in 2026?

      India is 6th. Ten years ago, if you had told someone this, they probably would not have believed it.

    3. What is nominal GDP?

      It is like a country’s annual income, all of the things it produces and sells in a year, valued at current prices in US dollars.  

    4. What country replaced Canada in the top 10?

      In 2026, Russia replaced Canada, largely due to oil, gas and wheat exports.

    5. Is India going to become the 3rd largest economy?

      Yes, it is really possible. Will it work smoothly? Most likely not. There will be bumps on the road ahead. But the direction is obvious. 

  • Electronic Gold Receipts (EGR): Benefits, Tax & How It Works

    Electronic Gold Receipts (EGR): Benefits, Tax & How It Works

    The way people invest in gold is changing. Through Electronic Gold Receipts (EGRs), ownership linked to physical gold can be held and traded in electronic form. In this blog, we will understand what EGRs are, how they work, how they are bought and traded, how they can be converted into physical gold, and how they differ from digital gold and Gold ETFs.

    What Are Electronic Gold Receipts (EGRs)? 

    An Electronic Gold Receipt (EGR) is an electronic receipt issued against physical gold deposited in a vault. Under the SEBI framework, an EGR is classified as a security and can be traded on the EGR segment of a recognized stock exchange. Physical gold is held in the vault to back every EGR.

    Let us understand the EGR concept with a simple example:

    Suppose an individual has gold deposited in an authorized vault. The Vault Manager creates an EGR by recording the details of the gold, which is then credited to the investor’s demat account through a depository. Subsequently, the EGR can be bought or sold on the stock exchange. As per the regulations, the underlying physical gold can also be withdrawn by surrendering the EGR.

    What happens in the EGR?Simple meaning
    Physical goldIt is kept safe in the vault.
    EGRElectronic record/receipt of that gold
    Demat accountThe EGR is held in electronic form.
    Stock exchangeEGRs can be traded.
    Physical withdrawalGold can be extracted by completing the applicable process.

    How Does an EGR Work?

    The entire EGR process can be understood in three simple stages: depositing physical gold, trading the EGR, and if needed taking delivery of the physical gold. The journey of an EGR follows this same path under the SEBI framework.

    Step 1: Physical Gold is Deposited in the Vault

    First, eligible gold is deposited with a SEBI-registered Vault Manager. The Vault Manager verifies the gold’s quantity, weight, purity, and the necessary documentation. The gold is then stored in the vault through an authorized process.

    Step 2: EGR is Created Against the Gold

    Once the gold is accepted, the Vault Manager creates an Electronic Gold Receipt (EGR) against it via the depository’s system. This receipt records details such as the gold’s quantity, weight, purity, and information regarding the vault. The EGR is then held in the investor’s demat account in electronic form.

    Step 3: EGR is Traded on the Stock Exchange

    The EGR can now be bought and sold on the applicable stock exchange segment. Following the trade, the clearing corporation settles the transaction handling the exchange of the EGR and the payment between the buyer and the seller. This means the investor does not need to physically pick up or transport the gold for every transaction.

    Step 4: Physical Gold Can Be Redeemed if Needed

    If an EGR holder wishes to obtain physical gold, they can place a request through the depository. Subsequently, the Vault Manager delivers the physical gold, and the corresponding EGR is extinguished; this means that specific EGR is no longer available for further trading.

    Who Are the Key Participants in the EGR Ecosystem? 

    The EGR system does not operate through a single entity alone; it involves multiple participants, ranging from vaults to stock exchanges and depositories. Each participant has a specific role, ensuring the entire system bridging physical gold and electronic receipts functions smoothly.

    1. Vault Manager – Safekeeps the Gold

    The Vault Manager is the entity responsible for storing the eligible physical gold in a vault. It manages the custody of the gold, maintains records, and handles processes essential to the EGR. Simply put, the physical gold backing the EGR is kept secure within the vault under this arrangement.

    2. Depository – Manages Electronic Records of EGRs

    The Depository maintains records related to the electronic holding and transfer of EGRs. When an EGR is created, its electronic ownership is recorded within the depository system.

    3. Stock Exchange – Facilitates EGR Trading

    The stock exchange is the platform where EGRs can be bought and sold. This means an investor does not need to find a buyer for physical gold; instead, EGRs are traded through the exchange’s established mechanisms.

    4. Clearing Corporation – Settles Trades

    When EGR trading takes place, the Clearing Corporation handles the clearing and settlement processes. Its role is to ensure the transaction between the buyer and the seller is completed in an orderly manner.

    5. Investor – Holds and Trades EGRs

    Finally, the investor can hold EGRs in their demat account, trade them on the exchange, or submit a conversion request to obtain physical gold in accordance with the applicable procedures.

    Read Also: Gold Price History in India (1964-2026)

    What Makes EGR Different From Physical Gold? 

    Both EGRs and physical gold are linked to gold, but the methods of holding and using them differ. Physical gold is held in the form of jewellery, coins, or bars, whereas an EGR is an electronic security that is kept in a demat account and traded on an exchange. The physical gold backing the EGR is stored in a vaulting system.

    BasePhysical GoldEGR
    Form Jewellery, coin or barElectronic security
    Storage With you or at a place of your choiceUnderlying gold is stored in a vault
    Trading Through a jeweller or dealerThrough a stock exchange
    Demat AccountNot requiredRequired for exchange trading
    Physical GoldAlready in your possessionCan be taken through the applicable process
    PurityDepends on the product and the seller.Based on the applicable EGR product specifications

    EGR vs Digital Gold vs Gold ETF: What’s the Difference? 

    All three are linked to gold, but they differ in structure and usage. EGR is a security backed by physical gold, Digital Gold is a product offered by various providers, whereas a Gold ETF offers investment in gold through a mutual fund structure. Therefore, it would be incorrect to consider them the same thing. SEBI has also distinguished Digital Gold from its regulated gold products, such as EGRs and Gold ETFs.

    Feature EGR Digital GoldGold ETF
    What you holdPhysical gold-backed electronic securityProvider-based digital gold productMutual fund units representing gold exposure
    Trading On the stock exchangeGenerally via a platform or app.On the stock exchange
    Demat AccountRequired Generally not requiredRequired 
    Physical GoldUnder the EGR framework, the underlying gold remains in the vault.It depends on the provider’s terms.In an ETF structure, gold is the underlying asset.
    RegulationSEBI-regulated securityNot a SEBI-regulated productSEBI-regulated mutual fund product
    Main purposeTrading gold in electronic form on an exchangeFacility to purchase digital gold in small amountsGold price exposure through an ETF

    What Are the Benefits of Electronic Gold Receipts? 

    The primary advantage of EGR is that gold can be held and traded in electronic form rather than being handled physically. This offers several practical benefits:

    • Easy Exchange-Based Trading: EGRs can be bought and sold on recognized stock exchanges. This reduces the reliance on jewellers or local dealers for gold trading.
    • No Need for Physical Gold Storage: Investors holding EGRs do not need to store the underlying gold at home. The physical gold is kept in a vaulting system, while the EGR is held in demat form.
    • Transparent Price Discovery: EGRs are traded on exchanges, where the gold price is determined based on market demand and supply between buyers and sellers.
    • Option to Obtain Physical Gold: If an investor wishes to acquire physical gold later, they can take delivery of the gold by surrendering the EGR in accordance with the applicable process. Relevant charges and product conditions may apply.
    • Standardized Gold: The EGR framework establishes specific standards and product specifications for eligible gold. This ensures a standardized framework regarding the quality and denomination of the gold.

    What Are the Risks or Limitations of EGRs? 

    The fact that EGRs are regulated does not make them risk-free. It is important to understand certain practical limitations before investing in them.

    • Gold Price Risk: The market value of an EGR is influenced by the price of gold. If the price of gold falls, the value of the EGR may also decline. Therefore, it should not be viewed as a fixed-return investment.
    • Liquidity May Vary: Although EGRs are traded on exchanges, there is no guarantee that sufficient buyers and sellers will be available at all times. Low trading activity can make it difficult to sell EGRs at the desired price.
    • Trading and Withdrawal Charges: In addition to brokerage fees, there may be charges associated with the exchange, depository, or physical gold withdrawal. According to SEBI regulations, the Vault Manager may levy charges for the withdrawal of physical gold.
    • Conditions for Physical Gold Withdrawal: While it is possible to convert EGRs into physical gold, this is subject to applicable denominations, exchange rules, and the vault’s withdrawal process. It should not be considered equivalent to instant delivery.
    • Discrepancy Between Market Price and Gold Price: Since EGRs are traded on exchanges, their actual trading price is influenced by market demand and supply. Consequently, the trading price of an EGR does not necessarily always match the quoted price of physical gold.

    Read Also: Why Are Gold Prices Rising in India?

    How Can an Investor Buy or Trade EGRs? 

    To purchase EGRs, you do not need to buy physical gold and store it in a vault; you can trade them on the stock exchange just like any other security. The basic process is as follows

    Step 1: Open Trading and Demat Accounts

    First, open trading and demat accounts with a stock broker that offers trading facilities in the EGR segment.

    Step 2: Complete KYC

    Submit the necessary KYC details and documents during the account opening process. You can begin trading once the account is activated.

    Step 3: Check EGR Availability with the Broker

    Check your broker’s trading platform to see if the EGR segment is available, as not all brokers offer this facility.

    Step 4: Select the EGR

    Review the details of the available EGR products such as denominations and specifications and select the one that meets your requirements.

    Step 5: Place a Buy Order

    Go to your trading account and place a buy order for the EGR. The order will be executed on the exchange based on the applicable price and market conditions.

    Step 6: Hold EGRs in Your Demat Account

    Once the trade is settled, the purchased EGRs will appear in your demat account in electronic form.

    Can EGR Be Converted Into Physical Gold? 

    Yes, EGRs can be converted into physical gold, but this requires following the withdrawal process of the applicable EGR product and the exchange.

    How does the conversion take place?

    • Withdrawal Request: The EGR holder submits a request for physical gold through the depository.
    • Vault Manager: The depository forwards the request to the relevant Vault Manager.
    • Gold Delivery: The Vault Manager delivers the physical gold in accordance with the applicable process.
    • EGR Extinguishment: Upon receipt of the gold, the corresponding EGR is extinguished; meaning, it can no longer be traded.

    How Is EGR Taxed in India? 

    • Short-Term Capital Gain (STCG): If EGR is held for 24 months or less and sold at a profit, it is classified as STCG. This profit is taxable according to your applicable income-tax slab rate.
    • Long-Term Capital Gain (LTCG): If EGR is held for more than 24 months, the profit is classified as LTCG. A tax rate of 12.5% ​​applies to this, without the benefit of indexation.
    • On Conversion of EGR to Physical Gold: Merely converting EGR into physical gold is not considered a transfer. Therefore, capital gains tax is not levied immediately at the time of conversion.

    Read Also: Why Is the Gold Price Going Down?

    Conclusion

    EGR offers a distinct way to invest in gold through an electronic, exchange-based mechanism. In this setup, the physical gold remains in a vault, while the investor can trade the EGR. If you are considering investing in gold, it is advisable to make a decision only after understanding the benefits, charges, risks, and tax rules associated with EGRs.

    Gold Rate in Top Cities of IndiaSilver Rate in Top Cities of India
    Gold rate in AhmedabadSilver rate in Ahmedabad
    Gold rate in AyodhyaSilver rate in Ayodhya
    Gold rate in BangaloreSilver rate in Bangalore
    Gold rate in BhubaneswarSilver rate in Bhubaneswar
    Gold rate in ChandigarhSilver rate in Chandigarh
    Gold rate in ChennaiSilver rate in Chennai
    Gold rate in CoimbatoreSilver rate in Coimbatore
    Gold rate in DelhiSilver rate in Delhi
    Gold rate in HyderabadSilver rate in Hyderabad
    Gold rate in JaipurSilver rate in Jaipur
    Gold rate in KeralaSilver rate in Kerala
    Gold rate in KolkataSilver rate in Kolkata
    Gold rate in LucknowSilver rate in Lucknow
    Gold rate in MaduraiSilver rate in Madurai
    Gold rate in MangaloreSilver rate in Mangalore

    Frequently Asked Questions (FAQs)

    1. What is an Electronic Gold Receipt (EGR)?

      An EGR is an electronic security backed by physical gold stored in a vault.

    2. Is EGR the same as digital gold?

      No. An EGR is a security traded on a stock exchange, whereas digital gold is based on a different product structure.

    3. How can I buy EGR?

      You can purchase EGRs through a trading and demat account with a broker that offers the EGR segment facility.

    4. Can EGR be converted into physical gold?

      Yes, EGRs can be converted into physical gold in accordance with applicable rules and the withdrawal process.

    5. Is EGR taxable in India?

      Yes, capital gains arising from the sale of EGRs may be taxable under applicable income-tax rules.

  • High-Priced vs Low-Priced Stocks: Key Differences

    High-Priced vs Low-Priced Stocks: Key Differences

    You must have heard about high-priced stock that trades at a very large value and low priced-stock that trades at a few rupees. Investors really get attracted to the share prices as it helps in knowing how many stocks can be afforded with their capital. A stock that is of high price does not mean that it can make a stock overvalued similarly as a low price does not make it a cheap share. However, investors that look for value generally go after high book value low price stocks, although the price itself cannot decide the real value of the business. A high-priced stock costs a lot of money for one single share. Meanwhile, low price stocks cost just a few rupees.

    What Are High-Priced Stocks?

    The stocks that are traded with high monetary value in the financial market are high-priced stocks. Usually these shares have a high price tag which could reach up to thousands of rupees. They usually belong to very old and stable businesses. MRF Ltd. is a very popular example. It became the first Indian stock to cross the Rs 1 lakh mark. Other examples include Honeywell Automation, Page Industries, Shree Cement, and 3M India. Some companies simply decide not to split their shares. For example, MRF has not split its shares since 1975.

    This happens when a highly stable company grows its profits over a period of time that too without adding new shares in the market that eventually grows the price. Due to this only long term investors invest their money in these types of stocks. 

    What Are Low-Priced Stocks?

    Low price stocks are often called penny stocks. They attract many retail investors because they are very affordable. These are shares you can buy for just a few rupees. In the Indian market, they usually trade below Rs 10 or Rs 20. Some examples in our Indian market are Taparia Tools, Bridge Securities, and GACM Technologies. A low price often happens when a company issues a massive number of shares. This divides the company’s total value into very small pieces.

    It can also happen when a business is facing big financial problems, causing people to sell heavily. Sometimes, we search for a high book value in low price stocks. We do this to find hidden gems where the market has unfairly punished a decent stock.

    High-Priced vs Low-Priced Stocks: Key Differences

    Low price stocks often suffer from very low liquidity. This makes the National Stock Exchange put them in special periodic call auctions to stop crazy price jumps.

    Below is a simple comparison table covering the key characteristics of both categories.

    FactorHigh-Priced StocksLow-Priced Stocks
    Share priceHigh (usually thousands or lakhs)Low (often below Rs 20)
    Investment requirementRequires large capital for just one shareCan buy many shares with small capital
    Risk perceptionGenerally seen as stable and safeConsidered highly risky and speculative
    VolatilityLower daily price swingsExtremely high price swings
    LiquidityDecent to low due to a high price barrierOften very low making selling difficult
    ValuationCan be fairly valued or overvaluedCan be undervalued or a value trap
    Growth potentialSteady compounding growthPossibility of huge gains or total loss

    Advantages and Limitations of Investing in High-Priced Stocks

    There are several reasons why experienced investors trust high-priced shares.

    Advantages 

    • Established businesses: These companies are usually market leaders. They have strong brand recognition and very solid balance sheets.
    • Stronger financial track record in some cases: They show steady profit growth over many decades.They do not rely on stock splits to artificially pull in retail buyers.
    • Potentially better institutional participation: Big mutual funds and foreign investors prefer these stable companies for long-term safety.
    • Greater investor confidence, depending on fundamentals: A high price keeps short-term speculators away. This leads to lower volatility and higher stability.

    Limitations 

    • Higher capital requirement per share: If you have a small budget, you might not be able to afford even a single share.
    • High price does not guarantee good returns: A high price tag does not ensure the stock will continue to go up forever.
    • May already have high valuation: The stock might already be priced very high, leaving less room for sudden massive gains.

    Read Also: Stock PE vs Industry PE: Key Differences

    Advantages and Limitations of Investing in Low-Priced Stocks

    Low stock prices get huge attention from the investors as they are easy to buy.  

    Advantages 

    • Lower capital requirement per share: High-priced stocks are generally better for long-term wealth creation. They offer stability, established business models, and steady compounding over time. You can buy thousands of shares with a very small amount of money.
    • Possibility of significant percentage gains: Short-term traders might prefer mid-priced or lower-priced stocks with high liquidity. These stocks offer enough daily momentum to capture quick percentage swings.A stock moving from Rs 5 to Rs 10 results in a massive 100 percent gain. This is highly appealing to aggressive investors.
    • Opportunity to invest in emerging companies: Beginners should stick to fundamentally strong companies, completely ignoring the absolute share price. Buying penny stocks simply because they look cheap is dangerous. Finding fundamentally strong high book value in low price stocks can help you catch a turnaround business early.

    Limitations

    • Higher volatility in some stocks: These stocks can hit their upper or lower circuit limits very fast. This triggers a total halt in trading.
    • Lower liquidity: Selling your shares can become impossible if there are no active buyers in the market.
    • Greater possibility of weak fundamentals: Many of these companies suffer from heavy debt, falling sales, or poor management.
    • Risk of manipulation in certain low-priced stocks: Operators easily manipulate low price stocks. This is intentionally done so that more buyers can buy the stock. 

    High-Priced vs Low-Priced Stocks: Which Is Better?

    Opting between the two can heavily depend on the investors future goals and financial approach. 

    • Long-Term Investors: High-priced stocks are best suited for long term investors as they focus on wealth creation. These businesses provide stability, reliability and continuous growth over a period of time. 
    • Short-Term Traders: The short term investors generally look for mid priced or low priced stocks that have high liquidity. As these stocks have high daily fluctuations that helps the investor to capture quick gains.
    • Beginners Choice: Beginners should stick to fundamentally strong companies and ignore the share price completely. Buying penny stocks simply because they look cheap is very dangerous.
    • Investment Budget: Yes, your budget matters a lot. If you have a total capital of Rs 5,000, buying a Rs 40,000 share is impossible. In such cases, you must look for reasonably priced stocks that still have solid fundamentals.

    Factors to Consider Beyond Stock Price

    To make smart financial decisions, we must focus on actual financial health instead of the share price.

    • Market Capitalisation: This tells you the actual size and total market value of the company.
    • Revenue and Profit Growth: A stock should show consistent growth in sales and must have a net profit for more than a period of 4 years.
    • Earnings Per Share (EPS): EPS tells us about how much net profit is dedicated to each share. 
    • P/E Ratio: This ratio helps you compare the company valuation against other similar businesses.
    • Debt-to-Equity Ratio: We generally prefer a ratio below 1. It ensures the company is not burdened with dangerous loans.
    • Return on Equity (ROE): This helps in measuring how well the money of the shareholder is being used by the company to make profits.
    • Return on Capital Employed (ROCE): This tells us about the overall efficiency of the business capital.
    • Cash Flow: Positive cash flow tells the investor that the business is really generating money and not just on papers. 
    • Dividend History: If the dividends are growing regularly then it is a strong indicator.
    • Promoter Holding: If the promoter has high share holding it means the founder has strong confidence in their business.  
    • Liquidity and Trading Volume: With high daily volumes shares can be easily bought or sold without any major change in the price. 

    Common Mistakes Investors Make

    We often fall into the same traps when looking at share prices. Let us see how to avoid them.

    • Assuming Low-Priced Stocks Are Always Cheap: Absolute price is not value. A Rs 2 stock can still be heavily overpriced if the company has zero assets and huge debts.
    • Assuming High-Priced Stocks Are Overvalued: A Rs 50,000 stock with a very low P/E ratio is actually quite undervalued and cheap.
    • Ignoring Market Capitalisation: Looking only at the share price gives a false and misleading idea of the true size of the company.
    • Investing Based Only on Share Price: Building a portfolio solely based on how cheap a share looks often leads to terrible results.
    • Chasing Stocks After Sharp Price Movements: Buying out of the fear of missing out usually means you buy at the absolute top.
    • Ignoring Liquidity and Financial Health: Getting stuck in an illiquid stock is a major risk. If the stock hits lower circuits during a market crash, you cannot sell your shares.

    Read Also: GIFT Nifty vs Nifty 50: Key Differences

    Conclusion

    A successful investment journey depends on relying mainly on the company’s business model, its financial strength and fair valuation of the company. By not focusing on the price of the stock and rather giving real attention to the core fundamentals of the business helps in making a strong portfolio. 

    For more market news and insights, download Pocketful – offering users zero brokerage on delivery trades and an easy to use platform designed for both beginners and experienced investors.

    S.NO.Check Out These Interesting Posts You Might Enjoy!
    1Mutual Fund vs ETF. Are They Same Or Different?
    2Difference Between Gold ETF and Silver ETF
    3ETF vs Stock – Which One is the Better Investment Option?
    4Gold ETF vs Gold Mutual Fund: Differences and Similarities
    5ETF vs Index Fund: Key Differences You Must Know

    Frequently Asked Questions (FAQs)

    1. Does a high share price mean a company is expensive?

      No. A high share price only means the company has not split its shares over the years. We must look at valuation metrics like the P/E ratio to see if it is actually expensive.

    2. What are high book value low price stocks? 

      These are stocks trading below their actual net asset value per share. They can be good if the core business is stable, but you require careful analysis to avoid value traps.

    3. Why do some companies have share prices in lakhs? 

      Companies like MRF have share prices in lakhs because they have consistently grown their profits over decades. This has happened without splitting the existing shares or by issuing bonus shares.

    4. Can low priced shares be relied on by the beginners? 

      Low priced stocks are not safe for beginners as they have low liquidity, poor fundamentals and they are highly volatile. This makes them highly risky for beginners.

    5. How should one choose between a high-priced and a low-priced stock? 

      Your choice should always be based on financial health, market capitalisation, debt levels, and profit growth. You should never base your choice solely on the absolute price of the individual share.

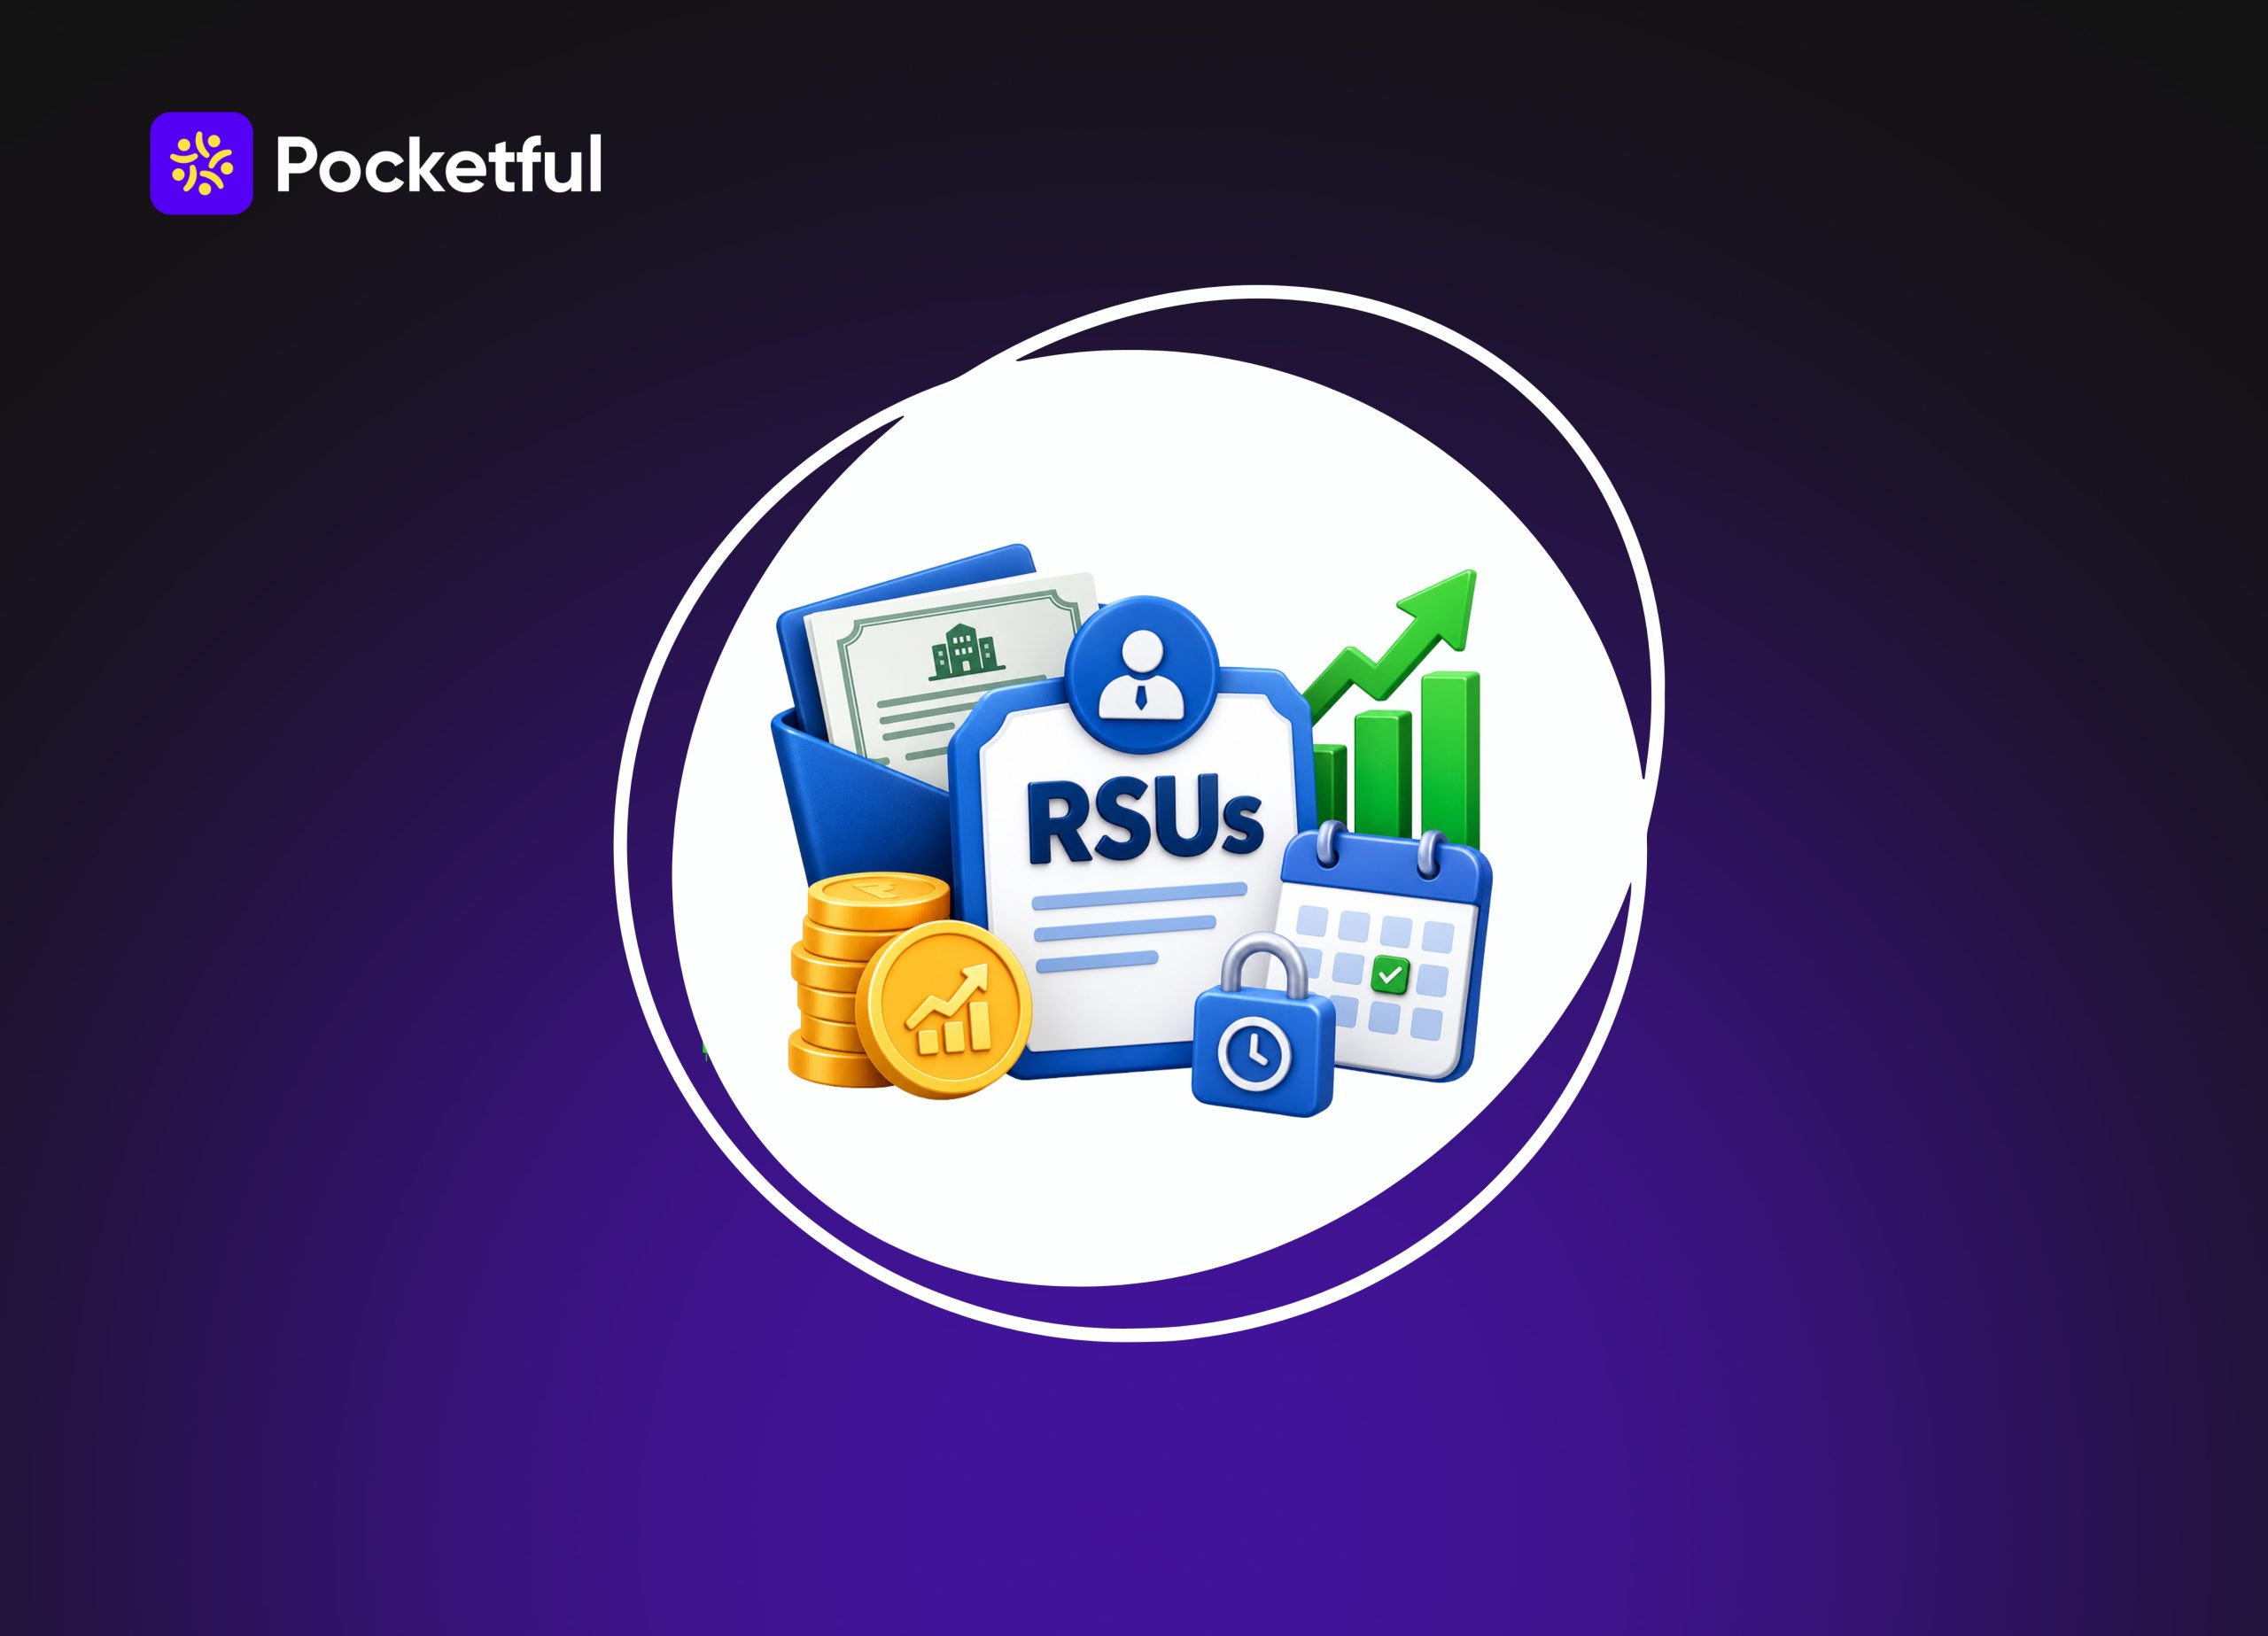
  • What Are Restricted Stock Units (RSUs)? Meaning, How They Work, Taxation

    What Are Restricted Stock Units (RSUs)? Meaning, How They Work, Taxation

    Getting a salary is great, but getting a share in the company you work for in addition to the salary is even better. This is why RSUs have become an integral part of employee compensation. However, to get RSUs, you need to stay with the company for a certain period before the shares become completely yours. 

    Let us explain RSUs in a simple way and understand how they work from the day they are granted to the day you eventually sell them.

    What are Restricted Stock Units (RSU)?

    A Restricted Stock Unit is a promise from your employer to give you company shares at a future date, provided you stay in the company and meet certain conditions. 

    Companies use RSUs mainly to retain talent. A cash bonus is a one-time thing, but RSUs tie your financial upside to how long you stay and, in many cases, to how well the company performs. This is especially common among large tech firms, US-headquartered companies with Indian subsidiaries, and increasingly, homegrown startups. 

    How Do RSUs Work?

    1. The Grant

    This is the day your employer allots you a specific number of units, say 200 RSUs. At this point, you own nothing yet. It is just a commitment on paper, recorded in your grant letter, along with the vesting schedule.

    2. The Vesting Schedule

    This is when you start receiving the shares, but it happens gradually over time. For example, a 4 -year vesting schedule will give you 25% of the shares each year. Some companies may follow a different schedule, such as giving a larger portion upfront and then the rest of the month. 

    You might come across the word ‘cliff’, which simply means you have to stay with the company for a certain period before you receive any shares. 

    So if you are granted 200 RSUs with a four-year annual vesting schedule, you would get 50 shares credited to you at the end of year one, another 50 at the end of year two, and so on. 

    3. Settlement

    Once units vest, they are converted into actual shares and credited to your demat or brokerage account, if the company is listed.

    Taxation of RSUs 

    Stage 1: Tax at Vesting (Perquisite Tax)

    The moment your RSUs vest, the Income Tax Department treats the fair market value (FMV) of those shares as a “perquisite”, a benefit received from your employer.

    This value gets added to your salary income for that financial year and taxed at your applicable income tax slab rate.

    Say 50 RSUs vest for you in a year, and the FMV on the vesting date is ₹3,000 per share. 

    This implies ₹1,50,000 will be added straight to your taxable salary for that year, even though you have not sold a single share.

    For listed companies in India, your employer usually deducts TDS on this perquisite value directly through payroll, so it also reflects in Form 16. 

    Stage 2: Tax at Sale (Capital Gains)

    Once you sell the vested shares, a second tax liability is generated, i.e., capital gains tax. 

    This is calculated on the difference between your selling price and the FMV on the vesting date 

    The classification depends on the holding period and whether the shares are listed in India or abroad:

    • Indian listed shares: 

    Held for more than 12 months before selling will be Long-Term Capital Gains (LTCG), taxed at 12.5% above the ₹1.25 lakh exemption threshold. 

    Sold within 12 months = Short-Term Capital Gains (STCG), taxed at 20%.

    • Foreign shares (like US-listed stock from a US parent company):

    The holding period for long-term classification is 24 months instead of 12 months. Long-term gains are taxed at 12.5% without indexation, and short-term gains get added to your income and taxed at the slab rate.

    Why Do Companies Offer RSUs?

    • It keeps people from leaving: Since RSUs vest over three or four years instead of being credited to your account on day one, quitting early means walking away from money that has not vested yet. Companies know this, and it is one of the reasons people stay a year longer than they planned to.
    • It links your paycheck to the company’s performance: When part of your compensation is in company stock, you are not just an employee anymore. If the company does well and the stock rises, your RSUs are worth more without your salary changing at all. Employers like this because it motivates people to think and work like owners, not just staff.
    • It rewards long-term thinking: A cash bonus is a one-time pat on the back. RSUs, on the other hand, keep paying over years, which pushes employees to care about where the company is headed two or three years down the line, not just this quarter’s targets.

    RSUs vs. ESOPs: A Table of Differences

    S. NoBasisRSUsESOPs
    1What do you get?Company shares that you receive after they vestThe right to buy company shares later at a fixed price
    2Do you have to pay?No, you do not pay to receive the sharesYes, you have to pay the fixed exercise price to buy the shares
    3When are they taxed?Usually, when the shares vest, and again when you sell themUsually, when you exercise the options, and again when you sell the shares
    4Upfront costNo upfront payment is requiredYou need money to buy the shares when you exercise the options
    5RiskGenerally lower because you receive the shares once they vestGenerally higher because the options may not be worth exercising if the share price falls below the exercise price
    6Commonly offered byMore common in large companies and established businessesCommonly offered by startups and growing companies
    7Impact on the companyShares are issued when the RSUs vestShares are issued when employees exercise their options, making the process a little more complex

    RSUs from Foreign Employer

    If the RSU comes from a foreign employer or a foreign parent company, and you have shares in a foreign brokerage or custodial account, you must report the shares on Schedule FA (Foreign Assets) in your income tax return, even if you do not sell anything in the year. 

    This is irrespective of the amount involved, and violation of the non-disclosure of foreign assets is subject to strict punishment under the Black Money Act. 

    Many salaried employees are not aware of this until the assessment officer draws their attention to it.

    Conclusion 

    To sum it up, RSUs can be a great way to build wealth, especially if you understand how they work. But taxes can sometimes annoy you by surprise because you may have to pay tax when the shares vest, even if you have not sold them yet.

    A simple way to stay prepared is to keep track of your vesting dates and the share value on each vesting date. You will need this information later when you sell the shares and calculate your capital gains. 

    If you have RSUs from a foreign company, multiple vesting dates, or several share sales, calculating the tax can get a little complicated. In such cases, it may be a good idea to speak to a tax professional, especially when filing your ITR. 

    S.NO.Check Out These Interesting Posts You Might Enjoy!
    1What is Commodity Valuation?
    2What is Auction Market?
    3What is MIS in Share Market?
    4What is Right Issue of Shares: Meaning, Examples, Features
    5What is Earnings Per Share (EPS)?

    Frequently Asked Questions (FAQs)

    1. What are RSUs?

      RSUs are company shares given to employees after they complete a certain period or meet specific conditions.

    2. Do I get RSU shares immediately?

      No. RSUs usually come with a vesting period. You receive the shares only after they vest.

    3. Do I have to pay for RSUs?

      No. You generally do not pay anything to receive shares when your RSUs vest.

    4. What happens if I leave the company before my RSUs vest?

      Your unvested RSUs are cancelled. However, the exact rules depend on your company’s RSU plan.

    5. Are RSUs and ESOPs the same?

      No. RSUs give you shares after they vest, while ESOPs generally give you the option to buy shares at a fixed price.

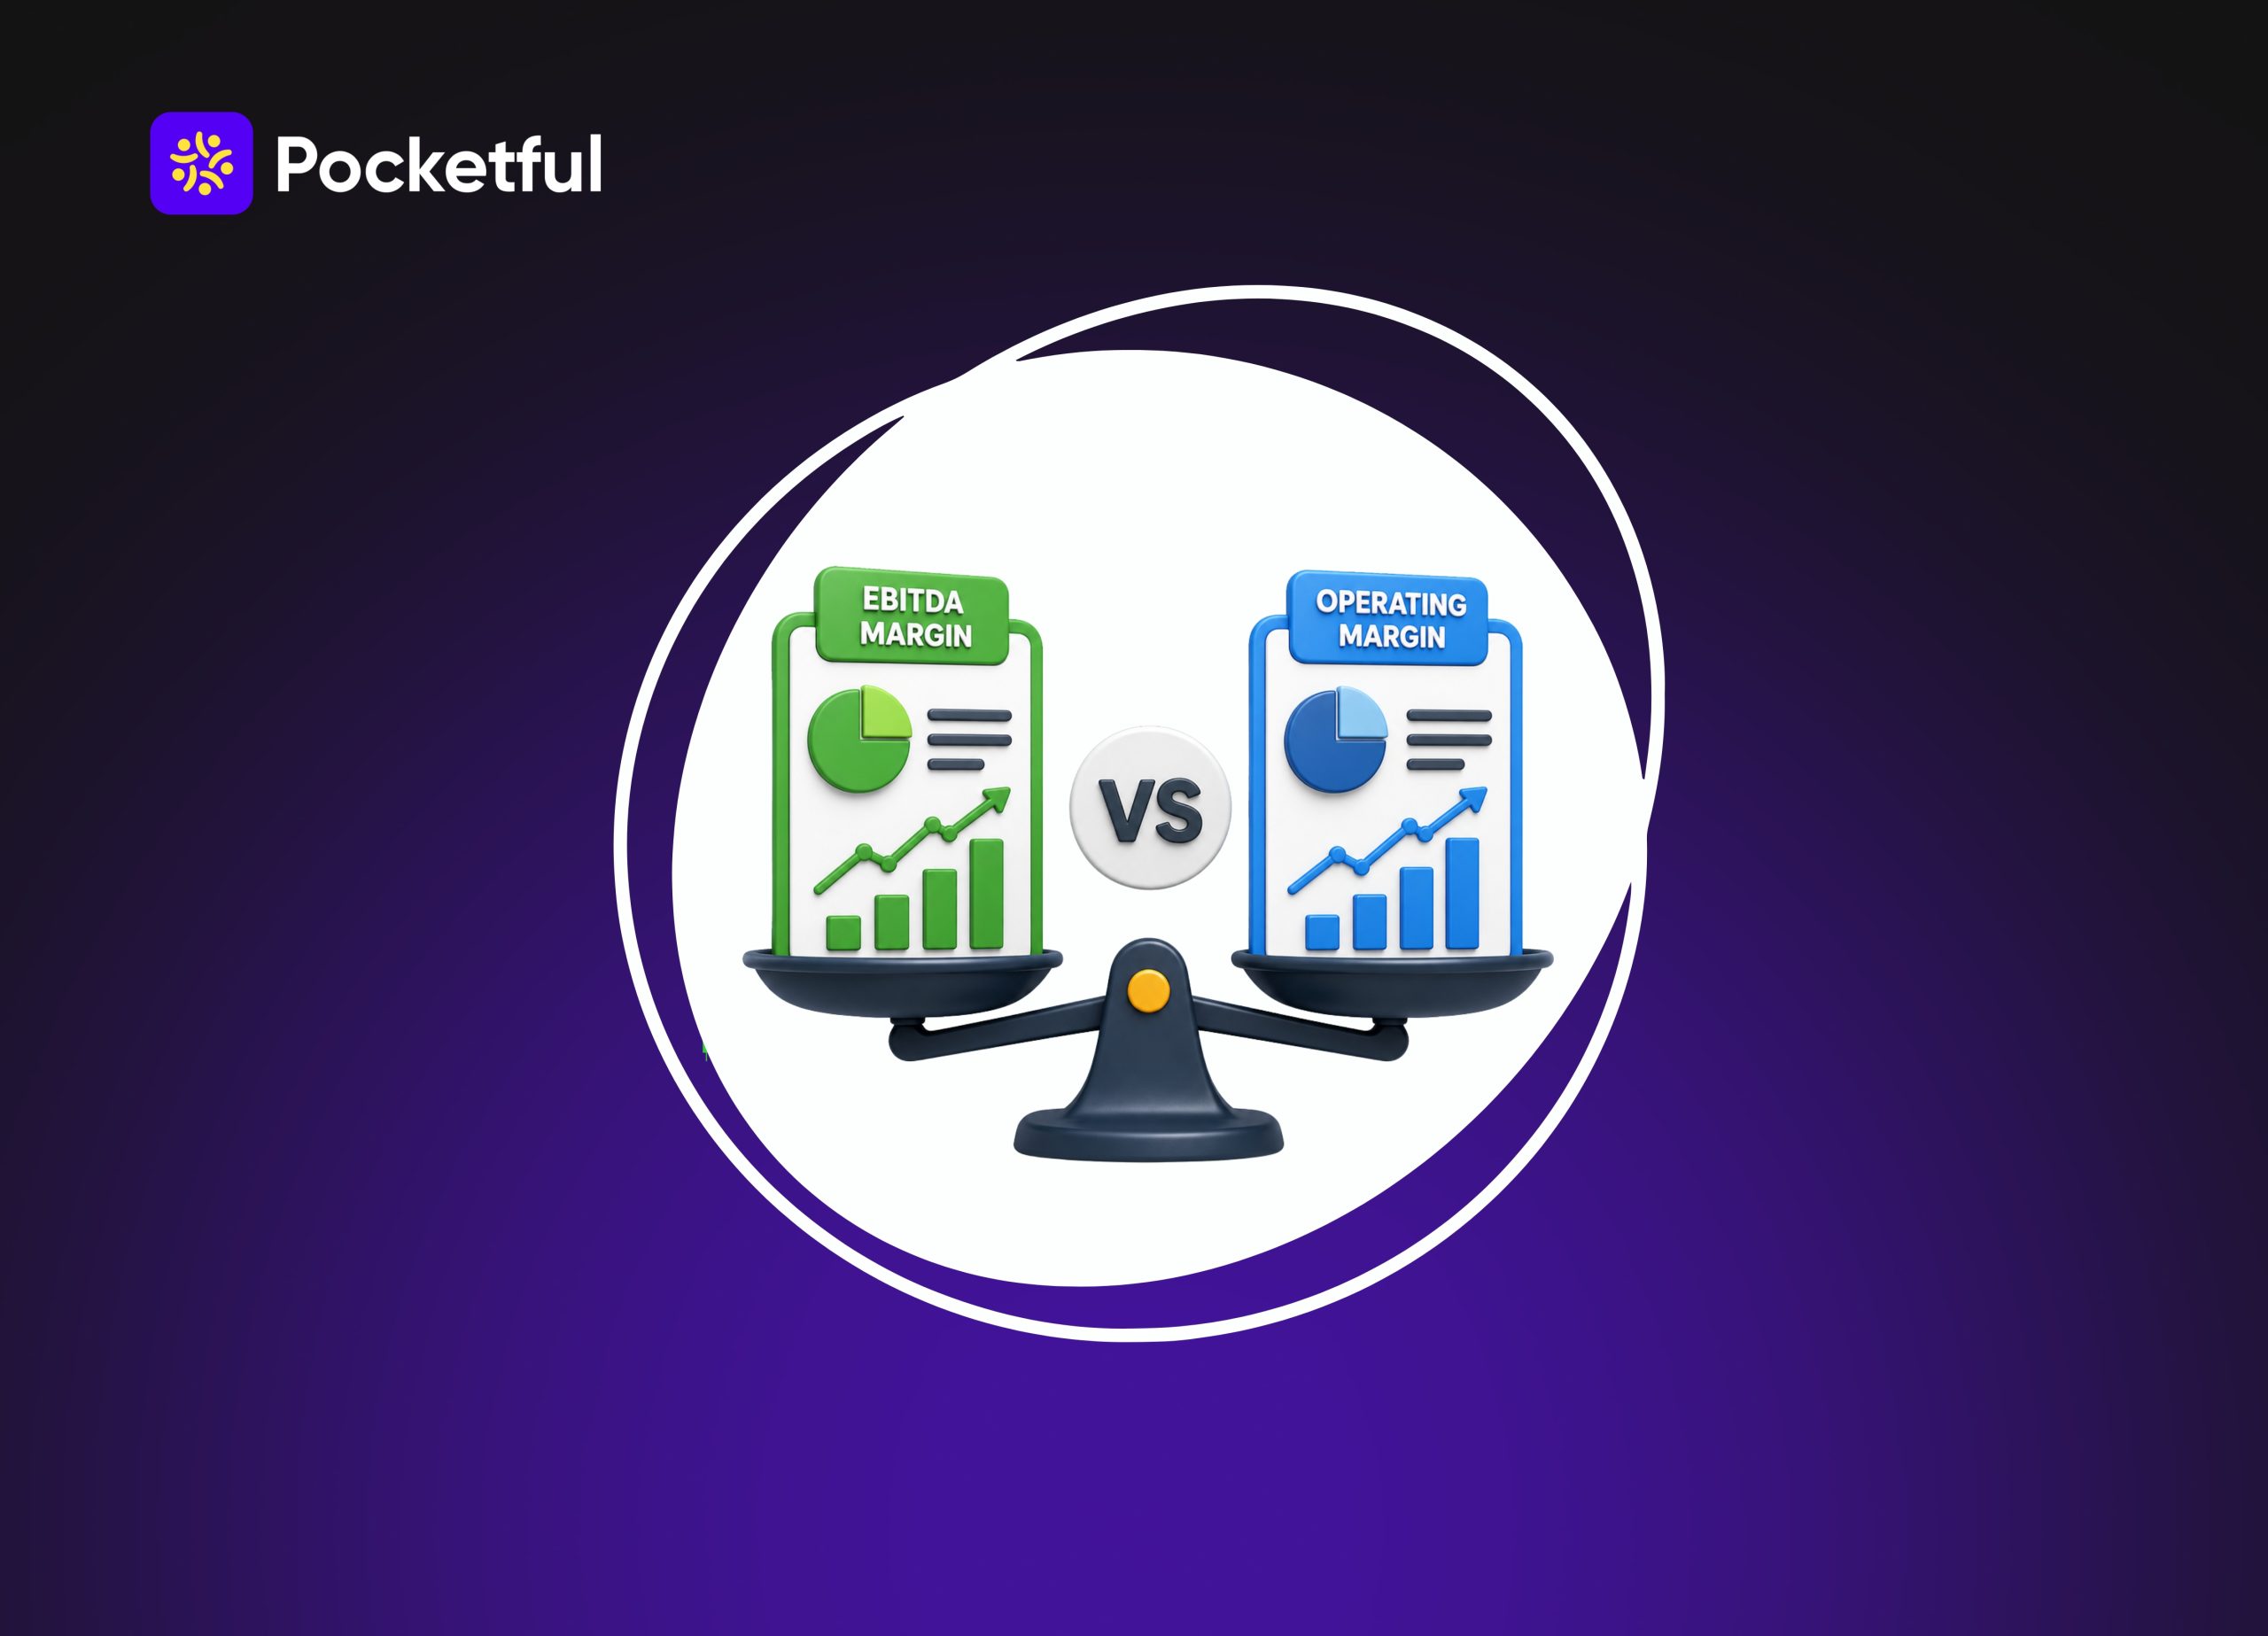
  • EBITDA Margin vs Operating Margin: Key Differences

    EBITDA Margin vs Operating Margin: Key Differences

    Every business wants to make money. However, finding out the real profit of a company can be tricky. Some hidden costs often mask the true performance of the core business operations. Investors required a clear number to see if a business model was actually working or just surviving on paper. Knowing the exact money a company earn from its daily work is the secret to smart investing. Clear financial numbers help us spot strong companies and avoid bad investments with confidence.

    What is EBITDA Margin?

    One of the most common terms is EBITDA in stock market . It stands for Earnings Before Interest, Taxes, Depreciation, and Amortization.To calculate this, financial experts take the net profit of a company. Then, they add back the interest, taxes, depreciation, and amortization. Let us break down why we add these four specific things back to the profit.

    First, taxes and interest depend on government rules and the loan choices made by the management. They do not reflect how well the actual product or service is selling. By removing them, we can judge the core business purely on its own merits.

    Second, depreciation and amortization are just accounting entries for asset wear and tear. No actual cash leaves the company bank account when equipment depreciates. Therefore, adding these back gives us a much better picture of the actual cash coming in.

    What is Operating Margin?

    Let us look at the other important financial metric that investors love to use. Operating margin focuses on the core business by measuring the percentage of profit a company keeps from its total sales after paying for all operating costs. This helps us see the real profitability of the daily business activities, showing exactly how much money is left after paying for essentials like raw materials, staff salaries, and rent. Unlike other metrics, it includes asset wear and tear. If a company buys heavy machinery, that machinery loses value over time, and this metric counts that depreciation and amortization as a very real business expense.

    At the same time, this metric completely excludes external costs like interest on bank loans or government taxes. By ignoring these outside factors, it keeps the focus strictly on how well the management is running the business, providing a clean look at operational success. 

    Which Margin is more important for traders

    Traders and investors often debate which metric is better for analyzing a stock. Both indicators offer unique clues about the financial strength of a business. We will break down why traders prefer each one based on different situations.

    From the EBIDTA Margin Point of View

    • Focuses on pure cash generation: It acts as a great substitute for operating cash flow in financial analysis. It shows the raw cash a business can generate to pay its daily bills. This helps traders see if the company is generating enough cash to survive.
    • Useful for business valuations: Market experts frequently use this to value companies during mergers and acquisitions. It helps buyers see the core earning capacity of the target company before any financial restructuring. It simplifies complex buyout calculations greatly.
    • Makes peer comparison easy: It completely ignores tax policies and debt structures of a company. This makes it extremely easy to compare companies operating in different states or countries with different tax laws. It levels the playing field for international analysis.
    • Helps evaluate young start-ups: Modern tech companies often use adjusted versions of this metric to show their path to profitability. It helps investors see the underlying business strength before heavy marketing or non-cash costs are applied. This is very common in modern stock markets.

    From the Operating Margin Point of View

    • Provides a realistic view of profits: It provides a much more realistic view of profits for traditional companies. Heavy machinery eventually needs replacement in the future. Counting depreciation ensures the cost of using those assets is not completely ignored.
    • Highlights management efficiency: It clearly highlights how well the management controls every single operational cost. A rising percentage over several years proves that the management is highly capable and efficient. Traders love to see consistent operational improvement.
    • Safer for debt-heavy companies: This metric is much safer for evaluating companies that carry a lot of high debt. Relying solely on metrics that ignore certain costs can sometimes mask poor financial health. It acts as a strict reality check.

    Read Also: Margin Trading vs Short Selling – Key Differences

    Differences Between EBIDTA Vs Operating Margin?

    To make things crystal clear, we have created a direct comparison between the two financial indicators. This simple table will help you remember the key differences easily.

    FeatureEBIDTA MarginOperating Margin
    Basic MeaningProfit before interest, taxes, depreciation, and amortization.Profit after paying all daily business expenses including depreciation.
    Calculation Formula(EBITDA / Total Revenue) x 100.(Operating Income / Net Sales) x 100.
    Depreciation TreatmentDepreciation is strictly excluded from the calculation.Depreciation is fully included as a necessary cost.
    Primary FocusHighlights the raw operating cash flow of the firm.Highlights the total operational efficiency of the firm.
    Best Suited IndustriesCapital heavy sectors like steel, telecom, and real estate.Expense heavy sectors like retail, IT services, and consulting.
    Metric SizeAlways equal to or higher than the other metric.Usually lower because it subtracts asset wear and tear.
    StandardizationIt is a non-GAAP measure that companies can adjust.It is a standard GAAP measure with strict rules.

    As you can see from the table, both metrics have their own special uses. You should use them based on the type of industry you are analyzing. Heavy industries need one metric, while service industries need the other.

    By checking both numbers, you can easily avoid falling into valuation traps. A smart trader always looks at the complete picture before risking their hard-earned money. This balanced approach is the key to stock market success.

    Conclusion

    Both of these financial metrics serve a very important purpose in the stock market. Neither indicator is strictly better or worse than the other. They simply look at a company’s profits through completely different lenses.One shows the pure cash-generating ability, while the other shows the true cost of running the business. Smart investors look at both numbers together to get a complete picture of financial health. Want to understand company fundamentals better? Download the Pocketful app to analyse stocks, track key financial metrics like EBITDA and operating margins, and make more informed investment decisions. 

    S.NO.Check Out These Interesting Posts You Might Enjoy!
    1Market Order Vs Limit Order: What’s the Difference?
    2Discount Broker vs Full-Service Broker: Key Differences
    3Overnight Funds vs Liquid Funds: Which Is Better?
    4Understanding the Difference Between Credit and Debt
    5MTF Charges vs Normal Trading Charges: Key Differences

    Frequently Asked Questions (FAQs)

    1. What is the meaning of EBITDA Margin?

      It shows a company’s core cash profit as a percentage of its total revenue. It ignores taxes, interest, and asset depreciation.

    2. What is the meaning of Operating Margin?

      It measures the profit percentage left after paying all daily operating expenses. This includes the wear and tear of business assets.

    3. What are the benefits of using these margins?

      They help investors check if a company’s core business is actually profitable. They also make it very easy to compare competing companies.

    4. How to use EBITDA Margin in trading?

      Use it to evaluate companies in asset-heavy industries like telecom or manufacturing. In these sectors, huge machinery costs can hide daily cash profits.

    5. How to use Operating Margin for investing?

      Use it to track management efficiency over time. A rising percentage over a few years proves the company is controlling its expenses well.

  • Stock Market Bubble: Meaning, Causes, Stages & Risks

    Stock Market Bubble: Meaning, Causes, Stages & Risks

    A stock market bubble happens when share prices rise extremely fast, going much higher than the actual value of the companies. A stock market bubble develops when excessive excitement and speculation replace logical financial research. The main difference between a healthy rising market and a stock market bubble is very simple. Normal stock price growth is backed by rising corporate profits and strong business performance. However, a stock market bubble is built only on hype, greed, and the fear of missing out.

    How Does a Stock Market Bubble Form?

    The creation of a stock market bubble is a step-by-step process. It rarely happens in a single day. Economic changes and human psychology work together to push share prices upward.

    It often begins with an Initial Increase in Asset Prices. This can be triggered by a new technology, a growing sector, or supportive government policies. As prices start moving up, there is growing Investor Interest. Early investors begin making good profits. Their success stories spread, bringing the stock market to the attention of the general public.

    This leads directly to Speculative Buying. People start buying shares just because the prices are going up. They stop looking at the actual business value or profits of the companies. This makes the market to make movements according to the Herd mentality and even leads to FOMO. 

    A great example in India was when Parle Industries saw its stock hit the upper circuit for five straight days. People bought the stock blindly, confusing it with the unlisted company that makes Parle Melody toffees, just because of social media hype.

    This blind buying results in Excessive Valuations. Share prices lose all connection to reality and the actual earnings of the companies.

    Eventually, the cycle reaches The Final Stage: Market Correction or Crash. The flow of easy money stops, reality sets in, and stock prices fall very quickly.

    Key Characteristics of a Stock Market Bubble

    To identify the stock market bubble investors look at some important signs. Using these signs people can differentiate if the market is running on emotions or logic. 

    1. If there is rapid and unsustainable price growth. Stock prices double or triple in a very short time. This happens without any real improvement in the company’s sales or profits.
    2. If the investors see Prices disconnected from company fundamentals. During the dot-com bubble, internet startups with zero profits were valued at billions of dollars.
    3. If the market shows Excessive investor optimism. This is also called irrational exuberance. Buyers truly believe that the stock prices will keep going up forever.
    4. If the stock exchanges record extremely high trading volumes. Millions of new retail investors enter the market to try their luck and make quick money.
    5. If there is widespread Speculative behaviour. Instead of holding shares for the long term, people start treating the stock market like a casino for quick bets.
    6. If the market sees an increasing use of leverage. People borrow heavy amounts of money to buy more shares, taking on extremely high risks.
    7. If there is a dangerous “This time is different” mentality. Investors here are convinced that the new era of technology has arrived and the primitive rules are no longer applied. 

    What Causes a Stock Market Bubble?

    The bubble is generally created due to cheaper prices and market emotional investments. Let us look at some of the factors that leads a bubble to inflate: 

    • Excess Liquidity: When the economy has surplus money people tend to take more risk. And this excess money directly enters the stock market. 
    • Low Interest Rates: If the borrowing rate or interest rate is low, putting your money in banks gives a very limited profit. This makes the investors invest in the stock market, where with higher risk higher profits can be made.
    • Investor FOMO: When the whole market is investing and everyone is making quick profits, investors sitting quietly get a FOMO. This results in attracting more new investors to the market blindly. 
    • Herd Mentality: When everybody is putting their money in the market one gets a natural instinct to follow the crowd which ultimately results in driving prices even higher. 
    • Speculation and Leverage: Borrowing money from banks or brokers to invest creates huge buying pressure. This borrowed money makes the market go up much faster than normal.
    • Overconfidence Among Investors: By earning money quickly for few trades boosts the confidence of the investor. This confidence results in ignoring the market risks and leads to uncalculated risky investing. 
    • Advent of New technologies and Emerging sectors: Internet and Artificial Intelligence bring in new avenues prompting investors to invest money inflating company values ahead of their actual earnings.
    • Social Media and Market Hype: Fake news through unverified sources spread like wildfire on these platforms pumping up the prices of stocks in a few days, keeping basic financial rules at bay.

    Read Also: Key Factors Affecting the Indian Stock Market Explained

    Stages of a Stock Market Bubble

    Financial experts have noticed that every stock market bubble follows a set pattern. The cycle can be broken down into six main stages.

    • Displacement: This is the birth of the bubble. A major change happens, like a new technology or a change in interest rates. Investors notice this change and expect it to bring huge profits.
    • Boom: The story spreads, and more money enters the stock market. Asset prices build momentum, and the media starts covering the rising market heavily.
    • Euphoria: This is the peak of the madness. Caution is totally forgotten. People invent new ways to justify insanely high stock prices, ignoring experts who warn that the market is evidently a bubble.
    • Profit-Taking: Seasoned investors read the early warnings and quietly sell their shares to secure profits as they know these high prices will not last.
    • Panic: A piece of bad news arrives, or interest rates go up. The continuous flow of new money stops. Share prices start dropping, and suddenly everyone wants to sell, but nobody wants to buy.
    • Crash & Correction: Stock prices fall violently. Companies with weak fundamentals go bankrupt wiping out massive wealth and the stock market returns to realistic and normal valuation levels.

    What Happens When a Stock Market Bubble Bursts?

    The first thing that happens is a sudden decline in stock prices. Share values can drop by huge percentages in just a few days, destroying years of paper profits. For example, during the recent market shifts tech related companies in India have witnessed huge drops. Even companies like Paytm and Zomato have seen a crash of 40% and 27% respectively.  

    This drop immediately causes panic selling. Investors rush to sell their shares at any price they can get, just to prevent losing all their money.

    Because everyone is selling, there is a sharp increase in market volatility. Prices jump up and down wildly, creating total confusion on the trading screens.

    This chaos leads to a devastating loss of investor wealth. Many common people who invested their hard-earned savings at the highest point of the market lose a large part of their capital.

    There is also a huge impact on businesses and companies. Companies that depended on high stock prices to borrow money suddenly face a cash crunch. This leads to halted business projects and job losses.

    Finally, there are possible effects on the broader economy. When the Japanese stock and real estate bubble burst in 1989, it destroyed the wealth of ordinary citizens. This forced the entire country into decades of slow economic growth and forced major changes in how companies were governed.

    Impact of a Stock Market Bubble on Investors

    A stock market crash affects different types of investors in very different ways.

    • Impact on Retail Investors: Common retail investors usually enter the market at the very end of the boom because of FOMO. This makes them purchase the stock at a very high price, which can result in giving maximum losses when the price crashes.  
    • Impact on Long-Term Investors: If the investors hold the shares for a long term it can give huge losses and the portfolio may fall heavily. However, if the investment is done in strong profitable businesses, the losses can recover within a few years. 
    • Impact on Short-Term Traders: Due to high fluctuation of price, their strict trading limits fail. If they trade with borrowed money, their losses can be massive.
    • Impact on Institutional Investors: Large mutual funds and banks have strict risk rules. They often sell and secure profits before the crash. Even then, a huge market fall brings down their overall yearly returns.
    • Risk of Permanent Capital Loss: The biggest risk of a bubble is buying useless companies just because of hype. If such a company goes bankrupt after the bubble bursts, its shares become totally worthless. The investor’s money is lost permanently.

    Stock Market Bubble vs Market Correction vs Market Crash

    It is very important for Indian investors to know the difference between a normal market fall and a dangerous stock market bubble.

    FeatureStock Market BubbleMarket CorrectionMarket Crash
    MeaningAn unnatural spike in prices driven by hype, disconnected from actual business value.A normal and healthy drop of 10 to 20 percent from a recent high.A sudden and severe drop in the whole market, usually more than 20 percent.
    CausesEasy money, extreme FOMO, and overconfidence among public investors.Routine profit booking or minor economic changes.Major global crises, wars, or the bursting of a large financial bubble.
    Price movementGoes up extremely fast, and then falls down equally fast.Falls slowly and moderately.Falls extremely sharply in just a few days.
    DurationCan take years to build up, but bursts in a matter of weeks.Lasts for a few weeks or months.Happens instantly, but the pain can last for years.
    Investor sentimentGoes from extreme greed and excitement to total panic.Mild worry but generally calm.Extreme fear, shock, and a rush to take out cash.
    Potential impactHuge risk of companies going bankrupt and permanent wealth loss.Very low impact. Often seen as a good time to buy more shares.Huge impact on the national economy, that can lead to job losses and slow growth. 

    How Can Investors Protect Themselves From a Market Bubble?

    Following basic investment rules can keep your savings safe during a stock market bubble.

    • Focus on Fundamentals: Always check the real business before buying its stock. Analyze the profits, sales, and debt of the company. One should not invest only because of the rising prices.
    • Diversify Your Portfolio: All your investments shall not be done in just one stock; rather you should diversify the investments in different sectors, because if one sector is impacted the other sectors can keep your money safe. 
    • Avoid Following Market Hype: Rumours and stock tips on social media shall be avoided. Money should not be invested only because of the market hype. 
    • Maintain a Long-Term Investment Approach: Businesses with good fundamentals can survive tough times. If shares are bought for a long term, temporary market crashes will not make a situation of panic selling. 
    • Review Portfolio Valuations: Check your investments regularly. If the stock prices are higher than your actual earnings then you can sell by securing your profits.
    • Avoid Excessive Leverage: Leverage or money should never be borrowed during a market crash scenario. As borrowed money will have interest attached to it and a bad investment can multiply your losses. 
    • Maintain an Appropriate Asset Allocation: Keep a balance based on your age and risk capacity. When the market looks extremely greedy, shift some of your profits into safe assets like bonds or fixed deposits to protect your wealth.

    Read Also: Why Share Market is Down Today?

    Conclusion

    The stock market is a wonderful place to build long-term wealth, but it can also be very dangerous during periods of extreme greed. A stock market bubble tests the patience and discipline of every investor. The rapid rise in prices is tempting, but it is built on weak foundations of hype and borrowed money.

    By understanding how a bubble forms, keeping emotions in check, and focusing strictly on the real business value of companies, investors can keep their money safe. Good financial habits ensure that wealth is not just created during the boom, but also protected during the inevitable crash.

    For more market news and insights, download Pocketful – offering users zero brokerage on delivery trades and an easy to use platform designed for both beginners and experienced investors.

    S.NO.Check Out These Interesting Posts You Might Enjoy!
    120 Things to Know Before the Stock Market Opens
    2Are Indian Stock Markets Overvalued?
    3What is a good rule for investing in stocks?
    4Different Types of Trading in the Stock Market
    5What Are The Challenges Traders Face When Trading In The Stock Market?

    Frequently Asked Questions (FAQs)

    1. What is the simple meaning of a stock market bubble? 

      It is a situation where the prices of a stock can exponentially rise instantly due to rumour or public excitement and not due to companies improving their financial situation.

    2. How to identify a stock market bubble? 

      One should always look if the prices are rising rapidly without any news or fundamental growth of the company.

    3. How can a stock market bubble burst? 

      If people stop investing and the new money stops, the bubble bursts. This happens due to bad economic news, higher interest rates, or when smart investors start selling their shares to lock in profits.

    4. Can a person who does not invest be affected by a market bubble? 

      If a massive bubble bursts it can lead to shut down of businesses that can result in job losses and ultimately the economic growth gets affected.

    5. Can an investor survive a market crash? 

      Investors can survive if they avoid borrowing extra money, verifying the social media tips properly, diversifying their investments and analyse the company fundamentals.

  • Illiquid Stocks: Meaning, Risks, Features & How to Identify

    Illiquid Stocks: Meaning, Risks, Features & How to Identify

    Every company needs to maintain a shareholder register, which is simply an official record of its past and present owners. Companies keep this detailed list so they know exactly who has voting rights and who should receive dividends. We can think of it as a basic rule book for transparency that follows government guidelines. This basic record keeping is where all stock market investing begins.

    What Is an Illiquid Stock?

    We often hear the word “illiquid” in the share market. In simple words, an illiquid asset is something valuable that you cannot quickly sell for cash without dropping its price. Illiquid Stocks are shares of companies that have very low trading volumes on the stock exchange. Because there is so little market activity, finding buyers or sellers takes a lot of time.

    What does being illiquid mean for you? It means you might not find a single buyer when you urgently need to sell your shares. You are often forced to drastically cut your asking price just to make a sale. This is very different from liquid stocks, which belong to large companies where thousands of shares trade instantly. Liquid share helps the investors to enter and exit their positions easily without trapping their money.

    Let’s say you have 1,000 shares of a small company and you are willing to sell them at a current price of Rs.100 but if the broker system shows zero buyers at that price, you are holding a classic illiquid stock.

    What Is Stock Liquidity?

    Let us understand stock liquidity. It simply measures how fast and easily you can convert an asset into cash. In our share market, it means buying or selling without causing a massive jump or crash in the stock price. Liquidity is crucial because it gives you the freedom to trade safely. A highly liquid market makes sure your orders go through instantly at a fair price.

    Trading volume directly impacts this liquidity. When millions of shares trade daily, the stock enjoys high liquidity and constant demand. We also look at the bid-ask spread, which is the gap between what buyers offer and sellers demand. A narrow gap means high liquidity, while a very wide gap means the stock is illiquid. Lastly, market depth refers to pending orders at various prices. Good market depth acts like a cushion, preventing sudden price crashes when large orders hit the exchange.

    Characteristics of Illiquid Stocks

    You can easily spot these shares by looking at a few key features. First, they have very low trading volumes, sometimes even seeing zero trades on certain days. Because there are so few active buyers and sellers, you will see a huge gap between the buying and selling prices.

    This thin market depth leads directly to high price volatility. This means a tiny trade can swing the price wildly up or down. If there is a large order executed by the investor they can struggle because the market cannot absorb so many shares at once. Although big mutual funds and research analysts try to avoid such companies by keeping their retail interest very low.

    Why Do Stocks Become Illiquid?

    Stocks usually lose their liquidity for a few simple reasons. Sometimes, businesses operate in unpopular or outdated sectors. Retail investors simply ignore them, dropping the daily trading volume to zero. Small companies and penny stocks also naturally have fewer public shares available, which limits daily trading and keeps big institutional funds away.

    It can sometimes happen that the private founders hold the maximum shares which results in very few free-floating shares for the general public. Poor financial performance or continuous losses also scare new buyers away. When large institutions and mutual funds avoid a stock due to manipulation risks, a huge chunk of liquidity vanishes. Lastly, if a company hides its financial data, investors lose trust and stay completely away.

    How to Identify an Illiquid Stock?

    You must always check a stock before buying it. Look at the average daily trading volume over a one-month period. Consistently low trading numbers are a huge red flag. You should also check the market depth window on your broker app. If you see a massive gap between the top buyer and seller, or if the order book is empty, stay away.

    Next, watch how often the price updates during the day. If a stock goes hours without a single trade, it is highly illiquid. You must also review the public shareholding pattern. A complete lack of mutual fund interest or very few public shares usually points to a risky, poorly traded company. Finally, look for unusual, empty gaps in the daily price charts where no trading happened at all.

    Read Also: What Is Common Stocks?

    Liquid Stocks vs Illiquid Stocks

    BasisLiquid StocksIlliquid Stocks
    Trading VolumeHigh trading volume and frequent transactions.Low trading volume and fewer transactions.
    Ease of TradingEasier to buy and sell due to more buyers and sellers.May be difficult to buy or sell quickly.
    Order ExecutionOrders are generally executed more easily, depending on market conditions.Orders may remain pending or get partially executed.
    Bid-Ask SpreadUsually narrower.Often wider.
    Price ImpactLarge orders generally have less impact on the market price.Even smaller orders can move the price significantly.
    SlippageUsually lower under normal market conditions.Greater risk of slippage, especially with market orders.
    Order BookGenerally deeper, with more buy and sell orders.Often thin, with fewer orders available.
    Price MovementCan be relatively smoother, but liquidity does not guarantee low volatility.Can experience sharper price movements due to limited trading activity.
    Exit RiskLower risk of being unable to exit a position quickly.Higher risk of finding limited buyers when trying to exit.
    Institutional ParticipationMore likely to attract institutional participation.Generally receives less institutional participation, although this varies by stock.

    Risks of Investing in Illiquid Stocks

    Putting your hard-earned money into these shares comes with hidden dangers. The biggest risk is that you might hold shares for weeks without finding a single buyer. To exit urgently, you will likely have to sell your shares at a massive loss.

    Because the trading volume is so low, a tiny trade can instantly push the stock to its upper or lower limit. This wide gap between buying and selling prices can destroy your profits immediately. Also, fraudsters can easily manipulate these thinly traded stocks. Ultimately, your capital gets locked in, preventing you from investing in much better market opportunities.

    What Is the Impact of Illiquidity on Stock Prices?

    Illiquidity completely breaks how a stock is priced in the open market. Without regular trades, the price loses its connection to the actual value of the business. Because the market is so thin, even a small order of a few hundred shares can cause the price to shoot up dramatically. This creates a completely false illusion of demand.

    When you buy, you immediately face a theoretical loss because the highest buyer is bidding far below what you just paid. You will also face price slippage. This means your market orders will execute at progressively worse prices than you expected.

    Are Illiquid Stocks Riskier Than Liquid Stocks?

    Yes, they carry a very unique danger called liquidity risk. Normal market risk means overall prices fall due to bad news. Liquidity risk means you simply cannot sell your shares at all, no matter what is happening.

    This creates a dangerous trap. You might see a huge 20 percent profit on your broker app. However, without active buyers, that paper profit quickly turns into a real loss when you actually try to exit. While some fundamentally strong small companies might give good returns over many years, they require deep research and extreme patience. You should always be cautious. Never put your emergency funds into thinly traded shares and strictly ignore unsolicited stock tips.

    Illiquid Stocks in the Indian Stock Market

    In India, market regulators actively protect us from these risky shares. The National Stock Exchange (NSE) and Bombay Stock Exchange (BSE) flag a stock as illiquid if it sees less than 50 trades a day and a daily volume below 10,000 shares.

    Once flagged, these shares are placed in a periodic call auction mechanism. This stops continuous, all-day trading. Instead, you can only place orders during six specific one-hour windows. During these auctions, normal intraday and stop-loss orders are completely banned. SEBI uses this method to stop price manipulation and reduce crazy volatility. You can always check the lists of these restricted stocks on the NSE and BSE websites to keep your money safe.

    Read Also: Types of Investment in the Stock Market

    Conclusion

    Understanding how trading volume and liquidity work is vital for your journey in the share market. While thinly traded stocks might look attractive because of sudden price jumps, the complete inability to sell them makes them highly dangerous. Staying informed, checking daily volumes, and always protecting your capital will help you build a safer portfolio.

    For more market news and insights, download Pocketful – offering users zero brokerage on delivery trades and an easy to use platform designed for both beginners and experienced investors.

    S.NO.Check Out These Interesting Posts You Might Enjoy!
    1What is Commodity Valuation?
    2What is Auction Market?
    3What is MIS in Share Market?
    4What is Right Issue of Shares?
    5What is Earnings Per Share (EPS)?

    Frequently Asked Questions (FAQs)

    1. What is an illiquid stock? 

      It is a share that trades in very low volumes on the stock exchange. Finding ready buyers or sellers for these shares is extremely difficult and time-consuming.

    2. Why is the bid-ask spread wide in illiquid stocks? 

      Since there are very few active market participants, buyers and sellers fail to agree on a close price. This disagreement creates a massive gap between the highest bid and lowest ask.

    3. How can you check if a stock is illiquid? 

      You can easily check the average daily trading volume and market depth on your broker app. Additionally, you can check the official illiquid securities list published regularly by the NSE and BSE.

    4. What is a periodic call auction? 

      It is a special trading window introduced by SEBI to reduce abnormal volatility in specific shares. Instead of continuous trading, orders are collected and matched in six specific one-hour sessions.

    5. Should a beginner invest in illiquid stocks? 

      Beginners should strictly avoid these stocks. The high price volatility and difficulty in exiting trades make them highly unsuitable and dangerous for new investors.

  • Income Stocks: Meaning, Benefits, Risks & How to Invest

    Income Stocks: Meaning, Benefits, Risks & How to Invest

    The income stocks are the ones which offer you a chance to invest in stable and good companies with a high level of maturity that help you with good returns. Many investors prefer these stocks as the chances of positive returns are very high. 

    You will get regular dividends. So, what does it mean to invest in income stocks, and who should actually be the one to invest in them? Let us find out here. 

    What Is an Income Stock?

    An income stock is a share of a company known for paying dividends to its shareholders regularly. These are often mature businesses. They may not need to reinvest all their profits into rapid expansion. Therefore, they can distribute some of those profits among shareholders.

    However, simply paying a dividend does not automatically make a stock a good investment. The company’s earnings, debt and ability to continue paying dividends also matter.

    The NSE also points out that listed companies are not obligated to pay dividends. A company can decide not to declare one.

    How Do Income Stocks Work?

    The process is quite simple. You buy shares of a listed company through your demat and trading account. If the company earns profits, its board may decide to distribute some of them as dividends.

    If you are an eligible shareholder for that dividend, the amount is credited according to the applicable process.

    For example, consider this situation:

    ParticularAmount
    Share price₹400
    Shares purchased250
    Total investment₹1,00,000
    Annual dividend per share₹16
    Total dividend received₹4,000

    In this example, the investor receives ₹4,000 without selling the shares.

    The shares themselves remain in the portfolio. So, the investor’s final return will depend on both dividends received and movement in the share price.

    What Are the Main Features of Income Stocks?

    An income stock usually has a few characteristics that separate it from stocks bought mainly for rapid growth.

    1. Regular Dividend History

    This is where consistency is the key. Investors usually ask questions like whether the company has paid returns or dividends in the past or not. 

    A long dividend history does not guarantee future payments. Still, it tells you how the company has treated dividends in different business conditions.

    2. Established Business

    Income stocks are often found among established companies rather than businesses that are still aggressively expanding.

    A younger company may need most of its profits to open new facilities, develop products or enter new markets. A mature company may have fewer such requirements and can return some profits to shareholders.

    3. Stable Earnings and Cash Flow

    Dividends eventually have to be paid from available cash.

    That is why investors should look beyond reported profit. A company with stable earnings and healthy cash flow is good. You might get a good dividend flow here. 

    4. Moderate Growth

    Income stocks can grow in value, but rapid capital appreciation is usually not their main attraction.

    The focus is generally on a combination of dividend income and possible long-term appreciation.

    5. Dividend Yield

    Dividend yield tells you how much dividend a company pays relative to its current share price. The calculation is simple:

    Dividend Yield = Annual Dividend Per Share ÷ Current Share Price × 100

    A good yield means that the company is offering better outcomes to its investors. 

    Read Also: What Is Stock SIP?

    What Should You Check Before Choosing Income Stocks?

    Looking only at dividend yield is one of the easiest mistakes to make.

    A stock showing a 7% yield is not necessarily better than one offering 4%. You need to understand why the yield is high and whether the company can continue paying it.

    Here are some useful factors to check:

    FactorWhat to Check
    Dividend historyWhether dividends have been paid consistently
    Dividend yieldDividend compared with current share price
    Payout ratioPortion of earnings distributed as dividends
    ProfitWhether earnings are stable or growing
    Cash flowWhether the business generates enough cash
    DebtWhether repayments could put pressure on dividends
    Business outlookWhether the company can maintain its earnings

    You should look at all these at the same time. 

    For example, imagine a stock was trading at ₹500 and paid a ₹20 dividend. Its dividend yield was 4%.

    The share price then falls to ₹250 while its last annual dividend remains ₹20. The historical yield now appears to be 8%.

    That 8% can look attractive. But the more important question is why the stock fell by 50%.

    This is where you need to analyse and compare every aspect well.

    Income Stocks vs Growth Stocks

    The difference comes down largely to what a company does with the money it earns.

    A growth company normally reinvests a large portion of its earnings into expanding the business. An income-oriented company may distribute a greater portion to shareholders.

    BasisIncome StocksGrowth Stocks
    Main attractionDividend incomeShare price growth
    DividendsUsually more importantOften low or absent
    Company stageGenerally establishedOften expanding
    Use of profitsPart distributed to shareholdersMostly reinvested
    Capital appreciationPossible, usually secondaryUsually the main objective
    Suitable approachIncome with equity exposureLong-term capital growth

    An investor may even hold both. Growth stocks can provide exposure to expanding businesses, while income stocks can add a dividend component to the portfolio.

    Example of an Income Stock Investment

    Suppose you invest ₹2 lakh in a stock trading at ₹1,000.

    This means you get 200 stocks. Now, say, the company declare dividends of ₹40 per share during the year.

    Your dividend income would be:

    200 × ₹40 = ₹8,000

    Now assume the share price reaches ₹1,050 by the end of the year.

    Your shares would be worth:

    200 × ₹1,050 = ₹2,10,000

    You have an unrealised gain of ₹10,000, and you have got ₹8,000 as dividends.

    But there are chances of something negative as well. 

    Say share falls to ₹900. Now, your holdings would be worth ₹1,80,000. You do have a ₹8,000 dividend, but there is a loss on the share price of ₹20,000.

    This is why income stocks should not be treated like fixed deposits or other products offering a predetermined return. They are still equity investments.

    What Are the Benefits of Income Stocks?

    One reason investors consider income stocks is that returns do not depend entirely on selling shares at a higher price. The main reasons or benefits of investing in dividend stocks are as follows:

    • Consistent dividend pay for shares you hold.
    • A chance to reinvest the dividend you get.
    • Better exposure to mature business.
    • Effective portfolio diversification.
    • Higher capital appreciation with time.

    For long-term investors, reinvesting dividends can be particularly useful because future returns are then earned on a larger investment base.

    Read Also: What Is Common Stocks?

    What Are the Risks of Income Stocks?

    When you invest in income stocks, there are certain risks as well that you might face. These are as follows:

    • Changes in the dividend rates, which can fall as well.
    • A fall in the price of the shares.
    • Slow growth of the business is leading to improper returns. 
    • Risks associated with the sector in which the company operates.

    Who Should Invest in Income Stocks?

    As an investor, not every kind of stock is right for you. Understanding your risk and return appetite will help you get the insights on where you should invest. But in general, the income stocks are a great choice for the following kinds of investors:

    • Investors looking for regular dividend income.
    • Long-term investors who are happy to hold stocks. 
    • People looking for stable returns over time. 
    • Those who wish to reinvest their returns. 
    • People seeking to have balanced portfolio.
    • Investors who can accept stock market risks.

    How to Invest in Income Stocks Through Pocketful?

    Before investing, shortlist companies based on more than their latest dividend.

    Check their financial performance, dividend history, cash flows and debt. Compare them with other companies operating in the same industry.

    You can then invest through Pocketful:

    1. Open your demat and trading account with Pocketful.
    2. Search for the stock you want to analyse.
    3. Review the company’s available market information.
    4. Check its financial performance and dividend history.
    5. Decide your investment amount.
    6. Place the buy order.
    7. Monitor the company’s results and dividend announcements.

    A dividend-paying company can change over time. Continue reviewing the business even after you have invested.

    Read Also: What is a good rule for investing in stocks?

    Conclusion

    An income stock gives investors an opportunity to earn dividends from stocks. This is a great choice if you need consistent returns over time. 

    But dividend yield alone should never decide an investment. Look at earnings, cash flow, debt, payout history and the strength of the underlying business. A sustainable dividend matters far more than an unusually high one.

    Also, it is important that you invest in these stocks with proper guidance and support. This is where opening a demat account with Pocketful can help you.

    S.NO.Check Out These Interesting Posts You Might Enjoy!
    1What is Commodity Valuation?
    2What is Auction Market?
    3What is MIS in Share Market?
    4What is Right Issue of Shares: Meaning, Examples, Features
    5What is Earnings Per Share (EPS)?

    Frequently Asked Questions (FAQs)

    1. What Is an Income Stock?

      An income stock is a share of a company that regularly pays dividends to shareholders. These are often established companies with relatively stable earnings and cash flows.

    2. How Do You Earn Money From Income Stocks?

      You can earn through dividends paid by the company and through capital appreciation if the share price increases. Both forms of return can vary.

    3. Are Income Stocks Safe?

      No stock is completely safe. Income stocks carry market and company-specific risks, and companies can reduce or stop their dividends.

    4. What Is the Difference Between an Income Stock and a Growth Stock?

      Income stocks are generally chosen for dividends, while growth stocks are mainly bought for potential capital appreciation. Growth companies also tend to reinvest more of their profits.

    5. Is a High Dividend Yield Always Better?

      No. A high dividend yield is not always better. You need to consider the growth, prospects, and future analysis as well for the same.

  • What is a Record Date in Stock Market?

    What is a Record Date in Stock Market?

    You may hold a stock for months, but your eligibility for a dividend or bonus shares can depend on one date. The record date in share market determines which shareholders qualify for a corporate action. Missing the relevant buying deadline by even one trading day can mean missing the benefit.

    So, what is record date in share market, and why does it matter? So, let us explore the details here.

    What Is a Record Date?

    A record date is the date fixed by a company to identify shareholders eligible for a specific corporate action. The company checks its shareholder records on this date to determine who should receive the announced benefit.

    In simple terms, if we have to define record date, it is the cut-off date used to determine shareholder eligibility.

    Corporate actions for which a company may announce a record date include:

    • Dividends
    • Bonus shares
    • Stock splits
    • Rights issues
    • Buybacks
    • Mergers or demergers

    The company announces the record date in advance and informs the relevant stock exchanges. Investors can then check the announcement and understand whether their holdings qualify for the corporate action.

    How Does Record Date Work for Corporate Actions?

    The purpose of the record date remains largely the same across corporate actions. It identifies eligible shareholders. However, the benefit you receive depends on the type of corporate action.

    1. Dividends

    When a company declares a dividend, it fixes a record date to identify eligible shareholders. If you are an eligible shareholder, you receive the declared dividend as per the same schedule. 

    2. Bonus Issues

    A bonus issue gives existing shareholders additional shares. The record date determines who qualifies. For example, in a 1:1 bonus issue, the eligible shareholders will get one bonus share for each share they already hold.

    3. Stock Splits

    A stock split divides existing shares into a larger number of shares. But all the shares are now with a lower face value. Now, say a stock has a ₹10 face-value share. It is split into two shares with a face value of ₹5 each. The record date determines which shareholders are eligible for this adjustment.

    4. Rights Issues

    A rights issue allows eligible existing shareholders to apply for additional shares based on a specified ratio and price.

    The company uses the record date to determine which shareholders receive the rights entitlement.

    5. Buybacks

    Companies may also use a record date for buybacks conducted through the tender offer route.

    It helps identify shareholders eligible to participate in the buyback according to its announced terms. For example, NSE corporate-action records show record dates for buybacks as well as dividends and bonus issues.

    Record Date vs Ex-Date

    Record date and ex-date are closely related, but they serve different purposes. Understanding this difference is important when deciding when to purchase a stock.

    ParticularsRecord DateEx-Date
    MeaningDate used to determine eligible shareholdersDate from which the stock trades without the corporate action benefit
    Decided forIdentifying eligible shareholdersDetermining entitlement when shares are traded
    Buying on the dateGenerally too late to qualifyBuyer generally does not qualify
    T+1 impactOften coincides with ex-dateOften coincides with record date

    The ex-date is the first trading day when the share trades without the benefit attached to it. If you purchase shares on or after the ex-date, you generally do not qualify for that corporate action.

    Under India’s T+1 settlement system, the ex-date and record date commonly fall on the same day. However, exceptions can occur because of trading or settlement holidays. Investors should therefore check the dates announced for the specific corporate action rather than assuming they will always match.

    Read Also: Understanding the Equity Trade Life Cycle

    How Does T+1 Settlement Affect the Record Date?

    Under the T+1 settlement cycle, an equity trade is generally settled one business day after the trade date. This settlement period directly affects whether your shares are available in your demat account by the required date.

    For example, suppose the ex-date and record date are Friday.

    • You purchase the shares on Thursday.
    • The transaction settles on Friday.
    • You become eligible for the corporate action.
    • If you purchase on Friday, settlement happens later.
    • You generally do not qualify for the announced benefit.

    This gives investors a simple rule to follow: buy before the ex-date, not on the ex-date.

    Settlement holidays can affect this timeline. If a settlement holiday prevents the shares from being credited by the record date, an earlier purchase may be required.

    Record Date Example

    Consider a company that announces a dividend of ₹10 per share. It fixes Friday as the record date, and Friday is also the ex-date.

    The eligibility would generally look like this:

    Purchase DateExpected SettlementEligible for Dividend?
    WednesdayThursdayYes
    ThursdayFridayYes
    FridayNext settlement dayNo

    If you purchase the shares on Thursday, they generally settle by Friday. Your holding can therefore qualify for the dividend.

    If you purchase on Friday, you have bought the shares on the ex-date and will generally not receive the announced dividend.

    Interestingly, if you already hold eligible shares and sell them on the ex-date, you can generally remain eligible. This is because the shares are debited from your demat account on the following settlement day.

    How to Find a Company’s Record Date

    You should check the record date before buying a stock specifically for an upcoming corporate action. Exchange announcements are useful because they provide the official dates reported for listed companies.

    You can check the record date in share market through:

    • NSE corporate action announcements
    • BSE corporate action announcements
    • The company’s investor relations page
    • Corporate action information provided by your broker
    • Official company announcements

    NSE, for example, provides corporate action information showing details such as the purpose, ex-date and record date for listed securities.

    It is also worth checking the announcement again closer to the date. This helps you account for any revised dates, trading holidays or settlement-related changes.

    Common Mistakes Investors Make With Record Dates

    Knowing the meaning of record date is only one part of the process. Investors also need to understand how buying and settlement affect eligibility.

    1. Buying Shares on the Ex-Date

    This is one of the easiest mistakes to make.

    Buying a share on the ex-date generally does not make you eligible for the corporate action. You should usually purchase it before the ex-date.

    2. Confusing Record Date With Payment Date

    The record date determines who is eligible. The payment date determines when the benefit is paid.

    For a dividend, for example, the money may reach eligible shareholders after the record date. The two dates should not be treated as the same.

    3. Buying Shares Only for the Dividend

    A dividend may look like an opportunity to earn additional money, which is passive in nature and safer too. 

    However, the share price can adjust when a stock begins trading ex-dividend. Taxes and transaction costs can also affect the final return.

    Therefore, a dividend alone should not be treated as a guaranteed short-term profit opportunity.

    4. Assuming Every Corporate Action Has the Same Timeline

    The record date determines eligibility, but the actual credit or payment timeline can differ.

    A dividend may be paid according to one schedule, while bonus shares, rights entitlements or shares following a split may follow another.

    Why Is the Record Date Important for Investors?

    The record date may look like a small detail in a corporate announcement. However, it directly affects whether you qualify for the benefit.

    Understanding it helps you:

    • Check dividend eligibility
    • Know whether you qualify for bonus shares
    • Track stock split eligibility
    • Understand rights issue entitlement
    • Check eligibility for applicable buybacks
    • Plan share purchases around corporate actions

    More importantly, it prevents a common assumption that buying a stock on the record date itself is enough. In most cases, the buying decision needs to be made earlier.

    Read Also: What are T2T (Trade to trade) stocks?

    Record Date and Dividend Taxation

    Receiving a dividend also has tax implications. Dividend income received by shareholders is generally taxable in their hands under applicable Indian income-tax provisions.

    This means buying a stock just to capture a dividend should not be evaluated based only on the dividend amount. You also need to consider the share-price movement, applicable taxes and transaction costs.

    The record date determines eligibility for the dividend, while the applicable tax treatment depends on prevailing tax rules and your individual circumstances.

    What About T+0 Settlement?

    India has also introduced an optional T+0 settlement mechanism alongside the existing settlement system. It allows eligible transactions within the framework to be settled on the same trading day.

    However, investors should not assume that every stock transaction follows T+0.

    For corporate actions, always check the officially announced ex-date and record date. Settlement systems can evolve, but the dates published for the particular security remain important for determining eligibility.

    Conclusion

    A record date determines which shareholders qualify for corporate actions such as dividends, bonus shares, stock splits, rights issues and applicable buybacks. Under the T+1 settlement cycle, you generally need to purchase shares before the ex-date rather than waiting for the record date itself.

    But when you are trading in the stock market, you need a reliable platform by your side. Investing using Pocketful can help you greatly. 

    S.NO.Check Out These Interesting Posts You Might Enjoy!
    1What Is Common Stocks?
    2What is Auction Market?
    3What is MIS in Share Market?
    4What is Pledging of Shares?
    5What is Earnings Per Share (EPS)?

    Frequently Asked Questions (FAQs)

    1. What Is Record Date in Share Market?

      The record date is the date fixed by a company to determine the shareholders who will get the benefits, such as dividends or additional shares.

    2. How Do You Define Record Date in Simple Words?

      To define record date simply, it is the cut-off date on which a company identifies shareholders who are eligible for benefits.

    3. Is the Record Date the Same as the Ex-Date in India?

      Under T+1 settlement, the record date and ex-date commonly fall on the same day. But it can change if there is a holiday.

    4. How Many Days Before the Record Date Should I Buy Shares?

      You generally need to buy the shares before the ex-date. When the ex-date and record date are the same under T+1 settlement, this usually means buying at least one trading day earlier.

    5. What Happens If I Buy Shares on the Record Date?

      If the record date is also the ex-date, buying shares on that day generally means you will not qualify for the announced corporate action.

  • Turnaround Stocks: Meaning, Features, Risks & How to Identify

    Turnaround Stocks: Meaning, Features, Risks & How to Identify

    Turnaround stocks are shares of companies that went through a genuine rough patch, weak earnings, falling revenue, and a beaten-down price, and are now showing real signs of recovery. These companies may not be weak in terms of the fundamental base. They have the potential to rebuild and recover over time, which is why investors usually consider them.

    So, if you are an investor who is looking for an answer, then read this guide. Understand what turnaround stocks are and know what makes them unique in nature. 

    Turnaround Stocks Definition

    A turnaround stock is a company that suffered a period of poor financial performance, often losses or shrinking margins, and is now working through a deliberate recovery plan. The stock price usually reflects the bad years. 

    You will be able to notice that these were trading well below what the business could be worth once the recovery actually plays out. The opportunity lies in that gap, which is buying before the market reprices the stock and improves the fundamental value.

    Not every beaten-down stock qualifies. A company stuck in permanent decline, losing market share to better competitors with no real plan to fix it, is not a turnaround candidate. It’s just a weak business. The difference lies in whether the company has identified its problems and is actively addressing them.

    Why Do Companies End Up Needing a Turnaround?

    There are many reasons why a company might need this turnaround, but some of the key reasons that you should actually consider analysing are as follows:

    • Rising input costs: A weaker rupee or a spike in raw material prices can hit import-dependent companies hard. This can lead to lower margins and cost impacts, which will stay until prices are set back.
    • Poor capital allocation: Overexpansion, bad acquisitions, or excess debt are some of the reasons that will impact the company badly. It can take over the good years and will need time to recover.
    • Industry-wide disruption: New competitors or changing consumer behavior can have a great impact. It will take time to be in balance again. 
    • Management missteps: Sometimes the business itself is fine, but leadership makes poor calls on pricing, expansion, or product direction. This is where a change at the top becomes the actual fix.

    Key Characteristics of Turnaround Stocks

    Genuine turnaround candidates tend to show a specific set of changes rather than being focused on the points that are not meaningful. Some of the key points that you should know here are as follows:

    1. Management Change

    A new leadership team is one of the clearest early signals. It’s far easier for an incoming CEO or CFO to admit past mistakes and reverse bad strategy than for the same team that caused the problems to fix them. Watch for management commentary in quarterly earnings calls, specifically whether they name the actual problem and lay out a concrete plan, not vague promises about “improving performance.”

    2. Business Strategy Reset

    A real turnaround usually comes with a defined strategy shift. It can be exiting unprofitable segments, renegotiating supplier contracts, repricing products, or refocusing on the core business. The idea is to actually look for the segment that made money in the first place. By simply focusing on this, the company can actually recover with time.

    3. Debt Reduction and Cash Flow Discipline

    Selling non-core assets, cutting unnecessary costs, and pushing harder on collections are common moves once new management takes over. The goal is straightforward: improve operating cash flow, pay down debt, and free up capital to reinvest in the business that’s actually working. A shrinking debt-to-equity ratio over consecutive quarters is one of the more reliable signs that this is happening.

    4. Valuation Reset

    Turnaround stocks typically trade at low PE and PB ratios relative to their sector, since the market is still pricing in the company’s recent weak performance. This is exactly the gap turnaround investors are betting on. But context matters here. A low PE can also mean earnings are extremely poor. Also, a low or negative PB can mean liabilities exceed assets entirely, both signs of a company in real trouble rather than a genuine turnaround setup.

    Read Also: Risk Management In Trading

    How to Identify a Genuine Turnaround Candidate

    A falling stock price alone tells you almost nothing. A few checks separate a real opportunity from a value trap.

    • Check for consecutive quarters of improvement and see where you are able to see consistency.
    • Read the management commentary closely and look for the specific signs that can help you understand the market well. 
    • Track the debt trend, since a company still piling on debt is not turning around, regardless of what management says.
    • Compare against sector peers, since a stock can look cheap in isolation but still be expensive relative to healthier competitors.
    • Watch promoter and institutional holding changes, since insiders buying more shares during the recovery phase is a meaningful signal.

    Turnaround Stocks vs Value Stocks

    These are two different stocks, but people get confused. So, here is a simple differentiation that you should know:

    FeatureTurnaround StocksValue Stocks
    DefinitionCompanies recovering from financial difficultiesCompanies trading below their estimated value
    Financial ConditionWeak but improvingFundamentally strong and undervalued
    Growth PotentialDepends on a successful recoveryDepends on the market recognising the stock’s value
    RiskHighModerate
    Investment StrategyInvest during the recovery phaseInvest when the stock appears undervalued
    Time HorizonMedium to long termLong term

    Risks of Investing in Turnaround Stocks

    When you invest in turnaround stocks, there are some risks that you should keep in mind. These are:

    • Recovery may fail: A company may not achieve the expected financial recovery as expected. So, a deeper analysis is important.
    • High debt levels: Excessive debt can continue to affect profitability. This will limit the profit-making capacity. 
    • Difficult entry timing: Buying too early or too late is wrong and can impact the profit you can generate.
    • Value traps: A low-priced stock does not automatically mean it is a turnaround opportunity. It can be undervalued, so proper analysis is important.

    A Practical Approach to Evaluating One

    Before investing in a turnaround stock, consider these factors:

    • Review quarterly results: Before investing, check for 4-6 months of data. This would be helpful in proper analysis. 
    • Assess management performance: Check the results and see if the management delivered what it promised previously. 
    • Compare with competitors: Start with the analysis of the company and its competitors. See how they sit in the entire sector.
    • Monitor financial trends: You must check the cash flows and revenues. The focus on debt and liabilities is important as well. 
    • Invest cautiously: Turnaround stocks carry a higher risk. This means you should not invest a lot, but try to balance the portfolio.

    Sectors Where Turnarounds Show Up Most Often

    Some sectors see turnaround stories more frequently than others, simply because of how their business cycles work.

    1. Banking and NBFCs

    A spike in bad loans can hammer a lender’s stock for years, and a genuine turnaround usually shows up as shrinking non-performing assets alongside improving provisioning coverage, quarter after quarter.

    2. Metals and commodities

    These businesses are naturally cyclical. When you look at a company that was broken during a commodity downturn, you can see a completely different situation once prices recover and cost discipline from the tough years sticks around.

    3. Aviation and capital-intensive industries

    High fixed costs mean these businesses swing hard between profit and loss. This will depend on fuel prices, demand, and competition. This can create frequent turnaround setups when a weak player restructures its cost base.

    4. Pharma and manufacturing facing regulatory issues

    A company that resolves a regulatory problem, like a manufacturing facility clearing a compliance issue, can see a sharp re-rating once the overhang lifts, even if the core business barely changes.

    None of this means every stock in these sectors is a turnaround candidate. It just means the pattern shows up more often here than in steadier, less cyclical businesses.

    Read Also: What is Price Action Trading & Price Action Strategy?

    Conclusion

    Turnaround stocks reward investors who do the work, like reading past the headline price drop, checking whether the fundamentals are actually improving, and being honest about how much risk they’re taking on. The characteristics are consistent across most genuine turnaround stories: a management change, a defined strategy shift, improved cash flow, and a valuation still lagging the recovery. If you miss any one of these, you’re likely looking at a value trap wearing a turnaround story’s clothes. 

    Pocketful’s screener lets you filter stocks by debt trend, margin improvement, and valuation metrics directly, making it easier to separate genuine turnaround candidates from stocks that just look cheap.

    S.NO.Check Out These Interesting Posts You Might Enjoy!
    1What is Insider Trading?
    2What is Options Trading?
    3What Is Day Trading and How to Start With It?
    4What is Quantitative Trading?
    5How to Trade in the Commodity Market?

    Frequently Asked Questions (FAQs)

    1. What is the difference between a turnaround stock and a penny stock? 

      A turnaround stock is a company recovering from a specific period of weak performance, regardless of its price level. A penny stock refers purely to a low share price, often under ₹10, and doesn’t necessarily involve any recovery story at all.

    2. How long does a typical stock turnaround take? 

      There’s no fixed timeline. Some companies show measurable improvement within two to three quarters. But then there are companies that might take a year to recover.

    3. Are turnaround stocks safe for beginner investors? 

      Not particularly. They carry a higher risk than established, financially stable companies since the recovery isn’t guaranteed. Beginners should size these positions small, then work around to come to the right point.

    4. What financial ratios matter most when evaluating a turnaround stock? 

      Debt-to-equity trend, operating cash flow, and PE or PB ratios are some of the key factors to consider. These can show the company’s finances and can help you judge the performance better.

    5. Can a turnaround stock fail even with a strong strategy? 

      Yes. Execution risk, industry headwinds, and excessive debt can all derail a well-planned turnaround. This is why tracking actual quarterly results matters more than trusting management’s stated intentions alone.

  • Open Free Demat Account

    Join Pocketful Now

    You have successfully subscribed to the newsletter

    There was an error while trying to send your request. Please try again.

    Pocketful blog will use the information you provide on this form to be in touch with you and to provide updates and marketing.