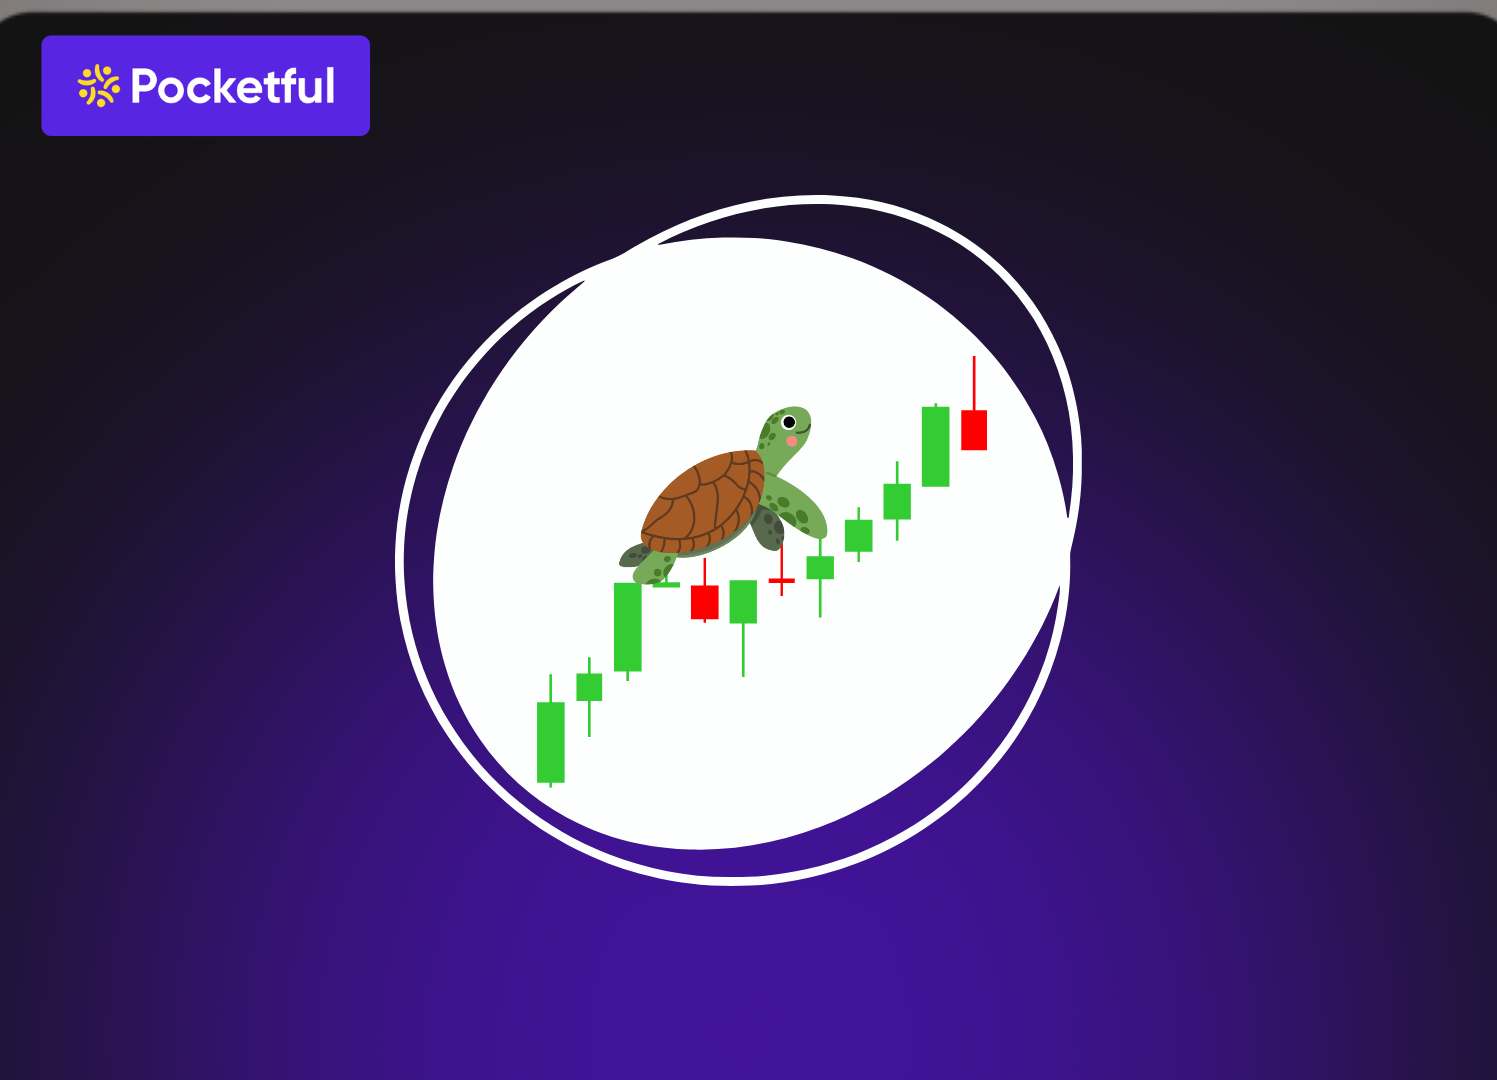
Category: Trading

  • 10 Best Price Action Trading Books

    10 Best Price Action Trading Books

    When it comes to the markets, there are two primary approaches: technical analysis and fundamental analysis. While fundamental analysis focuses on evaluating the intrinsic value of an asset, technical analysis studies price movements through charts and patterns. Among various technical approaches, price action stands out for its simplicity and effectiveness, as it emphasizes understanding raw price movements without relying on complex indicators.

    In this blog, we will give you an overview of the top 10 best price action trading books.

    What is Price Action?

    Price action is a study of price movements of a stock plotted over time, and traders make decisions based on these historical price movements. The traders who trade based on the price action focus more on chart patterns, candlesticks, trendlines, support and resistance, etc. Traders and analysts who use price action examine key elements such as:

    • Chart patterns (like triangles, flags, or head-and-shoulders) to predict potential market direction.
    • Candlestick formations, which provide insight into market psychology (e.g., bullish/bearish reversals).
    • Trendlines, which help identify whether the market is trending upward, downward, or moving sideways.
    • Support and resistance levels, which indicate where the price is likely to pause, reverse, or break out.

    By interpreting these, traders get an idea about the market sentiment directly from price movements.

    Read Also: What is Price Action Trading & Price Action Strategy?

    10 Best Price Action Trading Books

    Book TitleAuthorYearGoodreads Rating
    Martin Pring on Price PatternsMartin J. Pring20044.14
    A Complete Guide to Volume Price AnalysisAnna Coulling20134.24
    Forex Price Action and ScalpingBob Volman20114.13
    The Market WizardsJack D. Schwager19894.25
    Japanese Candlestick Charting TechniquesSteve Nison19914.31
    Trading Price Action TrendsAl Brooks20114.06
    The Art and Science of Technical AnalysisAdam Grimes20124.23
    Encyclopedia of Chart PatternsThomas Bulkowski2000/054.09
    The Ultimate Trading GuideJohn R. Hill20003.25
    Price Action BreakdownLaurentiu Damir20154.2

    Read Also: Best option trading books

    Overview of Best Price Action Trading Books

    An overview of the best price action trading books is given below:

    1. Martin Pring on Price Patterns

    This book was written by Martin J. Pring in 2004. It is a comprehensive guide that explains the steps to use price patterns, such as head and shoulders, triangles, etc. Pring was a renowned technical analyst, and with his extensive experience, he wrote this book, which has helped many traders. In his book, he has covered all the relevant topics such as support and resistance, trendlines, etc. Martin Pring explains the formation of these patterns and the method to use them effectively.

    What will you learn?

    • A trader will learn to identify and analyse different patterns like double top, head and shoulder, etc.
    • Entry and exit points based on the patterns.
    • Combining the price with the volume and moving average.
    • Reliability of patterns and failure indicators.
    Martin Pring on Price Patterns

    2. A Complete Guide to Volume Price Analysis

    This book was written by Anna Coulling and was published in 2013. This book explains the concept of volume price analysis, which combines the volume and price movement of a stock to identify its strength of bullish or bearish market moves. This book helps a trader in identifying false breakouts and improving their decision-making. It offers the trader a practical way to understand the market moves without relying on indicators.

    What will you learn?

    • How the market moves can be predicted using price and volume.
    • Using volume signals to identify buying and selling pressure.
    • Using volume confirmation to identify a false breakout.
    • Understanding the various phases of the market, such as accumulation and distribution.
     A Complete Guide to Volume Price Analysis

    3. Forex Price Action and Scalping

    The book was published in 2011 and was written by Bob Volman. This book is suitable for traders who are interested in manual scalping and want to do scalping in a short time frame. They are preferred by the traders who generally trade in the currency segment. However, the book also focuses on proper risk management.

    What will you learn?

    • Techniques for scalping based only on price movement.
    • How to take a trade based on a 5-minute chart pattern.
    • Real chart pattern examples along with a detailed explanation of it.
    • Strategies for fast entry and exit in forex trades.
    Forex Price Action and Scalping

    4. The Market Wizards

    The author of the book was Jack D. Schwager, and the book was first published in 1989. This book details the in-depth interviews of the most successful traders of that time. Those traders made their fortune in different market segments, including stocks, forex, commodities, etc. The major takeaways of the book are risk management, patience and discipline. The book is in conversational form. All traders seek inspiration from this book.

    What will you learn?

    • Perspective of successful traders.
    • The psychological traits required for trading price action.
    • Risk management techniques.
    • How to modify their trading strategies based on changing market dynamics.
     The Market Wizards

    5. Japanese Candlestick Charting Techniques

    The book was first published in 1991 and was primarily focused on the usage of candlestick patterns in the modern trading world. The author of the book is Steve Nison. This book can be a foundation for traders who want to learn the art of candlestick patterns and how they can reveal market segments. This book navigates a trader from basic to advanced usage of chart patterns. It covers numerous candlestick patterns and how to combine them with other technical tools.

    What will you learn?

    • The evolution and importance of the candlestick pattern.
    • How to use a candlestick pattern along with other technical tools.
    • Understanding the psychology of the market, which influences candlestick formation.
    • Detailed explanation of reversal and continuation patterns with examples.
    Japanese Candlestick Charting Techniques

    This series of books was first published in 2011 and was written by AL Brooks. This book is not suitable for beginners, as it is highly technical. The techniques presented in this book are applicable across all time frames. The book is based on identifying the trading ranges and their breakouts and helps a trader in finding out the false breakouts. This book presents a systematic and detailed approach to analysing every candlestick pattern.

    What will you learn?

    • One to five-minute charts are used for analysis of small price action.
    • Recognising patterns, breakouts and reversals. 
    • Deep analysis of price structure, without studying volume.
    • Calculating the support and resistance levels

    7. The Art and Science of Technical Analysis

    The book “The Art and Science of Technical Analysis” was written by Adam Grimes and was published in 2012. The book primarily focused on a data-driven approach to studying technical analysis and price action. The author was a successful trader and has traded for various proprietary firms, hedge funds, etc. The book stresses the importance of stop loss and target. Adam Grimes explains what works in the market and what does not, and the importance of removing guesswork from the price analysis.

    What will you learn?

    • The reason behind the changes in market price.
    • Recognition of pattern by statistical analysis.
    • Duration of the effectiveness of the price trend.
    • Practical and realistic trading strategies.
    The Art and Science of Technical Analysis

    8. Encyclopedia of Chart Patterns

    This book was first written and published in 2000, and in 2005, its second edition was published. The book focuses on statistical and visual examples of chart patterns. In this book, almost every trading chart pattern is included. This book is generally used by swing and positional traders. This visual book is suitable for traders who wish to understand the real reasons behind every pattern. The writer of the book, Thomas Bulkowsky, shows the success and failure rate, and the average returns of different candlestick formations.

    What will you learn?

    • Failure and success rate of the candlestick pattern.
    • How to trade and handle trades based on each pattern.
    • Finding rare and potential formations.
    • A comprehensive collection of performance statistics and chart patterns.
    Encyclopedia of Chart Patterns

    9. The Ultimate Trading Guide

    This book was written by John R. Hill and was published in 2000. The book combines the trend-following strategy and technical analysis, followed by effective money management strategies. The book teaches traders to build their strategies using effective techniques. It introduces the method to develop, test and trade complex and structured strategies considering the price behaviour of the market.

    What will you learn?

    • How to use quantitative price action techniques.
    • Establishing and evaluating a trading system.
    • Understanding both the psychological and technical aspects of trading.
    • Analysing the chart to understand the entry and exit points.

    10. Price Action Breakdown

    Price Action Breakdown was written by Laurentiu Damir and was published in 2015. In this book, the author focuses on a simplified and practical approach to trading based on price action. The book primarily focuses on the foreign exchange (forex) market and introduces an approach that emphasizes the analysis of market movement, structure, and the psychology behind it. The book explains how to identify important levels and execute trade setups based on it.

    What will you learn?

    • Basic price action concepts made easy for beginners.
    • Key strategies using important price levels.
    • How to analyse support and resistance levels, trends, etc.
    Price Action Breakdown

    Read Also: Best Stock Market Traders in the World

    Conclusion

    On a concluding note, various traders have shared their experiences and successful strategies in different books written by them. Those price action trading books help new traders in refining their strategies without relying on too many indicators. No matter whether you are an experienced or a novice trader, these books help you in building a strong foundation, and by reading them, you can create a trading strategy that suits your trading style. However, it is advised to consult your investment advisor before executing any trades.

    S.NO.Check Out These Interesting Posts You Might Enjoy!
    1Price Action Analysis: An Easy Explainer
    2Top 10 Books for Beginners in Trading & Investing
    310 Best Algorithmic Trading Books
    4What is Scalping Trading Strategy?
    65 Must-Read Best Swing Trading Books for Trader

    Frequently Asked Questions (FAQs)

    1. What is the meaning of price action trading?

      Price action trading is an approach that involves analyzing and making decisions based on historical price movements, often using candlestick patterns, chart structures, and key price levels.

    2. Can I start trading by reading the best price action trading books?

      Yes, one can learn the art of price action trading by reading the best price action trading books. However, it is advisable to consider your risk profile, trade by keeping a stop-loss and only after consulting your investment advisor.

    3. Is price action trading useful only in forex trades?

      No, price action trading is effective in different market segments such as equity, commodities, forex, etc.

    4. What are some of the best price action trading books?

      The best price action trading books are Martin Pring’s on Price Patterns, A Complete Guide to Volume Price Analysis, Price Action Breakdown, etc.

    5. What is scalping?

      Scalping is a trading approach in which the trader quickly takes entry and exits from trading positions in large quantities and tries to take advantage of small price movements.

  • Margin Against Shares: How Does it Work?

    Margin Against Shares: How Does it Work?

    Have you ever wanted to trade but didn’t have enough cash on hand while holding stocks you believe will perform well and don’t want to sell? This is where Margin Against Shares (MAS) comes in. It’s a popular and highly effective facility that allows you to borrow funds by pledging the shares you already own, giving you the liquidity to trade without having to sell your investments.

    We’ll explain the concept of Margin Against Shares (MAS) in an easy-to-understand way with an example. Moreover, we will discuss its advantages and disadvantages.

    Understanding Margin Against Shares 

    Consider it this way – You have shares in your demat account. When you need more money to trade, you can pledge these shares to your broker rather than selling them. You receive a certain amount of money (also referred to as “pledged margin”) in exchange, which you can use to trade more stocks or derivative contracts. 

    How Does it Work? 

    Usually, it goes like this:

    1. You have shares in your demat account.
    2. You request that your broker pledge those shares.
    3. After evaluating their eligibility, the broker informs you of the margin you will receive, which is normally between 50% and 80% of the total value.
    4. That sum is credited to your trading account as pledged margin.
    5. Now you can trade with it. 
    6. You can unpledge your shares if you no longer need margin to trade.

    Example: Suppose you own ₹1,00,000 worth of ABC stock. Your broker gives you a ₹60,000 margin (at 60%) after you pledge it. You can now trade with more purchasing power without having to sell your shares or transfer additional funds.

    Read Also: Margin Pledge: Meaning, Risks, And Benefits

    Benefits/Risks of Margin Against Shares 

    Benefits 

    1. You Are Not Required to Sell Your Stocks

    You want to trade but do not want to part with your long-term holdings? Instead of selling your shares, MAS allows you to borrow against them.

    2. Easy Access to Money

    All you have to do is pledge your shares to access funds, which can sometimes be fulfilled within a matter of hours.

    3. Increased Profit Potential

    Your money stays invested in your shares while also being used as collateral for trading, allowing you to maximize the potential of your capital.

    4. Do With It As You See Fit

    You may use the pledged margin to trade F&O or additional stocks on an intraday basis.

    5. The shares are still yours.

    You still receive dividends, bonuses, and other benefits even though your shares are pledged.

    Risks 

    1. Markets May Be Volatile

    Your margin limit also decreases if the value of the shares you pledged declines, and your broker may request that you deposit additional money or pledge additional securities.

    2. Your Shares May Be Sold

    Your broker may sell your pledged shares or square off your trades to make up the difference if you don’t fulfill margin requirements promptly.

    3. Interest Charges May Increase

    It is not always free to use the margin. Trading in F&O contracts may attract interest charges if the cash component of the margin requirement is funded by your broker.

    4. Not Every Stock Is Permitted

    Not all shares are allowed for availing margin against shares. You can only pledge shares that are approved by your broker and permitted by regulatory authorities.

    5. Significant Losses

    You could be tempted to trade more than you should if you have additional money. Additionally, overtrading in the market can quickly result in significant losses.

    Read Also: What is Stock Margin?

    Conclusion 

    If you wish to do trading without depositing additional funds and selling your favourite stocks, using margin against shares is a wise choice. It is efficient, enhances profit potential, but also involves risks. Therefore, if you want to use it, start small, stay informed, and never trade beyond your comfort level. When used properly, MAS can be an effective tool for increasing your profits without affecting your long-term investments.

    S.NO.Check Out These Interesting Posts You Might Enjoy!
    1What is Pledging of Shares?
    2Top Tips for Successful Margin Trading in India
    3Features and Benefits of Demat Account
    4Smart Beta Funds: Characteristics, Factors, Benefits, and Limitations
    5Different Types of Trading in the Stock Market

    Frequently Asked Questions (FAQs)

    1. Is it possible for me to sell pledged shares at any time?

      No, you must first unpledge them.

    2. What would happen if stock prices fell?

      A margin call to transfer additional funds or pledge additional securities might be sent to you by your broker.

    3. After pledging, how long does it take to receive the margin?

      Usually within one working day, you get access to margin funds.

    4. Is it possible to use a joint account for this?

      Yes, but it might require approval from both account holders.

    5. Is this something that all brokers provide?

      Check with your broker; the majority of full-service and discount brokers currently offer this facility.

  • How to Use AI for Stock Trading?

    How to Use AI for Stock Trading?

    Have you ever thought about whether you could trade stocks like Wall Street experts using artificial intelligence (AI)? AI is increasingly being used in the world of investing, and it’s no longer limited to large institutions or tech experts.

    Nowadays, anyone can use AI tools to predict stock prices, automate strategies, track market trends, and improve their trading decisions. You do not have to be a software developer or data scientist to get started. In this guide, we’ll explain what AI trading is, how it works, and how you can start using it.

    What is AI Trading? 

    Consider artificial intelligence (AI) as a very intelligent assistant that can analyse extensive volumes of data, such as historical stock prices, news headlines, social media noise, and identify trends that could help you predict a stock’s future price movements.

    AI can assist with trading in the following ways:

    • Recognising patterns and forecasting prices
    • Examining sentiment in tweets and news
    • Automated trade execution
    • Rebalancing portfolio 
    • Managing risk

    Evolution of AI in Stock Trading 

    Trading stocks has advanced significantly. In the past, it was all about being intuitive and the people you knew. These days, computers can read news articles, analyse tweets, and make trades more quickly than a human could.

    How did we get here, then? Let us take a quick look back at how artificial intelligence (AI) gradually but steadily entered the stock market.

    Before 1980s 

    Imagine traders yelling across the floor, phones ringing nonstop, and stock prices scrawled on notepads. There were no advanced models or fast computers, so people relied on their experience, intuition, and the morning paper while making decisions. Everything was manual, emotional, and, well, a little chaotic.

    1980-90s

    With the introduction of personal computers, things began to change. To test strategies, traders started using spreadsheets and basic formulas. It was the first time that people could analyse actual data before making a trade, but it wasn’t AI. This period created the foundation for “quantitative trading,” in which reason and statistics began to take first place over intuition.

    Early 1990s

    The 1990s saw a boom in trading. High-frequency trading, or HFT, began when computers began to make thousands of tiny trades per second.

    This was not AI. It was more like automatic, lightning-fast math. Nonetheless, it suggested a major shift from human-driven to rule-based automation.

    Late 1990s

    Things started to get fascinating at this point. Traders started feeding previous market data into algorithms that could learn and get better over time as machine learning gained popularity. Traders started allowing computers to make decisions on their own instead of following only predefined instructions. This strategy was used by prominent hedge funds like Renaissance Technologies, which are extremely successful and secretive, and quietly control the markets.

    Early 2010 

    We were all overwhelmed by information in the 2010s. At that point, AI advanced further by learning to read and comprehend human language. In a shorter period than it would take a human to read the article, tools that use natural language processing (NLP) could determine whether the sentiment surrounding a stock was positive or negative and take appropriate action.

    With robo-advisors and app-based tools suggesting portfolios based on individual goals and risk tolerance, retail investors also began to benefit.

    Fast Forward to Now 

    AI is more intelligent, faster and widely available than before. Deep learning models can forecast stock price trends by identifying patterns that humans might miss. Large language models are useful for writing trading strategies, carrying out market research, and even coding.

    Read Also: How AI is Transforming Stock Market Predictions

    How AI Trading Works?

    A basic framework of how AI trading works is given below:

    1. Identifying Trends and Formulating Forecasts: It is possible to train AI tools, particularly those that employ machine learning, to identify patterns in past stock data. They improve their ability to forecast the possible behaviour of particular stocks over time. Imagine it as a more advanced form of technical analysis, only faster and more accurate.

    2. Sentiment Analysis: Artificial intelligence (AI) systems can search the internet for anything, including news articles, financial reports, Reddit posts, and tweets. They can very quickly ascertain whether the general sentiment regarding a particular stock or industry is favourable or unfavourable. This is referred to as sentiment analysis, and it can help you in anticipating the market’s reaction.

    3. Trading Automatically Using Predetermined Rules: When trades are carried out automatically in response to a set of instructions, this is known as algorithmic trading, or algo trading. These rules can now be adjusted in response to real-time data when AI is added. A bot can buy or sell for you depending on the state of the market.

    4. Optimising Your Portfolio: Artificial intelligence (AI) tools can analyze your investments and make recommendations for strategies to lower risk or increase returns. They perform this by examining the movement of various assets and determining the best combination depending on your objectives.

    5. Recognizing Risks: By identifying unusual activity, abrupt volatility, etc. AI can even help you avoid mistakes, thereby helping you manage risk.

    Steps to do AI Trading 

    1. Learn Key AI Concepts: Before you start working with artificial intelligence (AI), learn the basics, including how it can recognise patterns, predict trends, assess the sentiment of news, and automate trades. You don’t have to be a tech expert to understand the problems AI helps to solve in the trading industry.

    2. Pick suitable AI Tools: Choose tools based on your goals and skill level. Professionals might look into QuantConnect, while beginners can begin with no-code platforms. Verify that the tool supports automation, real-time data, and backtesting.

    3. Build your AI Trading System: After selecting a platform, create a trading strategy. Before going live, analyze historical data, establish risk limits, set entry and exit rules, and execute backtests to observe how your AI system performs in various market scenarios.

    4. Use AI Features Effectively: Make use of AI tools for price prediction, pattern recognition, sentiment analysis, and portfolio optimisation. For example, some AI models can alert you when a stock is overbought or automatically adjust your holdings in response to market volatility.

    5. Combine AI with Human Oversight: AI is not perfect, so don’t rely solely on it. Watch your system closely and be prepared to take over control over trading when necessary. Combining market experience with AI’s speed yields the best results.

    Read Also: Benefits of AI in the Stock Market

    Conclusion 

    AI has significantly changed stock trading, evolving from human-driven decisions to systems that can learn, adapt, and even outperform experienced traders. This journey is still unfolding, making it an exciting time for both beginners and seasoned investors to explore how AI can enhance their trading strategies. It is advised to consult a financial advisor before trading.

    S.NO.Check Out These Interesting Posts You Might Enjoy!
    1Best AI-Based Trading Strategies Explained
    2How to Use AI for Smarter Investing in India
    3Can AI Predict the Stock Market?
    4How AI and Machine Learning Are Transforming Trading Strategies?
    5Stock Market Prediction Using Machine Learning in 2025
    6Scope of AI in Investing: Usage, Benefits, and Challenges

    Frequently Asked Questions (FAQs)

    1. Does using AI for trading require coding knowledge?

      No, not always! Without writing a single line of code, you can create AI-powered strategies with the help of no-code platforms.

    2. Is it possible for AI to forecast stock prices?

      Although no model is 100% accurate, AI can predict trends based on historical data. It is not a crystal ball, but a tool.

    3. Is AI trading meant for experts?

      Not at all! Even novices can use AI to automate processes or do more intelligent data analysis with today’s tools.

    4. Describe backtesting and explain its significance.

      Backtesting is the process of evaluating your approach using historical data to determine how well it would have worked. It keeps unpleasant surprises at bay.

    5. Is it possible for AI to eliminate trading risk?

      No. Although markets are unpredictable, AI can improve risk management. Always keep an eye on your plan and make necessary adjustments.

  • Difference between Margin Trading and Leverage Trading

    Difference between Margin Trading and Leverage Trading

    Leverage and margin trading are the two popular trading strategies used by traders to enhance their returns. These approaches make it possible to take larger positions than what one’s own funds would normally allow. However, it is necessary to understand the risk and difference between margin trading and leverage trading to use them effectively.

    In this blog, we will explain to you the key differences between leverage and margin trading.

    What is Margin Trading?

    Margin trading allows you to buy assets by borrowing funds from your stockbroker, enabling you to take larger positions than your available capital would otherwise permit. This can be done in two main ways:

    1. Pledged Margin – By pledging the shares you already hold in your demat account, you can unlock their value and use it as collateral to trade in your chosen assets. The pledged margin is always less than the current market value of the pledged securities.
    2. Margin Trading Facility (MTF) – Brokers also provide a facility where you can borrow additional funds directly to purchase stocks, often beyond the value of your holdings.

    Check Out – Stocks Available for MTF

    In exchange for providing MTF, brokers charge interest, which can range from 5.99% to 18% annually, depending on the broker. For instance, Pocketful offers one of the lowest interest rates in the market at just 5.99%. Interest accrues until the borrowed amount is fully repaid. Additionally, pledging charges may also apply when you use your existing shares as collateral.

    Read Also: What is Stock Margin?

    Features of Margin Trading

    The key features of margin trading are as follows:

    1. Initial Margin: A trader is required to deposit an initial margin before executing a trade using MTF. When using pledged margin, no additional cash margin is required upfront, as the pledged shares serve as collateral.
    2. Margin Call: In MTF, the broker issues a margin call, requesting additional funds, if the funds in the trading account drops below the minimum maintenance margin due to market movements against your trading position. In pledged margin, if your losses exceed the pledged margin, the broker can sell your holding to cover your losses. 
    3. Selected Securities: Not all stocks are eligible for margin trading. The list of securities that are allowed for margin trading is usually provided by brokers.

    What is Leverage Trading?

    Leverage is a feature that allows you to enter large positions by depositing a small amount of the entire trade value as a margin, and the remaining amount is paid by your broker. Generally, leverage is expressed in terms of multiples such as 5x or 10x. Leverage offered by a company depends on various factors, such as the market segment in which you are trading, such as cash, and derivatives segments. 

    Features of Leverage Trading

    The key features of leverage trading are as follows:

    1. Increased Market Exposure: Leverage trading increases both profits and losses by allowing traders to create large trading positions with small capital.
    2. Multiple Segments: Leverage trading provides flexibility across various market segments, such as stocks, forex, commodities, derivatives, etc.
    3. Short-term Trades: Leverage trading is typically used by traders to earn profit from short-term price movements, generally intraday.

    Read Also: Top 10 Highest Leverage Brokers in India

    Key Differences Between Margin Trading and Leverage Trading

    ParticularMargin TradingLeverage Trading
    Source of FundsInvolves borrowing funds from the broker either by: • Pledging Margin – Using existing shares in your demat account as collateral.
    • Margin Trading Facility (MTF) – Borrowing additional funds from the broker to buy stocks.
    Brokers provide extra capital (leverage) to take larger positions without requiring pledging of securities.
    Ownership of AssetsYou purchase and hold the shares in your account using the borrowed funds.You typically do not own the underlying asset as leverage is usually available on derivative instruments or on an intraday basis.
    Interest ChargesBrokers charge interest on the borrowed amount using MTF (usually between 5.99% – 18% annually). 
    Pledging charges may also apply to avail pledged margin.
    Leverage trading attracts no interest.
    Collateral RequirementRequires collateral ,i.e. your pledged shares for availing pledged margin. In MTF, shares purchased are pledged after purchase.Usually does not require pledging; only margin deposit is needed as security.
    Risk LevelLower relative to high-leverage trading since it is backed by pledged securities and regulated borrowing limits.Higher risk due to the ability to open much larger positions than your actual capital.
    PurposePrimarily used for long-term share purchases with additional funds.Often used for short-term speculative trades in derivatives, forex, or commodities.

    Benefits of Leverage and Margin Trading

    The key benefits of leverage and margin trading are as follows:

    1. Increased Purchasing Power: With leverage and margin trading, traders are able to execute larger positions than they could with their funds. This increases their capacity to take advantage of market opportunities without having to pay the entire amount upfront.
    2. Higher Profits: Even slight price changes may provide significantly higher returns than unleveraged positions.
    3. Opportunities in Any Market Direction – Whether the market is rising or falling, traders can capitalize on both bullish and bearish trends using various setups such as futures contracts, options, or margin-based short-selling.

    Read Also: Top Tips for Successful Margin Trading in India

    Risk Involved in Leverage and Margin Trading

    The various risks involved in leverage and margin trading are as follows:

    1. Increased Loss: Losses can also increase exponentially if there is an unfavourable price movement in the stock price.
    2. Margin Call: The broker may issue a margin call if a trader’s account value drops below the necessary margin limit. To meet the margin requirement, the trader must either liquidate their current positions or make additional deposits. 
    3. Auto Square Off: If the price falls below a certain level and the trader fails to deposit the additional margin required, then the broker can square off the position.

    Conclusion

    Both leverage and margin trading can significantly boost profits but also increase risk exposure. While margin trading involves borrowing against existing assets or availing a margin facility (MTF) for long-term share purchases, leverage trading is typically used for short-term speculative positions. Understanding these differences and applying sound risk management strategies — such as using stop-loss orders and avoiding over-leveraging — is crucial. Always consult with a financial advisor before using these trading approaches.

    S.NO.Check Out These Interesting Posts You Might Enjoy!
    1Best Trading Apps in India
    2Lowest MTF Interest Rate Brokers in India
    3Margin Pledge: Meaning, Risks, And Benefits
    4Swing Trading vs Day Trading: Which Strategy Is Right For You?
    5Different Types of Charges in Online Trading

    Frequently Asked Questions (FAQs)

    1. Is there any difference between margin trading and leverage trading?

      Yes, both margin and leverage trading differ from each other as margin trading is a trading approach in which a trader borrows money from the broker by pledging their shares or takes a loan from the broker and pays interest against it. While in leverage trading, a trader deposits a small amount and borrows the remaining funds to increase their position over and above the capital deposited by them, usually to trade on an intraday basis.

    2. Do I need to have a special account for margin trading?

      No, you do not need a separate account to trade using margin trading facility (MTF).

    3. What is a margin call?

      A margin call is when your broker requests that you sell some of your shares or make additional deposits into your margin account in order to comply with the necessary maintenance margin level. This occurs when your leveraged position’s value significantly falls.

    4. Is there any difference between MTF and Margin Trading Facility?

      MTF is simply the acronym for Margin Trading Facility.

    5. How to manage the risk involved in leverage and margin trading?

      To manage risk, one must use stop-loss, avoid over-leveraging, and monitor their positions closely.


  • What is Momentum Trading?

    What is Momentum Trading?

    Imagine you are surfing a powerful wave not by expecting where it will form, but by locating it as it rises and taking the advantage of this rise as long as it lasts. This is the key characteristic of momentum trading, i.e., identifying a stock already in motion and capitalizing on its ongoing momentum to earn profits. 

    As the name suggests, momentum trading is a trading approach focusing on the buying and selling of stocks based on the trend, or ‘momentum’ they show. Like all approaches, it has its strengths as well as weaknesses but the core advantage of employing this strategy is the potential of generating significant profits with small capital when compared to other strategies.

    Momentum Trading: Concept, Procedure & Other Important Information

    Momentum trading in stock markets is based on the assumption that movements in prices tend to persist. If a security shows an upward movement, then it is expected to continue going upwards for some period, and the same concept applies in the case of downward movement.

    Professional momentum traders focus on identifying stocks or assets that display strong upward or downward momentum and adjust their positions accordingly. Unlike traditional investors who buy and hold for the long term, momentum traders operate with a shorter time horizon; typically holding positions for only a few hours, days, or at most, a few weeks.

    Important metrics and indicators to track momentum include : 

    • Trading volume 
    • Moving Averages
    • Relative Strength Index (RSI)
    • Moving Average Convergence Divergence (MACD)

    A trader enters a trading position upon confirming the existing trend and exits once the trend begins to weaken. For executing day trades with this approach, one practically only needs to scan for sustained movements. Traders looking to buy momentum stocks should be prepared to exit their positions as soon as signs of selling pressure emerge and vice-versa.

    Read Also: Momentum Investing: Meaning, History, Types & Advantages

    Momentum Trading Strategies 

    Trading with momentum is all about taking advantage of strong price moves. From experience and research, we discovered three powerful momentum strategies that professional traders use:

    1. Breakout Strategy

    This strategy features entry into trading positions as soon as the price breaks out of a significant support or resistance level and moves lower or higher respectively. Breakouts near key technical levels with huge volumes often lead to strong price movements in the direction of the breakout.

    Buy Signal : A buy signal is a breakout above resistance, accompanied by high volume. It indicates strong bullish sentiment and upward movement.

    Sell Signal : A sell signal is a breakdown below a support level. The drop should be accompanied with strong volumes showing strong bearish movement and potential for sustained price decline.

    2. Moving Average Crossover Strategy 

    This is another very popular momentum strategy. The Moving Average Crossover strategy employs two moving averages: a short one that closely follows the price curve and a longer one which acts as the trend indicator.

    Buy Signal : In this the trader gets the buying signal when the short term moving average (MA), like the short term 10-day MA, crosses above the long-term moving average which can be 50-day MA. This is known as the “golden cross”. This cross indicates some upward momentum.

    Sell Signal : This occurs when short-term such as 10-days MA drops below the long-term MA of 50-day. This is termed as a “death cross” and it signifies bearish prevailing momentum.

    3. Volume Spike Strategy

    Significant price movements are often preceded by unusual spikes in volume. This strategy aims to capitalize on the momentum that follows a spike in trading volumes. Also traders use this strategy to identify the breakouts, trend reversals and gauge the strength of momentum. 

    Buy Signal : The increase in price with the increase in volume suggests buying, indicating that the price may continue to move higher.

    Sell Signal : Similarly when the price as well as the volume starts to decrease indicates the right time to sell as it may further fall down.

    Things To Take Into Account Prior To Selecting Momentum Trading

    Rewarding as it may be, momentum trading depends on several key factors for successful execution. Before diving into this fast-paced strategy, consider the following:

    1. Level Of Volatility In The Market

    Momentum trading requires strong and sustained price movement to be truly effective. It is optimal in markets with volatile conditions as strong trends build up in a short period of time. On the other hand, these volatile environments can also be prone to fast reversals. If you choose to participate in the momentum trading, you must be comfortable holding positions in volatile market conditions where prices shift side to side in a matter of seconds.

    2. Risk Appetite

    In the case of risk tolerance, momentum trading is not the best option. Due to the necessity for quick decision-making as well as relatively large price movements, momentum trading has inherent risk. Adjusting your trades before your risk limits are reached, since prices can turn around as swiftly as they move in one’s direction, it is prudent to determine your risk tolerance well before starting momentum trading. 

    3. Market Timing

    Before a trade is made, timing the market is crucial. In momentum trading, getting in too early exposes you to false breakouts while getting in too late means you won’t be able to take most of the move. Timing your trades precisely with reasonable accuracy relies on practice as well as backtesting.

    4. Technical Tools & Indicators

    Effective momentum traders make use of technical analysis. An understanding of the MACD, Moving Averages, and even volume patterns is a must. It is important to select a trading platform like Pocketful as it supports real-time charting, speedy order execution, and offers alerts so that no trading opportunity is missed.

    5. Emotional Discipline

    Emotional impulses can result in poor decision making while looking to capitalize on the adrenaline rush associated with impulse trading. Emotional control and discipline in accordance with a well defined trading strategy is a necessity. Adhering to strategies instead of chasing profits often has better outcomes. In trading, being consistent and disciplined overshadows relying purely on gut instinct.

    6. Liquidity of Assets

    Assets and stocks with high liquidity must always be selected. Having the ability to enter and exit trades without affecting the price significantly helps you protect your profits. Stocks with low liquidity can be difficult to exit or cause losses because of slippage costs during unexpected market volatility.

    7. Brokerage Costs & Fees

    Trading has its costs and usually people overlook the trading charges associated with frequent trading. Compare the fee structure among different brokers as it is important to select a trading platform that has the lowest brokerage.

    Advantages of Momentum Trading

    Momentum trading offers several key benefits for active traders:

    • Quick Profits – This strategy works best for assets showing strong trends, allowing traders to realize profits within a short time frame.
    • Trend Following – It capitalizes on clear market trends by buying when prices are rising and selling when they begin to fall.
    • Simple Concept – The core principle is straightforward: “buy when others are buying and sell when others are selling”. The only requirement is to buy and sell before  the majority of market participants have made their trades.
    • High Liquidity – Momentum trades often involve highly traded assets with large volumes, ensuring quick execution.
    • Technical Analysis Tools– Momentum trading aligns well with popular technical indicators such as MACD, RSI, and moving averages, which help traders make informed decisions.

    Disadvantages of Momentum Trading

    Disadvantages of momentum trading are given below:

    • High Risk : Losses can be immense, if any time, a sudden price change occurs and stoploss is not present.
    • Requires Constant Monitoring : Momentum trading is often done in volatile market conditions, which requires constant adjustment to trading positions.
    • False Signals: Technical indicators or price action often generate false signals in assets with low trading volume.
    • Short-Term Focus: This style leads to a focus on short-term activity and is not friendly to long-term investors who are not usually active.
    • Market Dependency: Might perform badly in horizontal non-trending markets.

    What kind of events trigger movement? 

    • Positive earnings reports
    • Major product launches
    • Mergers & Acquisitions
    • Regulatory approvals
    • Bullish sector-wide news

    Strategy

    • Act early, if news breaks out in the pre-market session or immediately after the announcement.
    • Take advantage of the directional price movement, but make sure to set a suitable stop-loss above breakeven as news-based price action can also reverse direction quickly.

    Additional Tips

    • Put very tight stop-losses to defend against reversal moves.
    • Set trailing stops to secure your profits as the trade moves in your favor.
    • Stay disciplined while trading. Remember that holding onto trades for too long can result in losses if momentum is fading.
    • Always ensure you are following the trend, these types of strategies will only work in trending markets.

    Read Also: Different Types of Trading in the Stock Market

    Conclusion

    As you can see, momentum trading is an effective strategy to employ in actively moving markets. Make sure you have a clear understanding of what momentum trading is, how to implement momentum trading strategies, and risk management techniques.

    To succeed in momentum trading, one has to ensure that they enter a trade at the right time, and exit when the momentum begins to slow down. However, it is advised to consult a financial advisor before trading.

    S.NO.Check Out These Interesting Posts You Might Enjoy!
    1What is Scalping Trading Strategy?
    2What is Intraday Trading?
    3Difference Between Trading and Investing
    4What Is Day Trading and How to Start With It?
    5What is Tick Trading? Meaning & How Does it Work?

    Frequently Asked Questions (FAQs)

    1. What is the ideal time frame for momentum trading?

      Momentum Trading is often associated with Swing or Day trading, as long as it is paired with other strategies. Day traders select 5 to 15 minute timeframes as it enables them to capture short-time price shifts, while swing traders look at daily or weekly timeframes to capture trends lasting for a few days or weeks. 

    2. Can beginners do momentum trading?

      Absolutely. Anyone can start momentum trading, but it’s crucial to first build a strong foundation. Beginners should start with the basics of technical analysis, understand key indicators, and practice with paper trading before committing real capital.

    3. Is momentum trading safe?

      Like any trading strategy, momentum trading carries its own risks and rewards. Success largely depends on proper risk management, quick decision-making, and a solid understanding of market behavior.

    4. What indicators are best for momentum trading?

      The best indicators that can be used for momentum trading are the volume, Moving Averages and Moving Average Convergence Divergence (MACD). 

    5. How do I learn about momentum trading?

      To learn momentum trading, start by reading Pocketful blogs, experimenting with backtested strategies, and practicing through paper trading to build confidence before investing real money.

  • Top 10 AI Tools for Stock Market Analysis in 2025

    Top 10 AI Tools for Stock Market Analysis in 2025

    In today’s era, Artificial Intelligence (AI) has completely changed the way of investing and trading in the stock market. Earlier, investors relied mainly on charts, news, and personal judgment, but now AI can analyze hundreds of data points within seconds, providing deep insights into market trends and patterns.

    In this blog, we will talk about the top 10 AI tools, which are making stock market trading and investing in India easier, faster and more efficient.

    Why Use AI for Stock Market Analysis?

    AI is reshaping stock market analysis by combining speed, accuracy, and data-driven insights. Here’s why more investors are turning to AI for smarter trading decisions:

    • Reduces Impact of Human Emotions : Investment decisions are often influenced by fear, greed or herd mentality. AI is free from these human emotions and makes decisions based only on data. This makes investment decisions more rational.
    • Faster and In-Depth Data Crunching : AI can analyze thousands of data points such as price action, company news, social media sentiment and financial reports in a matter of seconds. Where it would take humans hours, AI can find trends in minutes.
    • Pattern Recognition : The neural networks inside AI systems can recognize chart patterns and behavioral trends that are often missed by humans. It can estimate potential direction of market movements by learning from past data.
    • Backtesting & Forecasting : AI-based models are trained and tested on historical market data (backtesting) and the model is used to estimate future possibilities. This also includes emotional sentiments, volume trends, and seasonal behavior.
    • Easily accessible : Earlier, the use of AI-based tools were limited to only large firms and hedge funds. But now there are many platforms in India that are making this technology available to retail investors for free or in affordable plans making smart analysis possible for everyone.

    10 AI Tools for Stock Market Analysis in 2025

    Tool nameKey AI Features
    ChatGPTQ&A, Report Summary, Market Signals
    Google NotebookLMSummarizes documents, AI research assistant
    TrendlyneAI stock screener, DVM score, SWOT analysis
    ET Money GeniusSmart asset allocation, Weekly portfolio rebalancing, Data-driven insights
    MarketSmith IndiaGrowth scores, stock ratings, AI screeners
    TradingViewAI indicators, backtesting, Pine Script tools
    StockGPTGenerates AI-based stock insights and earnings summaries
    DeepSeek Open-source LLM, used for custom financial data analysis
    SmallcaseAI-powered portfolio construction, robo-advisor insights, theme-based stock baskets
    Screener.in AIStock financial queries, market insights

    Overview of the Best AI Tools for Stock Market Analysis 

    An overview of the top 10 AI tools for stock market analysis is given below:

    1. ChatGPT (by OpenAI)

    ChatGPT is no longer just a general AI chatbot, but has become a serious research assistant for smart investors. In 2025, it is going to be used a lot for stock market-related queries whether it is understanding a company’s balance sheet, knowing the meaning of ratios like ROE or EBITDA, or finding sector-wise performance trends. The best part is that you can create your own custom GPT, like a GPT that just summarizes the daily news of Nifty 50 or one that explains IPO documents in a human-friendly format. This tool is very useful for investors and finance creators who need insights, quickly and with depth.

    2. NotebookLM (by Google)

    Stock market research involves a lot of PDFs, brokerage reports, and annual filings and this is where NotebookLM works wonders. It is Google’s AI-powered research assistant that intelligently extracts insights from your uploaded documents. If you have uploaded three years of financial reports of a company, this tool can instantly highlight key ratios, revenue patterns and even risk factors. This is especially useful for investors who do detailed research and don’t want to spend hours reading things manually.

    3. Trendlyne

    Trendlyne is an AI-powered stock analysis platform tailored for the Indian market. Its most special feature is its ‘Scores’, which analyzes durability, valuation and momentum simultaneously with the help of AI. You can use AI-based screeners in it that quickly identify specific criteria like ROE > 20% or debt-free companies. In 2025, ‘DVM alerts’ and AI-based earnings call summaries are also becoming popular. This tool is a goldmine for swing traders and short-term investors.

    4. ET Money Genius

    ET Money Genius is an AI-powered tool that creates personalized portfolio strategies tailored to your financial goals and risk appetite. It uses advanced algorithms to recommend smart asset allocation, ensuring your investments align with your objectives. The platform provides weekly portfolio rebalancing to keep your investments optimized and incorporates downside protection strategies to help safeguard against market volatility. By combining data-driven insights with dynamic portfolio management, ET Money Genius aims to maximize returns while minimizing risks, making investing simpler and more effective for users.

    5. MarketSmith India

    MarketSmith India is for investors who rely on strong fundamentals in stock picking. Its CANSLIM-based AI model filters high-growth stocks that have earnings acceleration, strong ROE and institutional buyer interest. Its smart charting tool shows you breakouts, base formations and key levels from the AI ​​perspective. MarketSmith’s updates in 2025 have made it a semi-automated decision support system especially for investors who want to create long-term wealth.

    6. TradingView

    TradingView, already a favorite platform for technical charting, has now integrated AI-powered indicators in 2025, making it even more advanced. These AI-driven tools can automatically detect patterns like head & shoulders, wedges, and flags in real time. You can even use them to highlight breakout zones or potential trend reversals, helping traders make faster and more informed decisions. Pro traders are leveraging these AI indicators for script automation and backtesting, making TradingView an essential tool for advanced technical analysis.

    7. StockGPT

    StockGPT is a niche AI ​​tool that focuses solely on earnings call transcripts. It reads earnings calls from Indian and global companies to give you instant summary, sentiment analysis, and key financial commentary. You can ask, “What is Microsoft’s earnings guidance for FY26?” — and it will give you the data in seconds. This tool has become quite valuable for fundamental investors, analysts, and even brokerage research teams who want to avoid manual analysis.

    8. DeepSeek

    DeepSeek is an open-source large language model (LLM) that you can use for stock market research. If you are a quant developer, you can train it on historical price information and company financials to create your own personalized screener, recommendation bot, or trend predictor. It is perfect for professionals who want to move beyond ready-made tools and build their own AI ecosystem. In 2025, many fintech startups will integrate it into their internal research workflows.

    9. Smallcase

    Smallcase is a user-friendly investment platform that allows individuals to invest in stock portfolios curated by expert research firms such as InvestorAi and Wright Research. These portfolios, known as “smallcases,” are built using advanced AI-powered tools that analyze real-time market data to identify promising investment opportunities. Each smallcase is based on a specific theme, strategy, or sector, offering investors a diversified and research-backed way to grow their wealth. It’s ideal for those looking to invest smartly without picking individual stocks.

    10. Screener.in AI

    Screener.in, which was already India’s most trusted tool for fundamental analysis, has now become even better in 2025 with its new AI features. Its new AI assistant answers your questions directly based on financial data – like “How has been the profit growth of this company in the last 5 years?” or “Which stocks are available with low PE ratio and high ROE?” No need to pore over excel sheets anymore. Screener.in’s AI now helps users save time and do smarter stock filtering. This tool is ideal for investors who want to conduct in-depth research on Indian stocks using simple, natural language queries instead of complex manual analysis.

    Read Also: How AI is Transforming Stock Market Predictions

    How to Choose the Right AI Tools for Stock Market Analysis?

    You can choose the right AI tool for yourself by following the key points mentioned below:

    • Data quality and real-time updates : The power of AI tools lies in the data on which they are trained. Choose a tool that works with live and accurate data from trusted sources like BSE, NSE or SEBI, so that analysis is always current and reliable.
    • Data privacy and security standards : It is very important to keep your investment data secure. Make sure the tool encrypts your information and does not share it with any third-party without permission.
    • User friendly interface : Smooth running of AI tools on your mobile or laptops is a must in today’s investing lifestyle. Choose a tool whose mobile app is responsive, navigation is easy and you can use it from anywhere.
    • Custom features as per user-needs : Every investor has different needs: some want technical charting, some want fundamental screener. Choose a tool that offers features as per your trading/investing style.
    • Trial version or demo access : It is always better to test a tool before buying a premium version. See if the tool has a free trial or demo version available so you can test it out first.

    Tips to Use AI Tools Effectively

    AI tools are very powerful, but it would be wrong to think of them as instant profit-making tools. The right way is to use them as a support system—not the final decision maker.

    • Avoid blind trust: If a tool is telling you to buy or sell a stock, understand the reason behind it. Verify for yourself whether this signal is right according to your risk appetite and market context.
    • Backtest: Test any AI strategy on historical data before investing or trading using actual capital. This will give you an idea of ​​how that strategy has performed in the past.
    • Combine multiple tools: Don’t rely on just one AI tool. Try to combine sentiment analysis (like StockGPT), technical charts (like TradingView), and fundamentals (like MarketSmith or Screener.in AI) together—so that you get the complete picture.
    • Beware of black-box tools: Stay away from tools that just give recommendations but do not explain logic. Always choose platforms that provide transparency like why a buy/sell signal was given.

    Conclusion 

    Once limited to the IT domain, Artificial Intelligence has rapidly expanded its reach, and the stock market is no exception as AI is now driving smarter analysis, trend forecasting, automation, and informed decision-making for investors. Whether it is data analysis, catching trends or making research easier – AI tools can strengthen the investor’s understanding if used correctly. But always remember that the final decision should be yours. Choose wisely, verify AI suggestions to make informed investment decisions. It is advised to consult a financial advisor before investing.

    S.NO.Check Out These Interesting Posts You Might Enjoy!
    1How to Use AI for Smarter Investing in India
    2How AI and Machine Learning Are Transforming Trading Strategies?
    3Benefits of AI in the Stock Market
    4Best AI-Based Trading Strategies Explained
    5Can AI Predict the Stock Market?

    Frequently Asked Questions (FAQs)

    1. Can AI tools predict stock prices accurately?

      No, AI tools can not accurately predict stock prices but can make estimates based on past data and patterns.

    2. Are these AI tools suitable for beginners?

      Yes, but beginners should gain basic investing knowledge first to use these tools correctly.

    3. Do AI tools guarantee profits?

      No, investing based on recommendations made by an AI tool cannot give guaranteed profit. It just helps in decision-making.

    4. Is it safe to invest using AI tools in India?

      AI tools provide data-driven insights and help in decision-making, but investments require human judgment. Always consult a qualified financial advisor before making any investment decisions.

    5. Which is the best free AI tool for retail investors?

      Platforms like Screener and TradingView are easy to use for beginners.

  • What is Range Bound Market?

    What is Range Bound Market?

    Have you ever seen a stock oscillating within a defined price range for weeks? It neither goes up nor down; it remains confined within those levels. Such a situation is called a range bound market. When a stock or index is stuck in a fixed trading range, it is called a range bound stock or range bound market. Most new traders get confused about what to do at such times to earn profits, but professionals know that this is the time to use range trading strategies. In today’s time, when the market patterns are changing trends frequently, such a strategy has become even more important.

    In this blog, we will learn about the range bound markets and range trading strategies to take advantage of these price movements.

    What is Range Bound Market?

    When a stock or index moves up and down in a fixed range and neither moves upwards nor falls lower, it is called a range bound market. In this situation, the price remains trapped between a fixed support and resistance level.

    How to identify the Range Bound Market?

    You can identify a range-bound market by:

    • The price repeatedly moves between the same support and resistance
    • The market lacks directional momentum
    • Traders do not see long term trends, but there are profitable opportunities in the short term
    • In a trending market, the price continuously moves up or down
    • In a range bound market, the price keeps moving in a horizontal range
    • In a trending market, momentum indicators like MACD, Moving Average are more effective
    • Whereas in a range bound market, oscillators like RSI, Stochastic give more accurate signals

    Example : Suppose Nifty 50 moves between 24,500 and 25,000 for some time neither going up nor down. The price stops near 25,000 every time and then comes back to 24,500. This kind of behavior reflects a typical range bound market. In such a situation, traders who identify this range early can earn consistent profits by buying near support and selling near resistance. This is known as range trading and this strategy is even more effective when there is no major trend in the market.

    Characteristics of a Trading Range

    It is important to correctly identify a trading range before you can profitably execute buy and sell signals. Some of the characteristics of a trading range are given below:

    • Clear support and resistance levels : The first sign of any trading range is that the price repeatedly moves up and down between a certain support and resistance. These levels appear as virtual horizontal lines on the chart and are often based on old reversal zones.
    • Weak trend strength (Low ADX Value) : If the value of the ADX indicator is 20 or below, it means that there is no strong trend in the market. In this situation, the price remains sideways and it is a sign of a range bound market.
    • Flat Moving Averages : When the 50-day or 200-day moving averages appear in a straight line and there is no specific direction in them, it indicates that the market is stuck in a range.
    • Volume behavior : The trading volume remains low in the middle of the range and high near support and resistance. This indicates that traders are active near the support and resistance.

    Range Trading Strategies

    Some of the strategies and tips to trade range bound markets profitably have been given below:

    • Multiple Touch Confirmation : Use this strategy when price has tested the support and resistance levels at least two or three times. It is practical to create a trading position on the third rejection from support or resistance as it is considered a strong reversal signal. Traders who make consistent profits rely on this confirmation.
    • Channel (Diagonal) Range Trading : If support and resistance appear as sloping trendlines (ascending or descending channel), traders buy or sell near those trendlines. This is called diagonal or channel range trading, which can also capture some momentum. 
    • False Breakouts : Markets often feature situations where the price briefly crosses the support or resistance but is unable to sustain and comes back inside the range. At such times, traders can create trading positions in the opposite direction such as shorting the stock when price moves above the resistance squaring off positions when the price comes back inside the range. This strategy is used by professional traders.
    • Range Exhaustion & Consolidation Plays : When the price continuously bounces within the range and shows smaller candles and low volatility, it is a sign of exhaustion. In this situation, traders anticipate that a reversal may occur, and trade in the opposite direction after price rejection.
    ParametersRange Bound StocksTrending Stocks
    Price MovementMoves up and down between a defined support and resistanceMoves consistently in an uptrend or downtrend direction
    Trend PatternThere is no clear trend, there is sideways movementHigher highs and higher lows or lower highs and lower lows are formed
    Common SectorsFMCG, PSU, UtilitiesIT, Pharma, Auto
    Best Indicators to UseRSI, Stochastic Oscillator, Bollinger BandsMACD, Moving Averages, ADX
    Trading StrategyBuy at support and sell at resistanceIt is better to follow the trend using breakout or pullback strategy
    Risk-Reward RatioIt is limited but provides more consistent returnsRisk is slightly higher, but potential returns may also be higher

    Why Do Markets Become Range Bound?

    The various reasons behind why markets exhibit rangebound behaviour has been discussed below:

    • Fundamental Uncertainty : The market sometimes waits for a major economic or corporate event such as earnings season, central bank policy meetings, or international crises. At such times, investors become cautious and avoid taking directional trades, causing the price to move in a limited range.
    • Trend Exhaustion : When an asset has shown continuous bullish or bearish trend, it goes into exhaustion after a period of time. This situation is called the ‘consolidation phase’, where both buyers and sellers are cautious. In such a phase, the price repeatedly moves between support and resistance as neither bulls nor bears take control.
    • Institutional Indecision : Institutional investors and large traders, when confused about the direction of the market, adopt a wait and watch approach. This reduces volume and reduces volatility, due to which the market becomes sideways or range-bound.
    • Preparation for Bigger Moves : Range-bound markets are often seen as a quiet storm. This is the time when the market is accumulating energy in preparation for a big breakout or breakdown. So these phases are not about making money, but about carefully understanding the levels and preparing.

    Risks and Limitations of Range Trading

    The risks and limitations of doing range trading are given below:

    • False Breakouts leading to wrong decisions : The most common risk in range trading is the price suddenly moving out of the range and then returning. This is called a false breakout, which can hit your stop losses repeatedly.
    • Sudden changes due to news events : Due to sudden economic reports, such as RBI policy or global news, the market can move rapidly in one direction, which can cause losses.
    • Missing the trend : The market sometimes moves out of the range and enters a new trend. In such a situation, range traders often miss out on that big move due to which a big opportunity to profit is lost.
    • Timing Risk : Even a slight delay in entry or exit can reduce profit or increase loss. Correct timing is very critical in range trading.
    • Less profit in narrow ranges : If the market range is very tight, then the profit potential is very less. This results in low returns and sometimes the risk-reward is not worthwhile.
    • More Trading, More Charges : Range trading involves frequent buying-selling, which increases the cost of brokerage, taxes and slippage which can directly reduce net profit.
    • Low Volume : Sometimes liquidity is low in a sideways market. Due to this, orders are not executed quickly and you may have to face unwanted slippage.
    • Risk of Overtrading : Many traders start trading compulsively after seeing entry signals repeatedly in the range. This can lead to overtrading, decision fatigue and losses.
    • Effect on Psychology : Patience is most important in range trading, but constant sideways movement can lead to frustration, fear or overconfidence. These emotions can force you to make impulsive decisions.

    Conclusion

    Range trading requires market understanding, discipline and the art of taking timely decisions. It can be beneficial for traders who want to earn with consistency even in calm phases of the market. But like every strategy, there are hidden risks in it too, which should be understood before doing range trading. If you understand price levels, market psychology and breakout risks well, then you can make good opportunities even in range bound markets – all you need is patience and a clear trading strategy. However, it is advised to consult a financial advisor before range trading.

    S.NO.Check Out These Interesting Posts You Might Enjoy!
    1What is Algo Trading?
    2What is Spread Trading?
    3What is Quantitative Trading?
    4Arbitrage Trading in India – How Does it Work and Strategies
    5Silver Futures Trading – Meaning, Benefits and Risks

    Frequently Asked Questions (FAQs)

    1. What is the meaning of the range bound market?

      When a stock or index moves between a fixed levels and no major trend is seen, it is called a range bound market.

    2. Are range bound stocks good for trading?

      Yes, if you identify support and resistance correctly, then short-term profits can be earned.

    3. Is range trading suitable for beginners?

      This can be a good trading strategy for beginner traders, but some market knowledge and paper trading is necessary before using actual capital.

    4. How long does a stock stay in range?

      A stock can remain in the range from a few days to several weeks.

    5. What is the biggest risk in range trading?

      The biggest risk in range trading is a breakout, i.e.,  when the price moves out of the trading range.

  • What is Intraday Margin Trading?

    What is Intraday Margin Trading?

    Have you ever wondered how traders make huge profits from numerous minor price fluctuations in stock prices over a single trading day? Intraday margin enables a trader to trade in larger volumes with limited capital, helping them earn profits even with a small capital. However, using intraday margin also involves higher risks.

    This blog will explain intraday margin, its benefits and drawbacks, and the safety measures that all traders should take.

    Meaning of Intraday Margin Trading

    Intraday margin is the leverage provided by a broker to their clients, which allows them to buy or sell stocks worth more than the funds available in their trading account. However, the trading positions created using intraday margin have to be closed by the client on the same trading day. Using the intraday margin facility, a trader can potentially increase their gains. 

    Features of Intraday Margin Trading

    The key features of intraday margin are as follows:

    1. Same Day Square Off: The position taken by the client has to be closed on the same day.
    2. Auto Square Off: The position of the client can automatically be squared off before the end of the trading session of a particular day.
    3. High Profit: Using intraday margins can increase the profitability of the investor, as they can use the leverage to purchase stocks.

    How Does Intraday Margin Trading Work?

    The process of how intraday margin works is as follows:

    1. Select the Intraday Option: Instead of choosing “Delivery” when placing a trade, the trader chooses “Intraday” or “MIS (Margin Intraday Square-off)”. This means that the position will be closed that same day.
    2. The broker provides leverage: The broker provides leverage (for example, 5x to 20x) according to the stock’s volatility and liquidity.
    3. Executing Trade: The trader buys or sells shares using the available margin. For example, a trader can use ₹10,000 as a margin to buy 1,000 shares of a stock priced at ₹100 if 10x leverage is available.
    4. Monitoring the Trade: Throughout the trading day, the trader watches price movements to book profits or limit losses.
    5. Squaring Off Position: The trader must manually square off the position before the market closes; otherwise, the broker will execute it automatically.

    Example of Intraday Margin Trading

    Suppose you have ₹10,000 in your trading account, and you want to buy 100 shares of XYZ, trading at around ₹1,000 per share. Suppose you use the intraday margin with 10x leverage provided by your broker. Let’s calculate it

    Total Amount Required to Purchase 100 Shares = ₹1000 * 100 = ₹1,00,000

    Your broker will provide you with 10x leverage, hence your trading limit will increase to 1,00,000. Now you can purchase 100 shares on an intraday basis.

    Let’s assume you have purchased 100 shares at 10 a.m., and around 2 p.m. stock price rises to ₹1,050, and you sell your shares at ₹1,050. Now your profit will be calculated as follows:

    Profit = (Selling Price – Purchase Price) * No. of Shares

    = ( ₹1,050 – ₹1,000 ) * 100

    = ₹50 * 100

    = ₹5,000

    Hence, your total profit will be ₹5,000, and it was earned on the capital of ₹10,000. Therefore, your profit was 50% on your invested capital.

    Benefits of Using Intraday Margin Trading

    The key benefits of using intraday margin are as follows:

    1. Potential for Higher Returns: Traders with limited funds can take on large positions. For example, using 10x leverage to execute a ₹1,00,000 trade with ₹10,000 might result in higher profits.
    2. Liquidity: Intraday trades usually involve highly liquid stocks or indices, which ensure quick entry and exit without significant price fluctuations.
    3. Short-Term Profit: Through intraday margin trading, traders can profit from short-term market trends and volatility without holding positions overnight.
    4. No Delivery Charges: Since trades are squared off on the same day, demat settlement is not necessary, avoiding delivery-related fees such as transaction taxes and DP charges that apply to delivery trades.

    Read Also: Top Tips for Successful Margin Trading in India

    Risk of Using Intraday Margin Trading

    There is a significant risk of using intraday margin; a few of such risks are mentioned below:

    1. Increased Losses: Leverage increases losses in the same way that it increases profits. Even a slight decline in the stock price can result in significant losses.
    2. Volatility of the Market: Because of the extreme volatility of intraday markets, profitable trades can be quickly converted into losing ones by unexpected price changes caused by news, earnings releases, or market sentiment.
    3. Margin Call: A margin call, which requires the trader to deposit additional funds immediately, may be given by the broker if the value of a trade falls rapidly. And if you don’t add the margin amount, you might have to square off at a loss.
    4. Limited to Particular Stocks: Not every stock is eligible for margin. Brokers generally restrict trades by limiting margin trading to large-cap and highly liquid stocks.

    Precautions to Use Intraday Margin Trading

    An investor should take the following precautions before using intraday margin:

    1. Stop Loss: In case the stock moves against your position, always set a stop-loss to minimise your losses.
    2. Tracking: It is necessary to continuously monitor positions and market trends when doing intraday trading.
    3. Understanding Policy: In order to prevent unexpected difficulties during the trade, be informed of your broker’s leverage guidelines, auto square-off timings, and eligible stock list.

    Read Also: Top Indicators Used By Intraday Traders In Scalping

    Conclusion

    On a concluding note, for active traders with limited capital who desire to make significant profits from daily market movements, intraday margin trading can be a very effective tool. Increased exposure and the possibility of greater profits are made possible by the leverage it offers. However, a greater risk is associated with a higher reward. Traders need to approach intraday margin with careful planning, appropriate risk management, and a thorough knowledge of the broker’s policies. It is effective for people who can keep a close eye on the markets and act immediately. Intraday margin trading, when used properly, can be a useful tool for a trader; however, it is advisable to consult your investment advisor before making any investment decision.

    S.NO.Check Out These Interesting Posts You Might Enjoy!
    1Difference Between Intraday Trading and Delivery Trading
    2Understanding Intraday Trading Timings
    3How to Choose Stocks for Intraday the Right Way?
    4Top 10 Intraday Trading Strategies & Tips for Beginners
    5How to Use Pivot Points in Intraday Trading?
    6Bank NIFTY Intraday Options Trading: Steps, Strategies & Tips
    7Value Investing Vs Intraday Trading: Which Is More Profitable?

    Frequently Asked Questions (FAQs)

    1. What is the intraday margin?

      Brokers provide a facility called intraday margin, which allows traders to use leverage to buy or sell stocks with a small percentage of the total trade value. It is necessary to settle those positions on the same trading day.

    2. Is intraday margin available for all stocks?

      No. Brokers only offer margin on a limited number of volatile and liquid stocks, typically as per the regulatory guidelines.

    3. What will happen if I do not square off my intraday position?

      In case you do not exit your intraday position before the cut-off time defined by your broker, it will automatically square off the position.

    4. Can I use the intraday margin provided by the broker for short-selling?

      Yes, the intraday margin provided by the broker can be used for short-selling.

    5. Do I have to open a separate account to use the intraday trading margin?

      No, you can use your regular trading account to use the intraday trading margin.

  • What is Operating Profit Margin? 

    What is Operating Profit Margin? 

    If you have decided to invest in stocks and are looking to identify a company to invest in, then you need to compare companies based on various parameters. One of such parameters is the operating profit margin. 

    In this blog, we will explain the concept of operating profit margin, along with the formula and an example.

    Meaning of Operating Profit Margin

    Operating profit margin is a financial metric that reflects the percentage of a company’s revenue that is left after paying all the operating expenses related to production, including wages, raw materials, etc. before paying interest or taxes. 

    Features of Operating Profit Margin

    The key features of operating profit margin are as follows:

    1. Business Profitability: Operating profit margin reflects the efficiency of a company in generating profit from its core business operations.
    2. Comparative Analysis: The operating profit margin is generally used to compare the profit of the company with its competitors.
    3. Operating Expenses: Only items related to operating expenses are considered when calculating the operating profit.

    Formula of Operating Profit Margin

    The formula to calculate the operating profit margin is as follows:

    Operating Profit Margin = (Operating Profit/Revenue)*100

    Where;

    Operating Profit = Revenue – COGS – Operating Expenses

    Revenue = Total income earned by the company before any type of cost or expenses is deducted.

    Example of Operating Profit Margin

    Let’s understand the example of operating profit margin with an example.

    Company XYZ has made a sale of 

    • Revenue = ₹10,00,000 
    • Cost of Goods Sold = ₹2,00,000
    • Operating Expenses = ₹3,00,000 

    Now we will have to calculate the operating profit.
    Operating Profit = Revenue – COGS – Operating Expenses

    Operating Profit = ₹10,00,000 – ₹2,00,000 – ₹3,00,000 = ₹5,00,000

    The formula to calculate the operating profit margin is 

    Operating Profit Margin = Operating Profit/Revenue*100

    where,

    Operating Profit = ₹5,00,000

    Revenue = ₹10,00,000

    Operating Profit Margin = 5,00,000/10,00,000*100 = 50%
    Hence, the operating profit margin of XYZ Limited is 50%.

    Importance of Operating Profit Margin

    The importance of operating profit margin is mentioned below:

    1. Evaluation: Operating profit margin allows us to evaluate the efficiency of a company based on its operations. A higher margin shows that the company has lower input costs and higher sales.
    2. Profitability: A higher operating margin will increase the net profitability of the company.
    3. Competitive Advantage: When comparing companies with their peers, operating margins play an important role, as companies with lower profit margins are considered a financial trouble.
    4. Decision Making: Based on the operating margins, the company can decide the prices of their products and make decisions related to cost-cutting.

    Factors Affecting Operating Profit Margin

    The factors mentioned below will affect the operating profit margin:

    1. Raw Material: The input cost or the cost of raw material used by the company in producing goods can affect the operating profit margin. The higher the cost, the lower the profit margin.
    2. Labour Cost: If the labour cost is high, the operating profit will be less.
    3. Availability of Resources: If the resources are not available readily, then it can lead to an increase in production costs.
    4. Distribution Channel: If the channel through which the raw material is supplied or goods get delivered gets disrupted, then the cost of production will increase.

    Conclusion

    On a concluding note, operating profit margin plays an important role in evaluating the company’s efficiency in generating profits from its core business operations. Improving or high operating profit margin posted by the company over time indicates efficient management, effective cost control, and a competitive edge over other companies. However, investing based only on the operating profit margin is not a wise decision. Therefore, it is advisable to consult your investment advisor before making any investment decision.

    S.NO.Check Out These Interesting Posts You Might Enjoy!
    1Margin Pledge: Meaning, Risks, And Benefits
    2Margin Call: – Definition and Formula
    3Top Tips for Successful Margin Trading in India
    4What is MTF (Margin Trading Facility)?
    5Lowest MTF Interest Rate Brokers in India

    Frequently Asked Questions (FAQs)

    1. What is the formula to calculate operating profit margin?

      The formula to calculate operating profit margin is Operating Profit/Revenue*100.

    2. What is Operating Profit Margin?

      The operating profit margin is a financial metric used by investors to evaluate the operating profitability of a company, or the percentage of revenue left after covering the operational expenses of the company.

    3. What percentage is considered a good operating profit margin?

      The ideal operating profit margin depends on the industry in which the company is operating. A 15-20% of operating profit margins is considered good for manufacturing companies and it can be more than 25% in the service-oriented industry.

    4. Can the operating profit margin be negative?

      Yes, if the company’s operating expenses are higher than the company’s revenue, then operating profit margin can be negative, indicating that the company is in financial trouble.

    5. Can I invest in a company only because it has a higher profit margin?

      Yes, you can invest in a company with a higher profit margin. However, it is advisable to consider more parameters before making any investment decision as investment in stocks solely based on operating profit margins can result in losses.

  • What is Stock Margin?

    What is Stock Margin?

    One way to take bigger positions and potentially increase your profits in the stock market with limited capital is by using stock margin, also known as Margin Trading Facility (MTF). Many brokers offer this feature, allowing investors to increase their buying power. However, despite its popularity, a lot of traders use margin without fully understanding how it works. In this blog, we’ll break down what stock margin really is, how it works, and the risks you should be aware of before using it.

    What is Stock Margin?

    Stock margin, popularly known as Margin Trading Facility (MTF), is a service offered by brokers that allows you to borrow funds to increase your investment capacity. In simple terms, you can buy shares worth more than the actual funds available in your account.

    This is generally called leverage trading or margin trading. It is especially useful for those who want to trade in large volumes in the short term, but it also comes with risk as losses can also increase.

    Example: You have ₹1 lakh and want to purchase shares worth ₹5 lakhs, then the broker can provide the remaining ₹4 lakhs. This means that now you can buy shares worth up to ₹5 lakh. 

    How MTF Works : In the Margin Trading Facility (MTF), the investor can trade on the value of the entire transaction by investing a partial amount in his trading account. The remaining amount is lent by the broker, which has to be repaid with interest.

    How the trade is done:

    • You deposit some percentage of the total amount (Initial Margin).
    • The broker lends the remaining amount.
    • You buy shares and can sell them whenever you want.
    • The loan has to be repaid within the stipulated time, otherwise the broker can sell your shares.

    As per SEBI rules, MTF is available only on selected stocks and the minimum margin and interest rates in it are decided by the broker.

    If you want to do margin trading at a low cost, Pocketful is a great option. It offers margin trading at one of the lowest interest rates in India, starting at just 5.99% p.a., and you also get up to 5x intraday leverage. Pocketful is especially suited for investors who want to gain more exposure in a smart way, all on a fast, simple and reliable platform.

    Check Out – Stocks Available for MTF

    Types of Margins in Stock Trading

    There are many types of margins in margin trading, and each has a different role. If you want to trade seriously in the stock market, it is very important to understand them correctly. Below are the four major types of margins that are prevalent in the Indian market and are regulated by SEBI:

    • Initial Margin : This is the minimum amount that you have to keep in your account to open a position. As per SEBI rules, it is decided on the basis of VaR (Value at Risk) and ELM (Extreme Loss Margin). Its purpose is to ensure that the trader has enough capital to bear the initial risk.
    • Maintenance Margin : This is the minimum balance that you have to maintain in your account, so that you can hold an open position. If your funds go below this level, the broker may send a margin call and automatically close your position if required.
    • SPAN Margin (F&O only) : The SPAN (Standard Portfolio Analysis of Risk) margin is applicable only for the Futures & Options (F&O) segment. This margin is calculated by NSE through a simulation tool and is based on the risk of the entire portfolio, not just a single trade.
    • Exposure Margin : This is an additional safety margin mandated by SEBI and exchanges keeping in mind traders and market stability. It is charged over and above the SPAN and is generally applicable to all F&O trades. It is intended to provide extra protection during times of high volatility.

    Read Also: What is MTF (Margin Trading Facility)?

    Stock Margin vs Cash Trading

    FeaturesStock Margin TradingCash Trading
    Investment Amount Required Lower as broker provides additional fundingShares can only be purchased according to the amount of money you have in your trading account
    RiskHigh risk Low risk
    ReturnsHigher as profits increase quickly, but with increased riskStable returns
    InterestThe broker charges interest on the borrowed amount No interest has to be paid
    Delivery optionSome brokers allow delivery, but interest appliesUpon making full payment, shares are transferred to your demat account
    Margin Call RiskIf the price goes down the broker may ask for extra fundsThere are no margin calls
    Holding PeriodDepends on the policy of the broker.Can be held for the long term without any extra charges
    Better for whom?For active, short-term or intraday tradersFor long term investors and beginners

    Pros and Cons of Using Stock Margin

    Margin trading is a tool that can be beneficial if used wisely, but a careless trade can also cause losses. Let’s know some of its major benefits and potential disadvantages, in simple language:

    Pros of Stock Margin

    • Higher profit potential with less capital : With the help of margin, you can buy shares of large value even with less capital. This is especially beneficial for those who have limited funds but want more exposure.
    • Opportunity to increase returns : If your trade goes in the right direction, then due to margin you can get more profit than usual.
    • Best for short term traders : Margin is a useful tool for those who trade intraday or for a few days because with this they can take many positions quickly.
    • Smart use of capital : Due to margin, you can use your limited capital in different trades, which gives you a chance to take more profit.

    Cons of Stock Margin

    • Amplified Losses : While margin increases profits, it can also cause losses quickly. Even a little wrong move can prove to be costly.
    • Margin call risk : If the value of the stock falls, the broker may ask you to increase the money (margin call). If you do not respond on time, your shares will be sold.
    • Interest and charges : Interest has to be paid on the money borrowed. If the trade remains open for a long time, this interest can eat into your earnings.
    • Mental pressure : Many times trading on credit increases fear and anxiety, which can lead to wrong decisions.

    Read Also: Lowest MTF Interest Rate Brokers in India | Top 10 MTF Trading Apps

    Key Factors to Consider Before Using Stock Margin

    Some of the key factors to consider before using stock margin are given below:

    • Your Risk Tolerance : There is an opportunity to earn money in margin trading, but the loss can also be equally big. If you cannot bear the market fall or sudden loss, then margin is not for you.
    • Trading Experience Level : If you are a new trader, then taking margin without complete information can be dangerous. Using margin in the beginning without understanding the risk can cause huge losses.
    • Brokerage Policies : The funding policy of every broker is different. Some brokers offer MTF (Margin Trading Facility) while some give margin only on MIS orders. SEBI sets minimum margin norms, but brokers may impose higher margins or lower leverage
    • Interest Rates & Charges : The margin amount attracts interest. Some brokers like Pocketful offer margin at a minimum interest of just 5.99%, while others can go as high as 12-18%. These charges can reduce your profits.
    • Stock Volatility : If you are trading in very volatile stocks, they are more likely to get margin calls. Less stable stocks have higher margin risk.

    Margin Trading Facility (MTF) is a regulated service in the Indian stock market that is run under strict rules of SEBI. Its purpose is to ensure that investors are protected and brokers do not take unnecessary risks. SEBI has issued clear guidelines for all aspects related to MTF – such as which stocks are eligible for MTF, how much margin has to be paid, and to what extent the broker can provide funding. It is mandatory for all registered brokers to follow these rules.

    Margin Calculation : Margin is determined according to two types of stocks:

    • F&O stocks have relatively less margin due to low risk.
    • On the other hand, non-F&O or low-liquidity stocks require more margin.

    The broker uses variable margins such as VaR (Value at Risk) and ELM (Extreme Loss Margin) while calculating the margin.

    Collateral and Pledge Process : When you buy shares through MTF, those shares are pledged and pledged with the broker. Now this process has become automatic in almost all brokers, meaning the investor does not need to give any pledge approval manually.

    Margin Call and Risk Control : If the value of your portfolio falls, the broker alerts you about margin shortfall. If the value goes below the set limit, the broker can sell your shares — but before that you are given an opportunity to deposit additional margin.

    Conclusion

    If you want to take much larger trading positions with less capital, then Margin Trading Facility (MTF) can be a good option. But as beneficial as this facility seems, it also needs to be used wisely. Every broker’s terms and interest rates related to this facility are different, so it is important to compare different brokers before making any decision. With proper risk management, you can get good returns using MTF. It is advised to consult a financial advisor before using MTF.

    S.NO.Check Out These Interesting Posts You Might Enjoy!
    1Margin Pledge: Meaning, Risks, And Benefits
    2Margin Call: – Definition and Formula
    3Top Tips for Successful Margin Trading in India
    4Smart Beta Funds: Characteristics, Factors, Benefits, and Limitations
    5Different Types of Trading in the Stock Market

    Frequently Asked Questions (FAQs)

    1. What is MTF in the stock market?

      MTF means Margin Trading Facility, in which you can buy shares by taking a loan from your broker.

    2. Is MTF safe for beginners?

      MTF can be a little risky for beginners as a well defined trading strategy and proper risk management is key to earn profits.

    3. How much interest is charged in MTF?

      It depends on the broker MTF policies. Pocketful MTF interest rates start from 5.99%, which is lowest among all brokers.

    4. Can I hold MTF stocks for the long term?

      Stocks bought using MTF can be held for a significant amount of time but vary from broker to broker. Moreover, interest charges increase if you hold for more days.

    5. What happens if I don’t deposit additional margin?

      The broker can sell your shares and also charge a penalty.

  • Open Free Demat Account

    Join Pocketful Now

    You have successfully subscribed to the newsletter

    There was an error while trying to send your request. Please try again.

    Pocketful blog will use the information you provide on this form to be in touch with you and to provide updates and marketing.