Category: Trading

  • What is Automated Trading?

    What is Automated Trading?

    The world of trading is very dynamic; the stock price changes very frequently, and it is not possible for a trader to constantly stare at the chart or track the price. Automated trading offers a solution to this by allowing you to follow a rule-based trading strategy and can execute trades within milliseconds without human intervention.

    In today’s blog post, we will give you an overview of automated trading, its advantages, and its types.

    What is Automated Trading?

    Automated trading, also known as Algo or Algorithmic trading, is a method of trading in which a computer program executes trades based on a predefined set of instructions. The rules are based on various parameters, such as price movement, technical indicators, and volume. No manual interventions are required in it.

    Key Features of Automated Trading

    The key features of automated trading are as follows:

    • Speed Execution: In algorithmic trading, computers can execute trades in milliseconds with minimal delay. The prices changes very frequently and a small delay in execution can significantly impact the profit. And the computer reacts faster than humans it helps traders in executing trade immediately.
    • Manual Intervention: There is zero intervention by the trader, which reduces the fear of panic selling or greed, etc. This can help a investor because emotions such as fear, greed, panic, etc. can lead to make poorer decision and automated trading follows pre-defined rules and avoid emotional mistakes.
    • Backtesting: One can backtest the strategy by using historical data before executing any strategy in real-time. This can help an investor in understanding how their strategies can perform in different market situations. And if the strategies are not working properly they can modify it.
    • Analyse Large Data: The computers used in algorithmic trading can analyse a huge amount of data which is difficult for an individual to analyse. Automated trading setup can track multiple stocks performance, their corporate actions, and analyse them on technical indicators, etc.

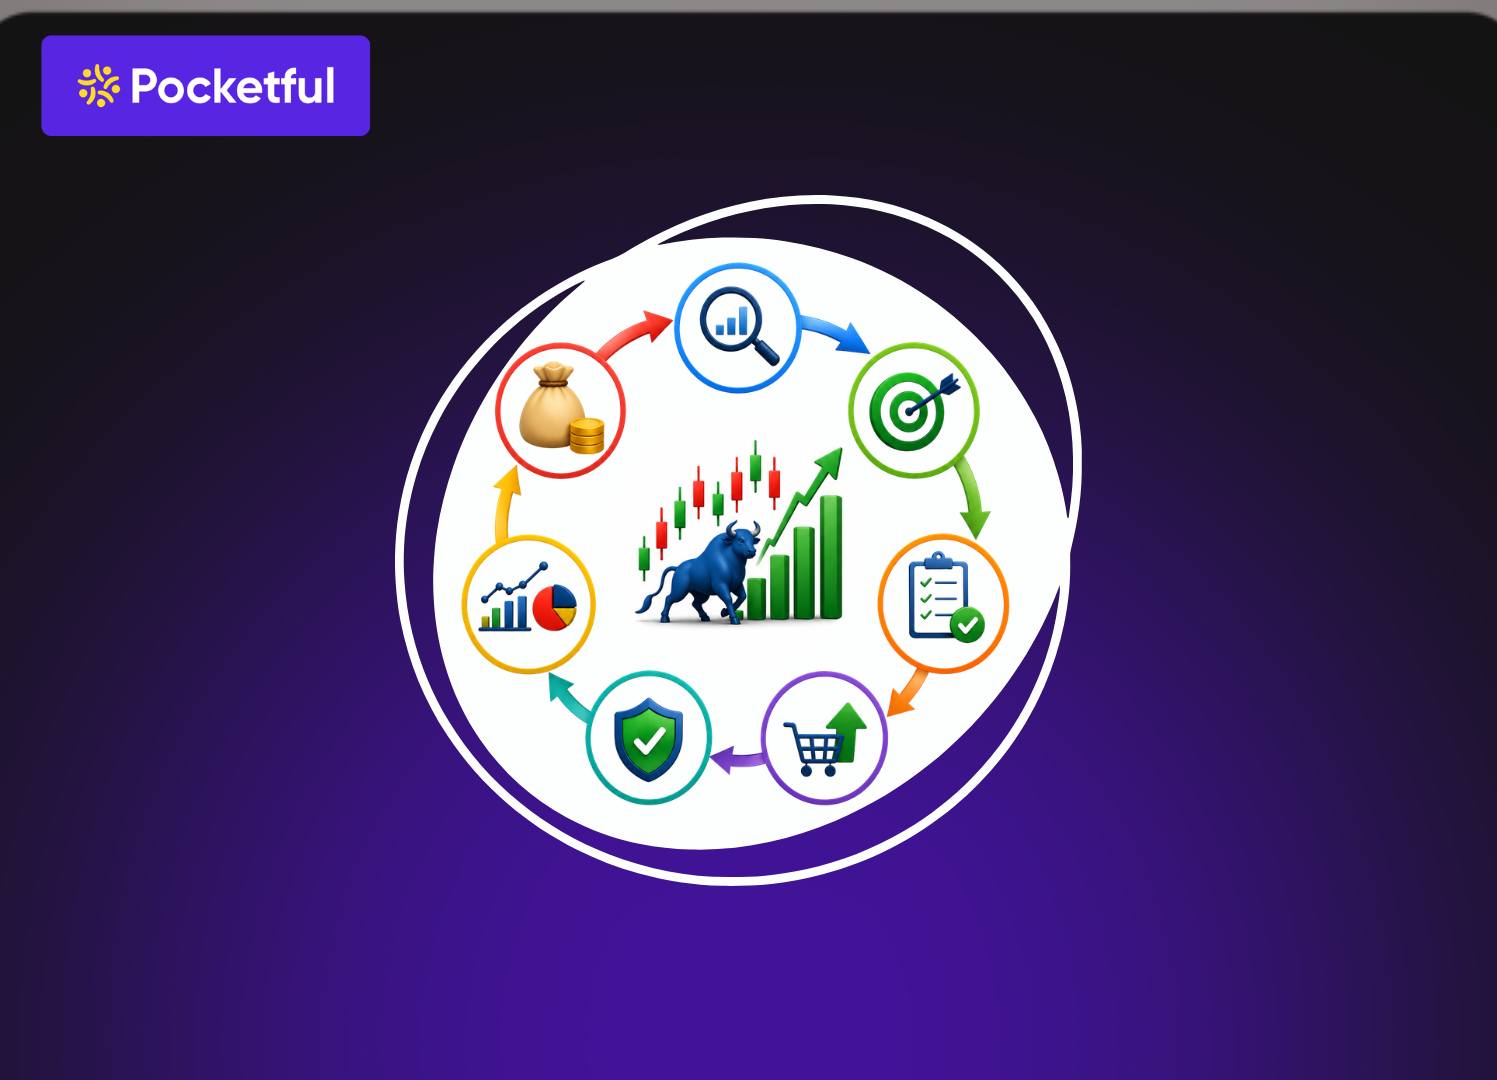
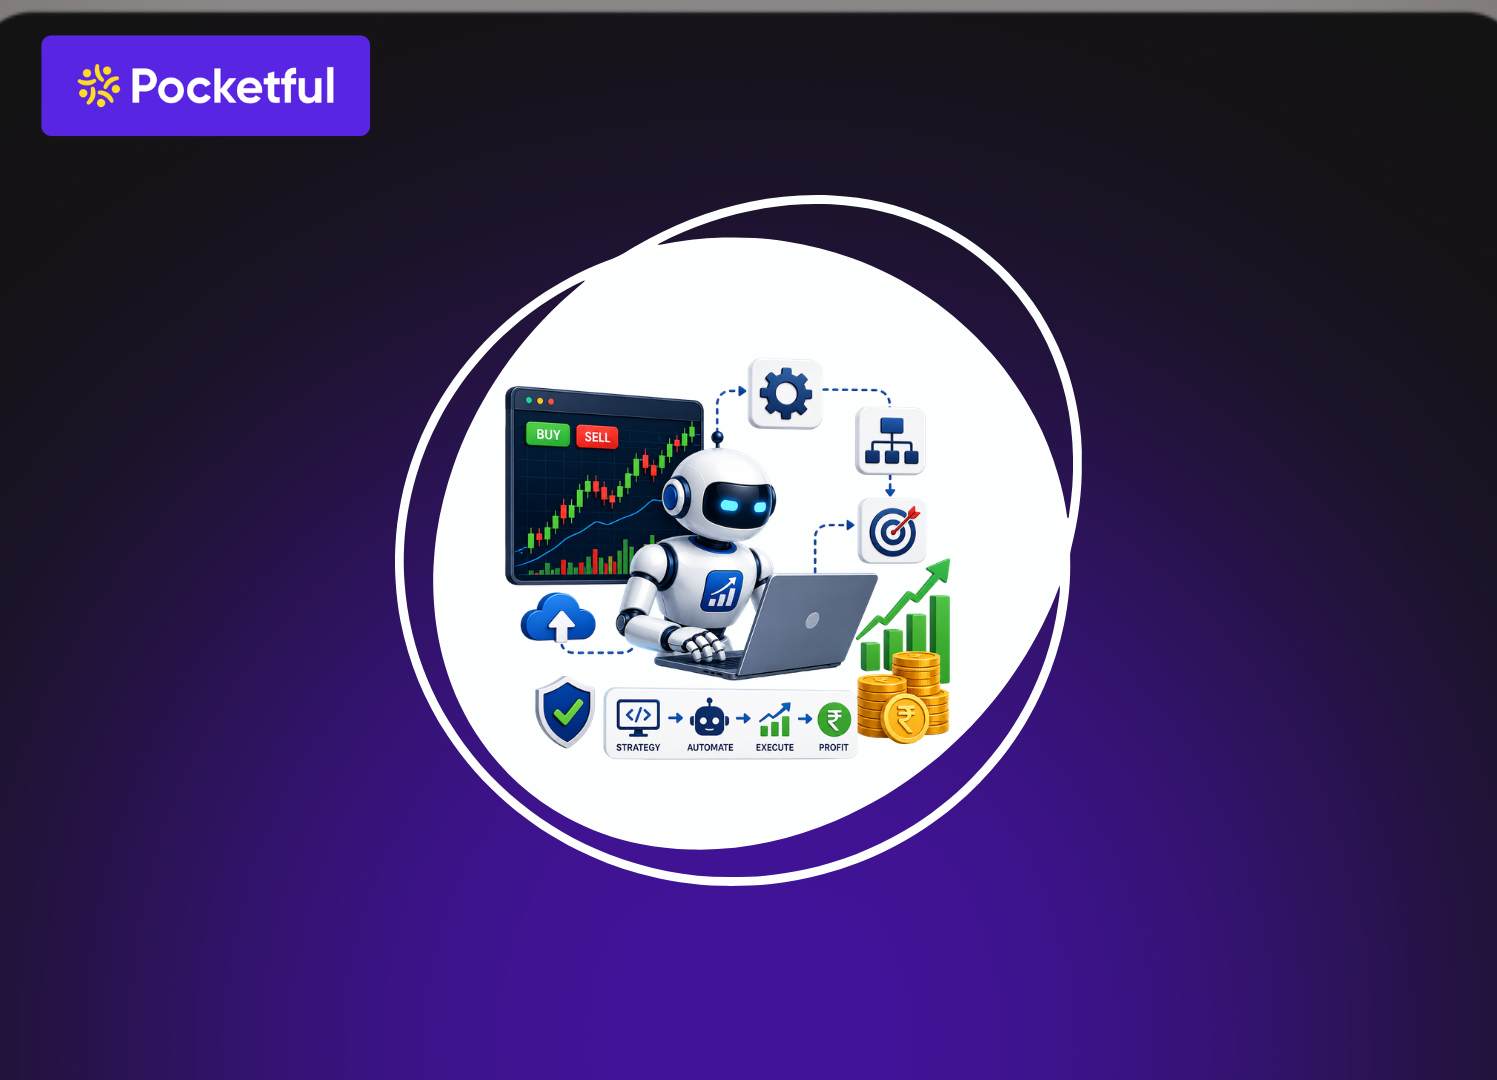
    How Does Automated Trading Work

    The automated trading works in the following manner:

    • Establishing Trading Strategy: The first step is to create rules based on which you want to trade. The trading strategies can be based on technical indicators, price movements, etc. A well-defined strategy is a key element in automated trading.
    • Converting Strategy into an Algorithm: Once your rules are defined, you need to turn them into a program that a computer can understand, which involves creating an algorithm. This step generally involves changing the strategies into coding language or on the trading platforms that support automation. The key objective of this step is to remove human error.
    • Linking with Broker Platform: The next step is to link the algorithm to your broker platform through an API. Through this, your setup can access the real-time market data. APIs act as a bridge between the automated trading software and stock brokers. Without the integration of the API, the strategies and algorithms would not be able to interact with the live market feeds.
    • Execution of Trade: When the conditions you define are met by the system, it will automatically execute the trades on your behalf without delay. This acts as a key advantage of automated trading, as it removes the chances of human error and emotional decision-making. It also acts faster than humans in executing trade.
    • Optimisation: You can regularly monitor the trades and strategy to optimise them and reduce losses. As the market is dynamic in nature, the strategies need to be changed accordingly. Optimisation helps keep the automated trading system aligned with the changing market conditions.

    Read Also: What is AI Trading?

    Types of Automated Trading Strategies

    There are several types of trading strategies; a few of these strategies are mentioned below:
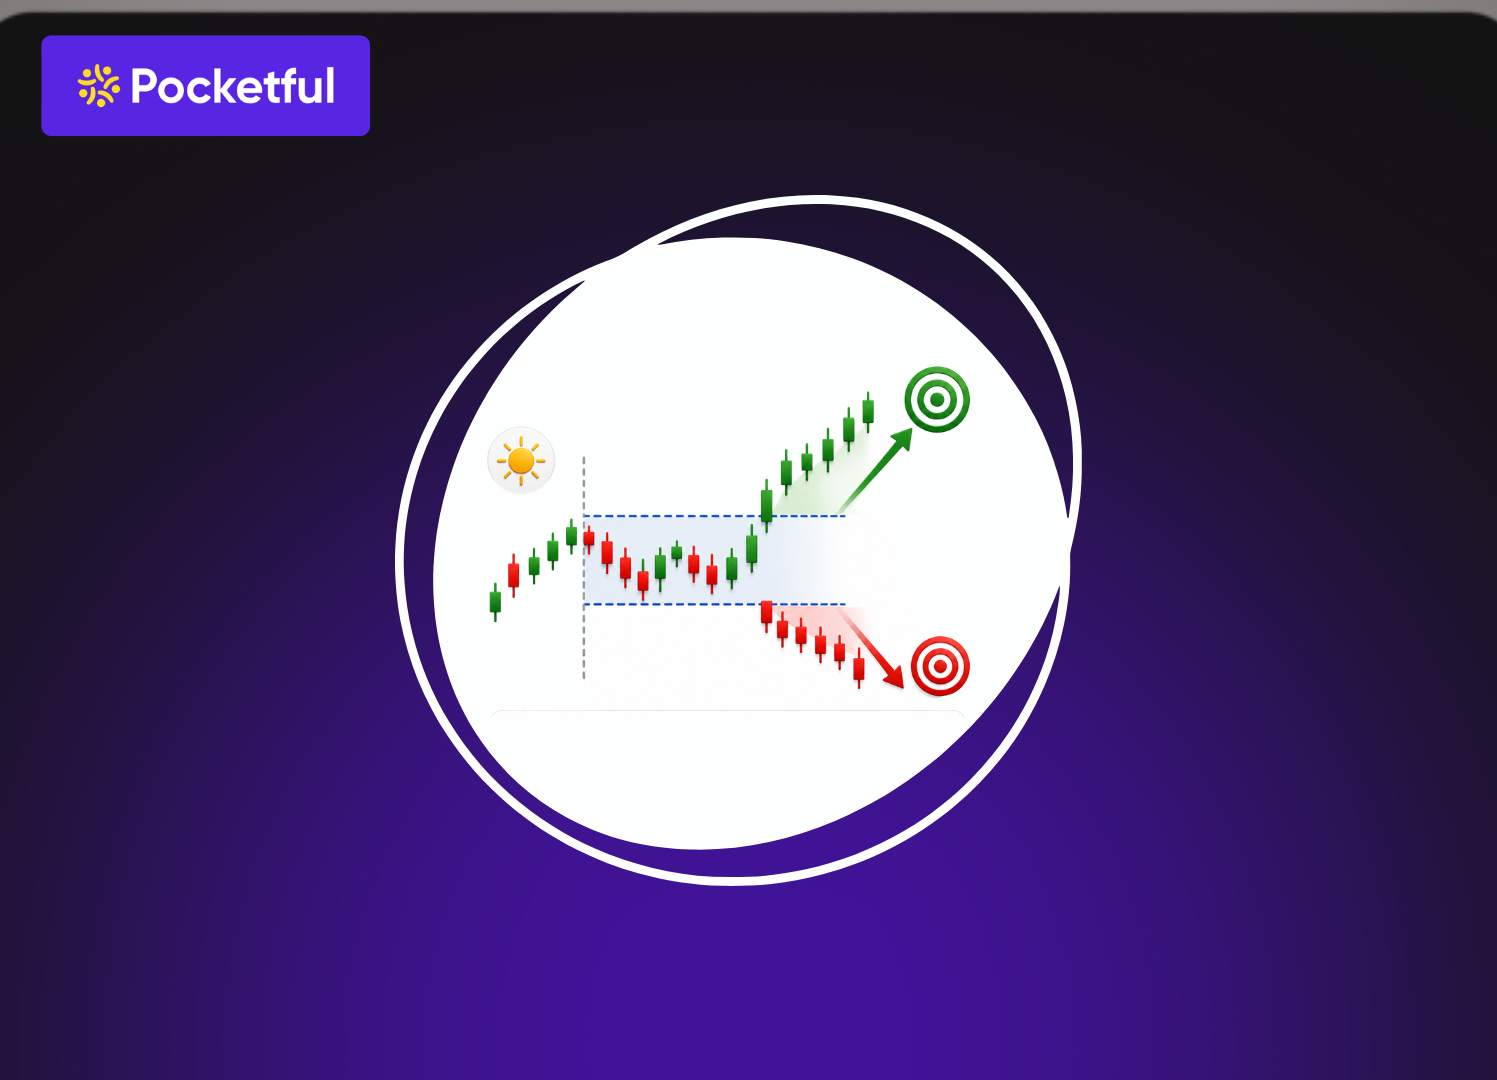
    1. Following Trend

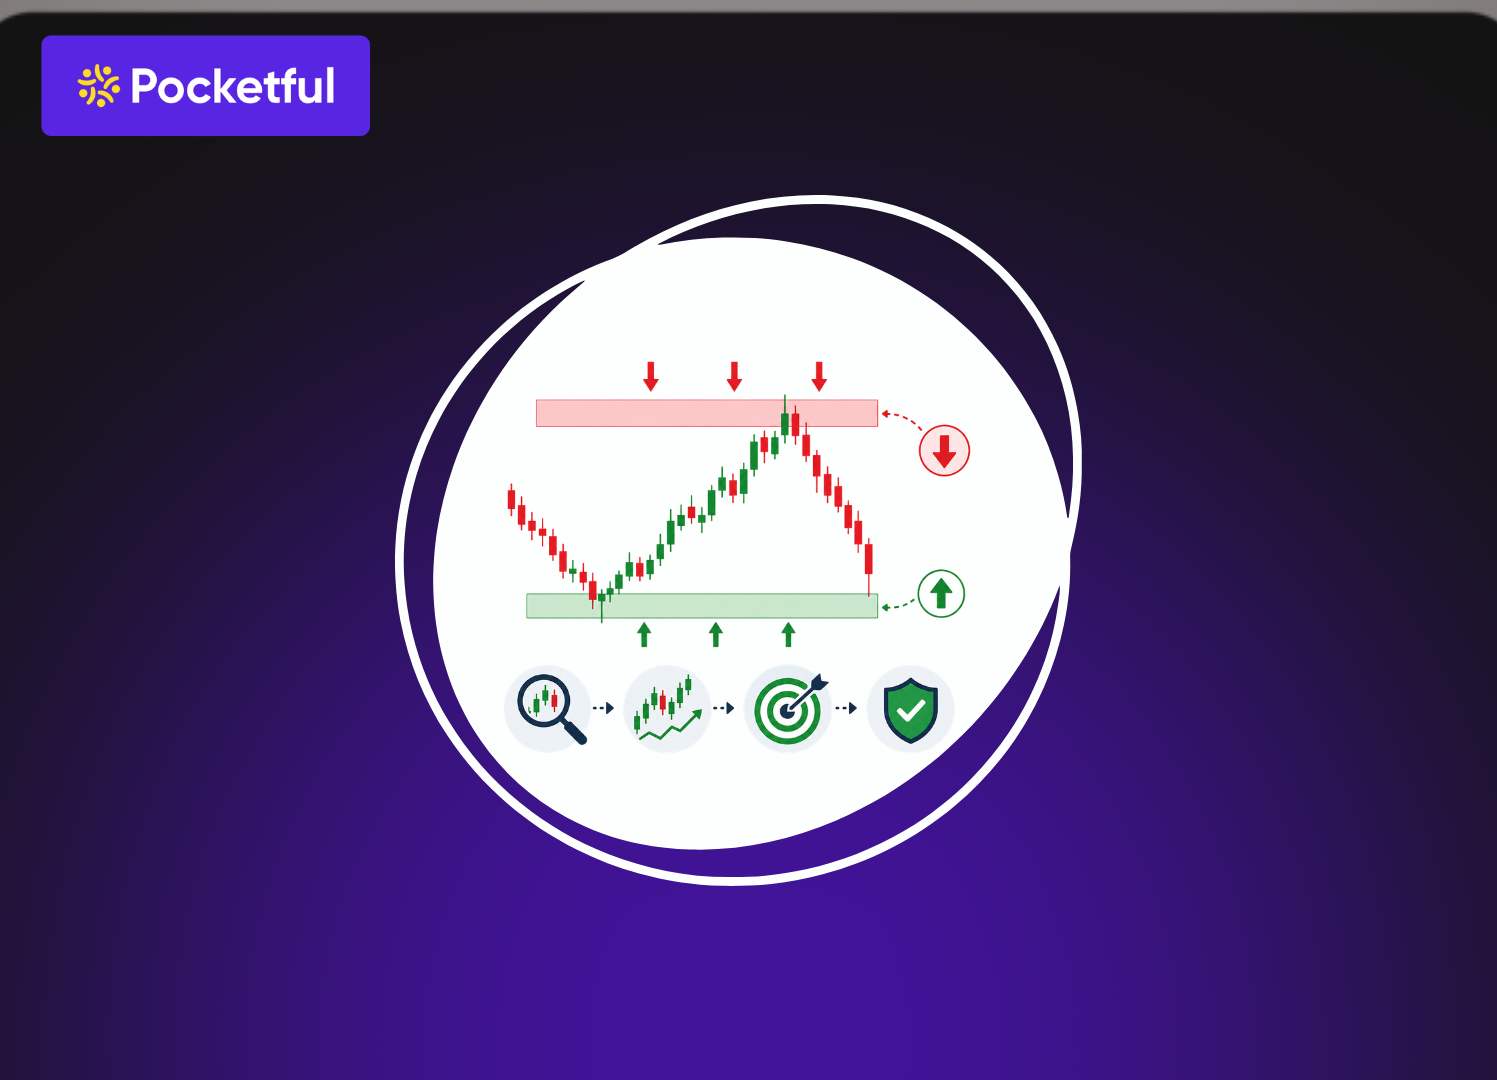
    There is a strategy in which the algorithm follows the market trend and continues to trade on it until it lasts. In this strategy, the algorithm finds the direction of the market trend and executes trades accordingly. If the market trend is positive, the algorithm tries to find out the buying opportunities and vice versa.

    Example: For example, the price of a stock crosses its 50-day moving average, hence it generates a buy signal, then the system will identify it as an opportunity and execute a buy order.

    2. Mean Strategy

    Under this strategy, one believes that the stock prices can be overvalued and undervalued, and with time it will eventually return to their average or mean value. According to this strategy, if a stock becomes overvalued and undervalued in the short run based on some events or news, the algorithm identifies it and expects that the prices will return to their mean, actual value or average.

    Example: Suppose the actual value of a stock is 1000 INR, and due to some negative sentiments in the market, the stock price corrects significantly and falls to 600 INR. It acts as an opportunity for the algorithm, and it will execute a trade on the assumption that the stock price will eventually reach 1000 INR to its actual value.

    3. Arbitrage Strategy

    This strategy focuses on taking advantage of the price differences of a particular security in different markets. As the prices are not always identical in every market, it is difficult for an individual investor to identify such an opportunity. Hence, the automated trading setup can identify such an opportunity and execute a trade immediately.

    Example: Let’s say a stock name ABC Limited is trading at INR 1000 in NSE and INR 990 in BSE. Hence, it creates an arbitrage opportunity for the algorithmic setup, and the system will execute a trade and purchase the share at INR 990 in BSE and immediately sold them on the NSE at INR 1000.

    4. Scalping Strategy

    In a scalping trading strategy, the algorithm focuses on making small profits from different trades. This strategy executes multiple trades during the day. This is a short-term trading strategy in which the system does not wait for large price movements and focuses on capturing the small changes in stock prices. This strategy is generally used by the algorithm traders, as humans cannot act as fast as computers can.

    Example: A stock name XYZ Limited priced at INR 1000  is moving within a range of 1% several times during the day. In this situation, the system purchased them at INR 1000 and sold them within the 1% price range several times during the day.

    Advantages of Automated Trading

    The key advantages of automated trading are as follows:

    • No Emotions: Emotions such as fear, greed, and panic, etc. can lead to losses. Automated trading systems can remove this completely, and one is required to trade only the pre-defined strategies.
    • Speed: Timing is crucial when trading in the financial market. The automated trading systems can react to market changes very quickly and execute trades in milliseconds.
    • Continuous Monitoring: Regular monitoring is required in trading, which is practically not possible for an individual. Hence, an automated trading system can track the market movement continuously.
    • Consistency: Every trade through the automated trading system follows the same defined rules and strategies and maintains long-term discipline. 

    Risk of Automated Trading

    The risks of automated trading systems are as follows:

    • Technical Issues: In case of any technical issue, such as internet connection, server downtime, power failure, software glitch, etc. can lead to misleading trades and unexpected losses.
    • Incorrect Strategy: The strategy defined for the automated trading can be wrong sometimes. Poor entry exit rules and unrealistic assumptions can lead to significant losses.
    • Complexity in Initial Setup: Setting up the automated trading can be a complex process, as it requires building correct strategies, understanding of platforms to implement the API, etc.
    • Unexpected Events: There are certain automated trading setup which are not designed for specific events such as economic crises, geopolitical tensions, policy changes, etc. Unable to analyse these events can lead to significant loss.

    Read Also: What is Algo Trading?

    Who should use Automated Trading?

    Generally, it is considered that automated trading is only for big institutions and tech experts, but an individual can also use it very conveniently without any hassle. It helps beginners in removing emotional bias from trading and saves time. Automated or algorithmic trading can analyse a large amount of data and execute trades faster and more efficiently. Traders who prefer a systematic approach to trading can consider automated trading and can benefit from it. One can easily use automated trading using the Pocketful web application, as it also offers free API integration of your trading strategies.

    Conclusion

    On a concluding note, automated or algorithmic trading is gaining popularity over time. Through automated trading, traders can execute well-defined strategies with more accuracy within time. It is not possible to track the market regularly, but using an automated trading system, the stress of regular monitoring can be reduced. However, one should remember that trades based only on automated systems do not always guarantee profits; there are various risks involved in them, such as system failure, low internet connectivity, etc. In the end, it is advisable to take help from an automated trading system, but do not solely depend on it and always consult your investment advisor before making any investment.

    S.NO.Check Out These Interesting Posts You Might Enjoy!
    1What is Commodity Market in India?
    2What is Intraday Trading?
    3What is Options Trading?
    4Breakout Trading: Definition, Pros, And Cons
    5Different Types of Trading in the Stock Market
    6What is Quantitative Trading?
    7What is Spread Trading?
    8What Is Colour Trading?
    9Arbitrage Trading in India – How Does it Work and Strategies
    10Silver Futures Trading – Meaning, Benefits and Risks

    Frequently Asked Questions (FAQs)

    1. Do I need to learn coding to start automated trading?

      No, you are not required to learn coding to start algorithmic or automated trading. There are various tools that offers rule based system to start automated trading.

    2. How can I define the rule for the trading system for the trading platform?

      You are simply required to integrate the API into the system of your broker with whom you have your trading and demat account.

    3. Do automated trading offers guaranteed returns?

      No, automated trading does not offer guaranteed returns. There are chances that the strategies defined under it can fail due to various reasons, such as technical glitches, etc.

    4. Is automated trading expensive?

      No, automated trading is not very expensive. However, there are certain platform which can charge based on the trading tools and data feeds involved in it.

    5. What does backtesting refer to in automated trading?

      Backtesting is a process in which one can test their strategies in real market conditions and past data to analyse how their strategies would have performed in the past.

  • Weekly vs Monthly Expiry in Options Trading: Key Differences

    Weekly vs Monthly Expiry in Options Trading: Key Differences

    In options trading, most people focus primarily on entry points and targets; however, selecting the right expiration date is equally crucial. In many trades, issues arise not because the market view was incorrect, but rather because the appropriate expiration date was not chosen. Price movements tend to be rapid during weekly expirations, whereas monthly expirations are generally considered to be somewhat more stable. Therefore, it is essential to understand the distinction between the two before initiating a trade.

    Understanding Weekly and Monthly Expiry in Options Trading 

    What is Weekly Expiry?

    Weekly expiry refers to option contracts that expire every week. Since there is a limited amount of time remaining until these contracts expire, their premiums tend to exhibit very rapid price movements. This is precisely why many intraday and short-term traders prefer to trade in weekly expiry contracts. Currently, in the Indian stock market, regular weekly option contracts are available only for the Nifty 50 on the NSE and the Sensex on the BSE. Due to the short time horizon, both the potential risks and rewards associated with these contracts fluctuate rapidly.

    If a trader anticipates significant market volatility over the next few days, they may choose to trade in weekly expiry contracts, as even minor market movements can trigger substantial changes in the option premiums.

    What is Monthly Expiry?

    Monthly expiry refers to option contracts that expire once a month. Since these contracts have a longer time horizon, the movement of their premiums tends to be relatively calmer and more stable compared to weekly expiry contracts. For this reason, many swing and positional traders consider monthly expiry contracts to be a more favorable choice. In the Indian market, the majority of stock options as well as several index options are primarily traded with monthly expiry cycles. The longer time frame provides traders with a better opportunity to hold their positions and wait for the market to move in their anticipated direction.

    For example , if a trader believes that the market is likely to trend gradually upward over the coming 2-3 weeks, monthly expiry contracts may prove more suitable for them, as the pressure of “time decay” on the trade is relatively lower in such contracts.

    How Expiry Structure Works in the Indian Market 

    In options trading, every contract has a fixed expiration date. Traders can buy or sell the contract up until that date. As the expiration date approaches, the value of the contract begins to change rapidly because the time remaining until expiration diminishes.

    Expiry Structure 

    Step What happens?
    1The exchange sets the expiry date for an index or a stock.
    2Traders buy or sell option contracts with that specific expiration.
    3As the expiration date approaches, premiums change rapidly.
    4The final settlement of the contract takes place on the day of expiry.
    5If the trader does not close the position earlier, the contract is settled automatically.

    What is the current system for expiries in the Indian market?

    Exchange Weekly OptionMonthly Option
    NSE Nifty 50Mostly Index and Stock Options
    BSE SensexRemaining Available Contracts

    Weekly Expiry vs Monthly Expiry

    PointsWeekly ExpiryMonthly Expiry
    Expiry DurationThis type of option contract expires every week.These contracts expire once a month.
    Premium MovementDue to the limited time remaining, significant fluctuations are observed in the premium.The movement of the premium remains comparatively somewhat stable.
    Time Decay (Theta)As the expiration date approaches, the premium declines rapidly, especially during the last 1-2 days.Time decay occurs gradually when there is a significant amount of time remaining in the contract.
    Risk LevelThe risk remains quite high due to rapid movements.The risk is considered relatively low because the trade has time.
    Trading StyleIt is primarily used for Intraday, Scalping, and Short-Term Trading.It is considered more useful for Swing Trading and Positional Trading.
    Capital RequirementDue to the low premium, starting with a small amount of capital seems feasible.The premium may be slightly expensive; therefore, more capital might be required.
    Suitable ForIt is considered better suited for experienced traders who make quick decisions.It is considered more suitable for new and risk-averse traders.
    Volatility ImpactThe impact of market news and major events is visible immediately.Volatility has an impact, but the movement remains somewhat controlled.
    Holding PeriodA trade is typically taken for a few hours or a few days.A trade can be held for several days or weeks.

    Advantages and Disadvantages of Weekly Expiry Trading 

    In weekly options expiries, rapid premium movements are observed within a short timeframe. This is why many active traders prefer them; however, the associated risks are also significantly higher.

    Advantages of Weekly Expiry Trading

    • Fast Profit Opportunities : Premiums can rise rapidly even on minor market movements, creating the potential for generating good returns within a short timeframe.
    • Ideal for Short-Term Trading : This specific expiry cycle is predominantly utilized for short-term strategies such as Intraday trading, Scalping, and Momentum trading.
    • Increased Opportunities in Event Trading : Weekly options often exhibit sharp price movements during major events such as the Union Budget, RBI Policy announcements, or significant global events.
    • Possible to Start with Low Capital : The premiums for weekly options are typically lower; consequently, traders with limited capital can also initiate trading activities.

    Disadvantages of Weekly Expiry Trading 

    • Risk of Rapid Time Decay : As the expiry date approaches, premiums erode rapidly; this can exacerbate losses if trading decisions are timed incorrectly.
    • High Emotional Pressure : Due to rapid market fluctuations, the risk of making hasty and erroneous decisions under pressure increases significantly.
    • Challenging for Beginners : Effective risk management and strict discipline are paramount in weekly expiry trading requirements that can prove challenging for novice traders.
    • Risk of False Breakouts : Owing to short-term volatility, the market frequently undergoes sudden directional shifts, leading to a higher occurrence of “fake moves” or false breakouts.

    Read Also: F&O Monthly Expiry May 2026: Date, Impact & Strategy Guide

    Advantages and Disadvantages of Monthly Expiry Trading

    During monthly expirations, premium movement remains comparatively more stable; therefore, many traders prefer it for lower risk and better trade management.

    Advantages of Monthly Expiry Trading

    • Trades Have More Time to Develop : In monthly expiries, traders have ample time to wait for market movements to unfold, thereby reducing the need for hasty decisions.
    • Reduced Pressure from Time Decay : The premium on these contracts erodes gradually; consequently, option buyers may enjoy a slightly better advantage.
    • Ideal for Swing and Positional Trading : Monthly expiries are particularly beneficial for traders who prefer to hold their positions for several days or weeks.
    • Lower Market Noise : Compared to weekly expiries, these contracts tend to exhibit fewer sudden, sharp fluctuations and “fake moves.”

    Disadvantages of Monthly Expiry Trading

    • Premiums Can Be Relatively Expensive : Due to the longer time remaining until expiration, the premiums for monthly options are often higher.
    • Less Potential for Rapid Profits : Compared to weekly expiries, the movement of premiums in these contracts tends to be somewhat slower.
    • May Require Higher Capital : Entering certain trades may necessitate a larger amount of capital.
    • Patience is Essential : In monthly trades, it often takes time for market movements to materialize; therefore, this approach may not be suitable for traders who are prone to impatience.

    Which Expiry Is Better for Option Buyers? 

    For option buyers, selecting the right expiry date is crucial, as the impact of “Time Decay” is most pronounced in buying strategies. If a trader anticipates a rapid market movement over a very short timeframe, a Weekly Expiry can be utilized. Conversely, if a trade requires a longer duration to play out, a Monthly Expiry is generally considered the superior choice.

    When is a Weekly Expiry preferable?

    • For Short-Term Momentum Trades : If a trader believes the market is poised to make a sharp move within the next 1–2 days, a Weekly Expiry can prove highly useful.
    • For Event-Based Trading : During major events such as the Union Budget, RBI Policy announcements, or significant global occurrences many buyers opt for Weekly Options, as the associated premiums have the potential to appreciate rapidly.

    When is a Monthly Expiry considered preferable?

    • For Swing and Positional Trading : If a trader intends to hold a position for a period ranging from a few days to several weeks, a Monthly Expiry is the more suitable choice.
    • To Mitigate the Pressure of Time Decay : With Monthly Options, the rate of premium decay is relatively slower, thereby providing the trade with ample time to develop.
    • For Beginners : For many novice traders, understanding and managing Monthly Expiries is considered somewhat easier, as the reduced time pressure minimizes the need for hasty decision-making.

    Which Expiry Is Better for Option Sellers? 

    In Option Selling, the selection of the Expiry date is crucial because sellers derive the greatest benefit from Time Decay. Consequently, many sellers choose either Weekly or Monthly Expiries based on their specific strategy, risk appetite, and intended holding period.

    When is Weekly Expiry considered preferable?

    • Benefits from Rapid Time Decay : In weekly options, the premium erodes quickly, allowing sellers to realize profits within a shorter timeframe.
    • Useful for Regular Income Strategies : Many experienced traders utilize weekly expiries for short-term premium selling purposes.
    • Offers More Opportunities During High Volatility : During periods of rapid market movement, rising premiums create increased opportunities for selling options.

    When is Monthly Expiry considered preferable?

    • Provides More Time for Position Adjustment : If the market suddenly reverses direction, sellers have a better opportunity to manage and adjust their trades.
    • Risk Remains Comparatively More Controlled : Compared to weekly expiries, the impact of sudden, large “Gamma Moves” tends to be somewhat mitigated.
    • Better Suited for Hedging Strategies : Many positional sellers and hedged traders prefer monthly expiries because they allow the trade sufficient time to play out.

    Read Also: What is Futures and Options Trading in India: Beginner’s Guide

    Conclusion 

    Both weekly and monthly expirations possess their own distinct characteristics and risks. The right choice always depends on your trading style, risk capacity, and holding period. If you prefer rapid price movements and short-term trading, weekly expirations can be beneficial. Conversely, for stable and lower-stress trading, many traders consider monthly expirations to be the superior option.

    S.NO.Check Out These Interesting Posts You Might Enjoy!
    1Mutual Fund vs ETF. Are They Same Or Different?
    2Commodity vs Equity Trading in India: Key Differences
    3ETF vs Stock – Which One is the Better Investment Option?
    4Gold ETF vs Gold Mutual Fund: Differences and Similarities
    5Liquid Fund vs Debt Fund: Key Differences
    6Cash Market vs F&O: Key Differences
    7Overnight Funds vs Liquid Funds: Which Is Better?
    8Difference between Online Trading and Offline Trading
    9ETF vs FOF: Key Differences
    10Straddle vs Strangle: Key Differences

    Frequently Asked Questions (FAQs)

    1. Which expiry is better for beginners?

      Monthly expiry is considered more suitable for beginning traders because it has less time decay pressure.

    2. Is weekly expiry more risky?

      Yes, premiums change faster in weekly expiry, so the risk is higher.

    3. Why do traders prefer weekly expiry?

      Many traders prefer weekly expiry because of faster movements and shorter profit opportunities.

    4. Is monthly expiry good for option buying?

      If the trade requires more time to play out, monthly expiry may be better for option buyers.

    5. Does time decay affect weekly options more?

      Yes, time decay works much faster in weekly options, especially near expiry.

  • Opening Range Breakout (ORB) Strategy

    Opening Range Breakout (ORB) Strategy

    To capture the early momentum, many people rely on the orb strategy. But if you are new to the market, you might be wondering, what is orb in trading? It stands for Opening Range Breakout. It is a simple but powerful method used to find early market trends.

    When you use an orb in trading, you are basically waiting for the market to settle down a bit. You let the initial chaos pass and look for a clear direction. That is the core of the open range breakout strategy. By marking the highest and lowest points of the morning session, you can spot where the stock wants to go next.

    In this blog, we will simplify the orb trading strategy for you. This guide will help you understand the concept clearly.

    Meaning of Opening Range Breakout (ORB) Strategy

    As the word describes itself, an open range breakout strategy is doing its job when buyers and sellers fight to control the stock price. At 9:15 AM in India when the market opens, this demand and supply creates a high price and a low price during a specific time, like the first 15 minutes.

    The space between this high and low price is called the opening range. The strategy comes into play when the stock price breaks out of this range. If the price shoots the high limit, it is a breakout. If it goes below the low limit, it is a breakdown.

    How to Identify the Opening Range Breakout Setup?

    To identify the setup, you first need to pick a time frame, like the first 15 minutes of the day. You then mark the highest price and the lowest price of that period on your chart. These two lines become your support and resistance levels.

    A true breakout happens when a full candle closes outside these lines. A small spike that crosses the line and comes back quickly is not a real breakout. Let us look at the two main types of setups you will encounter in the market.

    For Bullish Opening Range Breakout Setup

    A bullish setup tells us that buyers are in full control. You use this setup when you expect the stock price to go up. Here is how you can spot it and trade it.

    • Mark the Range: Note the highest high and lowest low of the first 15 minutes.
    • Wait for the Breakout: Watch the stock price closely. Wait for a 5-minute candle to close completely above the high line.
    • Check the Volume: Breakouts work best when there is high trading volume. Make sure the breakout candle has higher volume than the previous candles.
    • Enter the Trade: Once the candle closes above the line with good volume, you can buy the stock.
    • Set Stop Loss: Place your stop loss just below the opening range low or at the midpoint of the range. This protects your money if the stock suddenly falls.
    • Target: risk to reward ratio of 1:2 is a good approach in this strategy. If you are risking Rs 50 your target should be Rs 100.

    For Bearish Opening Range Breakout Setup

    A bearish setup tells us that sellers are taking over. You use this setup when the market is falling and you want to make money by short selling. Here is how you identify it.

    • Find the Range: Just like the bullish setup, mark the high and low of the first 15 minutes.
    • Watch for Breakdown: Wait for a 5-minute candle to close completely below the low line.
    • Confirm with Volume: A good bearish breakout needs high selling volume. This shows that big investors are also selling.
    • Take a Short Position: Once the candle closes below the low line, you can enter a short sell trade.
    • Place Stop Loss: Put your stop loss just above the opening range high. This keeps you safe if the market reverses direction.
    • Set Target: Again, aim for a clear target using a 1:2 risk to reward ratio.

    Read Also: Best Option Selling Strategy in India

    Best time frame for Opening Range Breakout Setup

    Different traders prefer different time frames based on their trading style. Some like fast action, while others prefer safe and steady trades. Here is a quick comparison of the most common time frames used in the market.

    Time FrameBest Suited ForAdvantagesDisadvantages
    5 MinutesScalpers and quick tradersGives very fast entry signals. Allows for smaller stop losses.Has the highest risk of false breakouts. The market is very noisy at this time.
    15 MinutesStandard intraday tradersThe perfect sweet spot. Balances speed and accuracy very well.You have to sit patiently for 15 minutes before taking any trade.
    30 MinutesSwing and safe day tradersProvides highly reliable signals. Filters out morning volatility.You might miss the first big wave of profits. Stop losses can be wider.
    60 MinutesLong term position tradersAligns with major global market trends.Too slow for active intraday trading. Usually misses short term spikes.

    If you are just starting your trading journey, focus on the 15 minute or 30minute opening range. These time frames are less stressful and offer better win rates.

    Role of opening range breakout indicator

    Drawing lines manually on a stock chart every morning can be tiring. If you are watching ten different stocks, it becomes impossible to track all of them at once. This is where an opening range breakout indicator becomes your best friend.

    An ORB indicator is a software tool that automatically draws the high and low lines for you. The moment the first 15 minutes are over, the indicator plots the lines on your screen. You do not have to do any math or manual tracking.

    These indicators also filter out bad trades. For example, a good indicator will look at the Volume Weighted Average Price (VWAP). It will only give you a buy signal if the stock price is above the VWAP line. This adds a layer of safety to your trades.

    Advantage of Opening Range Breakout

    There are many reasons why professional traders love this strategy, some of them are mentioned below.

    • Capture the trend: The biggest advantage is that it helps you capture early market trends. The first hour of trading often decides the direction of the entire day.
    • Trading the breakout: you join the trend right at the beginning. This gives you a chance to make bigger profits compared to trading later in the afternoon. It is a proactive approach rather than a reactive one.
    • High liquidity. During the morning hours, there are millions of buyers and sellers active in the market. This means you can buy and sell large quantities of shares instantly without facing any major price jumps.
    • Clear exit points. You always know exactly where to place your stop loss. If the trade goes wrong, you cut your losses quickly at the range boundary. This clear rule prevents emotional mistakes and protects your trading capital.

    Read Also: Options Trading Strategies

    Disadvantage of opening range breakout

    While the strategy is great, but here are some major challenges you can face

    • False breakouts. Sometimes, the price breaks the morning high, tricking everyone into buying. Suddenly, big players sell their shares, and the price drops like a rock. 
    • Not reliable in the range bound market. On days when there is no major news, the market just moves sideways. The price will cross the high and low lines multiple times without forming a real trend.
    • Fast decision making: The market moves very quickly in the first 30 minutes. If you are slow to enter or exit, you might miss the profit window or lose more money than planned. You have to stay highly focused and disciplined.

    Conclusion

    The Opening Range Breakout strategy is a fantastic tool to have in your trading arsenal. It offers a logical and rule based way to trade the morning market momentum. 

    Always keep in mind no strategy has 100 percent winning chances. Main focus area in ORB is strong risk management and patience. Always use stop losses, wait for volume confirmation, and do not get frustrated by a few false breakouts.

    Platforms like Pocketful made trading very easy for beginners as well as experts with help of their tools. keep your rules simple, and you will slowly see consistency in your trading journey.

    S.NO.Check Out These Interesting Posts You Might Enjoy!
    1Bullish Options Trading Strategies Explained for Beginners
    2What is Short-Term Trading Vs Long-Term Trading Strategies?
    3Nifty Weekly Options Strategy for Beginners
    4MTF Strategy for Beginners in India
    5Collar Options Strategy – Meaning, Example & Benefits
    6Supply and Demand Trading Strategy
    7Bank NIFTY Intraday Options Trading: Steps, Strategies & Tips
    8Silver Intraday Trading Strategy
    9Call and Put Options: Meaning, Types, Difference & Examples
    10Crude Oil Trading Strategy: Best Time, Tips & Indicators

    Frequently Asked Questions (FAQs)

    1. What does ORB stand for?

      ORB means Opening Range Breakout, it is an intraday trading strategy. It involves marking the highest and lowest prices of a stock during the first few minutes of the market open.

    2. What are the main benefits of using the ORB strategy?

      The biggest benefit is that it helps you identify the market trend very early in the day. It also provides clear entry and exit points.

    3. How to use the ORB strategy effectively?

      Mark the high and low on your chart. When a 5-minute candle closes outside this range with high volume, you enter the trade. Always place a stop loss at the opposite end or the middle of the range to protect your money.

    4. Can a beginner trade in ORB strategy?

      For beginners, the 15-minute or 30-minute time frames are the best. These time frames filter out the extreme volatility of the first few minutes. 

    5. Can I use ORB strategy for Long term holdings?

      No, the ORB strategy is not built for the long term holding of the shares.

  • Understanding the Equity Trade Life Cycle

    Understanding the Equity Trade Life Cycle

    Have you ever wondered what exactly happens when you click to purchase a stock? The process or cycle after this is called the equity trade life cycle. It is the full process from the moment you decide to trade until you get your shares. This is basically what is trade life cycle. While buying takes a second, the trade life cycle of equity involves many steps to keep your money safe. 

    In this blog, we will explore the trade life cycle process and the trade life cycle and its participants to help you trade with confidence.

    Overview of the Equity Trade Life Cycle

    An equity trade is the process of buying or selling shares (ownership) in a publicly-listed company. It all starts when an investor decides they want to own a part of the company or cash out their current holdings in the company.

    But it’s more than just clicking a “buy” button. Behind that single click is a coordinated effort involving brokers, stock exchanges, and clearing houses. They work together to ensure that the money goes to the right seller and the shares end up in the right buyer’s account. It’s a journey of trust and technology – transforming a simple investment decision into a legal reality in a matter of seconds.

    The Three Operational Pillars: Front, Middle, and Back Office

    A stock broker is divided into three parts. 

    1. The Front Office

    The front office handles order capture, meaning they record exactly what you want to buy and at what price. In today’s world this is easily done by high speed mobile applications. Even though it looks simple, the software is constantly talking to the stock exchange to show you live prices. Their main job is to help you place your orders and give you market news.

    2. The Middle Office

    Once you place an order, the middle office systems check if you have enough money. Here it is ensured that the traders are following the rules set by the government. If the trade seems to be risky or rules are not followed then the trade is stopped. Here the entire system is made stable and big mistakes are prevented. Their primary goal is risk management and making sure all rules are followed.

    3. The Back Office

    In the back office digital paperwork is handled. Here record of different firms are made officially. The back office even deals with external groups like the clearing corporation and the depositories. If a company pays a dividend, the back office ensures your account is updated. Without them, your trades would never be finalized. They are responsible for making sure the shares actually reach your account.

    Read Also: What are T2T (Trade to trade) stocks?

    Phase I: Pre-Trade and Execution

    The first phase of the trade life cycle is all about making the deal. 

    Decision and Order Placement

    Here before entering a trade you have to choose an order type. A market order means you want to buy right now at whatever price is available. 

    A limit order means you only want to trade if the price hits a certain level. For example, if a stock is at Rs.505 but you only want it at Rs.500, you place a limit order. Your order will wait until the price drops to your level. This gives you more control over your money.

    Order Routing and Trade Execution

    Once the order are approved by the broker, it is sent to the stock exchange like NSE or the BSE for India. The exchange uses giant computer systems known as matching engines. In this buyer and the seller are paired based on price. If you want to purchase at Rs.500 and some seller wants to exactly sell it at the same price, the match is fixed. This is known as execution and here the deal is officially locked. 

    Phase II: The Clearing Process (The Middleman)

    After the trade is executed, the focus shifts to clearing. Clearing is the step where details are finalized before any money moves. 

    Trade Matching and Confirmation

    The first step is to make sure all details like quantity, price, and the stock name are matching perfectly. Once confirmed, the clearing corporation steps in and guarantees the trade. 

    The Role of the Clearinghouse

    The clearinghouse is the most important safety feature of the market. It becomes the central counterparty. This means it becomes the buyer to every seller and the seller to every buyer. This removes what we call “counterparty risk.”

    The Magic of Netting

    The clearing corporation also performs a task called netting. This is a way to simplify all the trades happening in the market. Instead of moving shares for every single trade, they calculate the “net” amount. 

    Netting Step Reaction Final Result
    Step 1You buy 500 sharesYou owe cash for 500 shares
    Step 2You sell 300 shares You are owned cash for 300 shares
    Step 3Netting Process You only pay for 200 shares

    Phase III: The Settlement Phase 

    This is the final step of the trade cycle as after this the ownership of shares is actually transferred. 

    What is Settlement?

    Settlement is the official completion of the trade, this is done by a system called Delivery versus Payment. Here the transfer of shares and money take place at the same time. The buyer pays when the shares are being delivered.

    The Timeline: T+1 Settlement

    In the past, India followed a T+2 settlement cycle. This meant if you bought a stock on Monday, the shares would arrive on Wednesday. However, our market has become very advanced. But from January 2023 India has moved to a T+1 settlement cycle in this the settlement happens just one business day after the trade. 

    Role of Depositories

    Depositories are identical to banks where yous store your shares. In India, we have two main depositories – NSDL and CDSL. They hold your shares in an electronic format called “demat.” When a trade is settled, the depository moves the shares from the seller’s account to the buyer’s account. This happens through a simple digital entry. No physical paper certificates are moved anymore. 

    Read Also: What is T+0 Settlement : Overview And Benefits

    Post-Trade Maintenance

    The trade life cycle does not end the moment the shares arrive. There is a final stage called post-trade maintenance. This stage ensures that everything stays accurate over time. 

    Verifying Trade Details

    After settlement, the back office of the broker performs a final check. They compare their own records with the reports from the exchange. They make sure the price you paid is exactly what was agreed. If there is a mistake, like a wrong fee, they will fix it immediately. 

    Updating Books and Records

    Brokers are required by law to keep detailed records. These are called the books of the firm. The back office updates these records every night. These records are used to calculate your taxes and generate your reports. When you see your “Holdings” in your app, you are looking at these updated records. 

    Handling Corporate Actions

    This is a very important part of owning stocks. Corporate actions are things a company does that affect you, like paying dividends or giving bonus shares. The depositories keep track of who owns the shares on a specific date. If a company pays a dividend, the system ensures the money is sent to your bank account automatically. 

    Why Understanding This Cycle Matters for Investors

    Managing Expectations

    Knowing the T+1 cycle helps you plan your money. If you sell shares on a Friday, you won’t get the money until Monday because the weekend is a holiday. Knowing this prevents you from getting frustrated when the money isn’t there on Saturday morning. 

    Error Detection

    When you know how the system works, you can spot if something is wrong. For example, if you sell shares and don’t see the money by the next evening, you can check with your broker. Sometimes a “short delivery” happens. This is when the seller doesn’t have the shares they sold. Knowing about this helps you stay calm while the exchange fixes the issue. 

    Confidence in the System

    The trade life cycle is designed to make the market a safe place. By using clearinghouses and electronic depositories, the system is very strong. When you know that many organizations are checking your trades, you can sleep better at night. 

    Conclusion

    The equity trade life cycle is a long journey for every trade. From your first click to the final share credit, many people work to keep the process smooth. India’s shift to T+1 settlement is a huge step forward for retail investors like you. It means faster access to your money and less risk.

    By understanding this cycle, you become a smarter investor. You can manage your cash better and trade with peace of mind. The next time you buy a stock, you will know exactly what is happening behind the scenes to make it successful.

    For more market news and insights, download Pocketful – offering users zero brokerage on delivery trades and an easy to use platform designed for both beginners and experienced investors.

    S.NO.Check Out These Interesting Posts You Might Enjoy!
    1What Is Common Stocks?
    2What is Auction Market?
    3What is MIS in Share Market?
    4What is Right Issue of Shares: Meaning, Examples, Features
    5What is Earnings Per Share (EPS)?
    6Top 20 Basic Stock Market Terminology for Beginners
    7What is Margin Money?
    8What is Pledging of Shares?
    9What is Intraday Margin Trading?
    10What is Operating Profit Margin?

    Frequently Asked Questions (FAQs)

    1. What does “T+1 settlement” means? 

      T+1 settlement means your trade is finished one business day after you make it. “T” is the day you buy. “+1” is the next working day when shares or money move. 

    2. What happens if I buy a stock but the seller fails to deliver it? 

      This is called a “short delivery.” The stock exchange will protect you by holding an auction. They will try to buy the shares from someone else to give them to you. 

    3. Why both trading account and a demat account important? 

      A trading account is used to place your orders. A demat account is like a digital locker where your shares are stored safely. You need both to complete the trade life cycle process. 

    4. Role and importance of NSDL and CDSL? 

      NSDL and CDSL are the two main depositories in India. They hold your shares in electronic form. They are important because they keep your ownership records safe and handle things like dividends for you. 

    5. Are dividends paid instantly after I buy a stock?

      No, dividends are not instant. You must own the shares on a specific “record date.” The company checks the depository records after the settlement cycle is complete to see who should get the money.

  • Bull Call Spread vs Bear Put Spread: Key Differences

    Bull Call Spread vs Bear Put Spread: Key Differences

    Trading in the indian stock market can be a thrilling experience. This is where multi-leg options strategies come into the picture. Instead of buying just one option, we combine buying and selling to protect our capital. Spreads are popular because they help you manage your risk right from the start.

    If you are exploring options trading, you will quickly come across two very famous strategies. We are talking about the bull call spread and the bear put spread. If you are looking to deploy a bull call spread india strategy, you are taking a smart step toward safer trading.

    Let us dive deep into how they work and understand which one you should pick based on market conditions.

    Meaning of Bull call spread and Bear put spread with example

    A Bull Call Spread is an options strategy used when you have a moderately bullish view of the market. You expect the stock or index to go up but you do not expect a drastic jump. To build this spread, you buy a call option at a lower strike price and sell a call option at a higher strike price. Both options must have the same expiry date.

    Selling the higher strike call gives you a premium.which helps you to reduce the total cost of buying. Your loss is strictly limited to the net premium you pay upfront.

    Let us look at a simple example using the Nifty 50 index to make things crystal clear. Assume Nifty is currently trading at 24,400 points.

    Example of a Bull Call Spread

    You expect Nifty to rise slightly to 24,600. You buy a 24,400 Call for Rs. 200. At the same time, you sell a 24,600 Call for Rs. 80.

    • Premium Paid: Rs. 200
    • Premium Received: Rs. 80
    • Net Cost (Max Loss): Rs. 120 per unit
    ScenarioDetailsValue
    Max LossNifty stays below 24,400You lose the Rs. 120 paid.
    Max ProfitNifty rises above 24,600(200 strike gap – 120 cost) = Rs. 80 profit.
    Breakeven24,400 + 120 costProfit starts above 24,520.

    On the other hand, a Bear Put Spread is used when you have a moderately bearish view. You expect the market to fall steadily over the coming days. Here, you buy a put option at a higher strike price and sell a put option at a lower strike price.

    Just like the bullish version, both put options must expire on the same date. The premium you receive from selling the lower put reduces the cost of your purchased put. Your maximum loss is capped at the exact amount you paid to enter the trade.

    Example of a Bear Put Spread

    You expect Nifty to fall slightly to 24,200. You buy a 24,400 Put for Rs. 180. At the same time, you sell a 24,200 Put for Rs. 70.

    • Premium Paid: Rs. 180
    • Premium Received: Rs. 70
    • Net Cost (Max Loss): Rs. 110 per unit
    ScenarioDetailsValue
    Max LossNifty stays above 24,400You lose the Rs. 110 paid.
    Max ProfitNifty falls below 24,200(200 strike gap – 110 cost) = Rs. 90 profit.
    Breakeven24,400 – 110 costProfit starts below 24,290.

    Bull call spread vs Bear put spread

    When we compare these two strategies, we find that they are actually mirror images of each other. They both limit your maximum loss and cap your maximum profit.

    The biggest difference lies in your market expectation. You use a bull call spread when you want the market to go up. You use a bear put spread when you want the market to go down.

    Another minor difference is how options are priced in the real market. Put options usually cost a little more than call options because big investors buy them to protect their portfolios. Because of this, the premium you collect from selling the lower put in a bear put spread is often quite attractive.

    Here is a quick comparison table to help you understand the core differences clearly.

    FeatureBull Call SpreadBear Put Spread
    Market ViewModerately BullishModerately Bearish
    Leg 1 (Buy)Buy a lower strike CallBuy a higher strike Put
    Leg 2 (Sell)Sell a higher strike CallSell a lower strike Put
    Max RiskLimited to net premium paidLimited to net premium paid

    Read Also: Cash Market vs F&O: Key Differences

    Which strategy to use when

    Choosing the right strategy depends entirely on where you think the market is heading. Trend identification is the most important skill for an options trader. If the broader market is rising and there is positive news, the bull call spread is a great choice.

    If the market is showing weakness and stock prices are falling, you should look at the bear put spread. We also need to look at something called implied volatility. This tells us how expensive options are at the moment.

    If you want to trade these strategies smoothly, you need a powerful platform like Pocketful.

    Advantages of Bull Call Spread vs Bear put spread

    Some of the main advantages are mentioned below

    • Defined Risk You know exactly what your maximum loss is right from the start. The most you can lose is just the money you paid to set up the trade even if the market suddenly drops.
    • Lower Upfront Cost It is cheaper to set up. When you sell the higher strike call it pays for some of the cost of the lower strike call you bought.
    • Protection Against Time Decay Time passing does not hurt you as much. The option you sold loses value over time and that makes up for the value lost on the option you bought.
    • Good for Moderate Trends It works best if you think the stock will just go up a normal amount instead of having a huge sudden spike.

    Disadvantages Bull Call Spread vs Bear put spread

    Every strategies have a bad side the major limitation of these spreads are explained below

    • Capped Profits Your profits are limited. If the stock shoots way up you will not make any extra money beyond your higher strike price.
    • Requires Accurate Timing Timing is really important. The stock has to go past your breakeven point before the expiration date or you will not make a profit.
    • Risk in Flat Markets If the market does nothing you lose out. If the stock stays flat both options expire worthless and you lose the money you originally paid.
    • Extra Trading Costs You have to pay a bit more in fees since you are doing two trades at once.

    Read Also: Straddle vs Strangle: Key Differences

    Conclusion

    A bull call spread and a bear put spread give you the power to benefit from market moves while keeping your hard earned capital safe.

    Remember, successful trading is all about managing your risk and protecting your downside. Spreads teach you discipline because they force you to accept realistic profits. They are the perfect tools for steady and consistent growth.

    Pocketful  is the platform built specifically for options traders. It gives you access to an advanced option chain and lets you place customizable basket orders directly from it with a very small fee of just Rs 20 per order.

    S.NO.Check Out These Interesting Posts You Might Enjoy!
    1ETF vs Index Fund: Key Differences You Must Know
    2Commodity vs Equity Trading in India: Key Differences
    3Margin Trading vs Short Selling – Key Differences
    4Option Buying vs Option Selling: Key Differences
    5Difference between Online Trading and Offline Trading
    6ETF vs FOF: Key Differences
    7Difference Between Trading and Investing
    8Difference between Margin Trading and Leverage Trading
    9Mutual Funds vs Individual Stocks: Which Investment Option Is Better for You?
    10Bulk Deal vs Block Deal: Key Differences

    Frequently Asked Questions (FAQs)

    1. What is the meaning of a Bull Call Spread and a Bear Put Spread?

      A bull call spread is a strategy where you buy a lower strike call and sell a higher strike call to profit from a rising market. A bear put spread involves buying a higher strike put and selling a lower strike put to profit from a falling market.

    2. What are the main benefits of using these spreads?

      The biggest benefit is that your maximum loss is strictly capped at the net premium you pay. and  they protect your trade from the negative effects of time decay.

    3. How do I decide which strategy to use?

      You should base your decision on your market view. Use a bull call spread if you expect the stock or index to go up steadily and vice-versa.

    4. Can I lose more money than I invested in these strategies?

      No, you cannot. Your maximum risk is known before you enter the trade, and it is strictly limited to the net amount you paid to execute the spread.

    5. How can I easily execute these spreads in the market?

      To execute these spreads smoothly, you need a platform that supports basket orders. Platforms like Pocketful allow you to execute both legs of the spread at the same time directly from the option chain.

  • How to Find Stocks for Swing Trading?

    How to Find Stocks for Swing Trading?

    Swing trading has become popular among traders who do not want to look at charts all day like intraday traders, but still want to capture short-term opportunities in the market. It lies somewhere between day trading and long-term investing, generally holding stocks for a few days to a few weeks to capture price swings.

    But the important question is, how do you find the right stocks for swing trading? Honestly, not every stock is suitable for swing trading.

    In this blog, we will break down step by step and in a simple way, how to find a stock for swing trading.

    What is Swing Trading? 

    Swing trading is a style of trading that seeks to capture short-term market movements. Positions are usually held overnight and generally last from 2 to 10 holding days. This approach usually depends on technical analysis to find entry and exit points. 

    What Makes a Stock Good for Swing Trading?

    1. It Should Be Easy to Buy and Sell (High Liquidity)

    First thing, the stock should be actively traded. If a stock has good volume:

    • You can enter easily
    • You can exit without problems
    • Price does not move too much just because you placed an order

    2. There Should Be a Clear Trend

    This is very important. A good swing trading stock usually moves up consistently (uptrend) or moves down consistently (downtrend)

    Avoid stocks that just move randomly up and down without direction. They can confuse you and lead to bad trades.

    3. Volume Should Support the Move

    Volume tells you if a move is strong or weak. If the price goes up with strong volume, it is a good sign, but if the price moves without volume, it is not very reliable. So always check if volume is supporting the price movement.

    4. The Chart Should Look Clean

    This sounds simple, but it matters a lot. If a chart looks messy, confusing, or random, try to skip it. You want stocks where trends are visible, patterns are clear, movements make sense, and clean charts are easier to trade.

    5. Avoid Very Low-Quality Stocks

    Cheap stocks (penny stocks) may look attractive, but they can be risky. They often have low liquidity, move randomly, and are easily manipulated. Hence, it is better to stick with quality stocks, even if they are slightly expensive.

    Read Also: Best Indicators for Swing Trading

    Step-by-Step Process to Find Swing Trading Stocks

    Step 1: Check Market Sentiment

    Stock movement is often driven by sentiment. You can watch the news, sector performance, global market trends, and check if any company is to announce its results. Positive news or strong sector momentum can act as a catalyst for price movement.

    Step 2: Create a Watchlist 

    Do not try to trade everything. Instead, create a list of 10-20 quality stocks and start trading them, observe their behaviour daily, and wait for good opportunities. Sometimes, consistency matters more than quantity.

    Step 3: Start with liquid stocks 

    Always begin with stocks that are actively traded, because you get better price execution, lower slippage, and easy entry and exit. For example, large-cap stocks with high daily volume can be a good buying option for a swing trade. This ensures smooth trading without getting stuck in positions. 

    Step 4: Look for Volatility 

    Swing trades do need movements, but those movements should be controlled. Look for moderate volatility wherein stocks move steadily within a trend. 

    Additionally, you can check volatility using ATR (average true range) and price movements over the past few days. 

    Step 5: Identify the trend

    Trend is very important when it comes to swing trading. There are three types of trends:

    • Uptrend (higher highs, higher lows)
    • Downtrend (lower highs, lower lows)
    • Sideways (range-bound)

    Swing traders usually buy in an uptrend during pullbacks and sell in a downtrend during rallies. 

    Step 6: Use Technical Indicators:

    Swing trading relies heavily on technical analysis to find opportunities. Some of the most useful indicators include:

    • RSI (Relative Strength Index) – This indicator shows overbought and oversold conditions, and helps identify trend reversals. 
    • Moving Averages – This indicator helps a trader identify trend direction based on the past price movements, and is a lagging indicator. The common types of MA are simple moving average (SMA), exponential moving average (EMA) and weighted moving average (WMA)
    • MACD – This indicator is moving average convergence divergence. It helps traders identify possible trend reversals and helps in the determination of entry and exit points. 
    • Volume – This usually confirms the strength of a move. If a stock has crossed its resistance with a high volume, it will likely show a rally in the upcoming weeks.

    Step 7: Focus on Support and Resistance Levels 

    Support and resistance are key levels where price tends to react. When the stock is near the support zone, the price tends to bounce up, and when it is near the resistance zone, the price tends to fall. 

    Swing traders often buy near support and sell near resistance. These levels also help in setting stop-loss and defining targets. 

    Furthermore, instead of manually searching hundreds of stocks, use a stock screener.

    Screeners help you filter stocks based on price movements, volume, indicators, and market capitalisation. Stock screeners make the process faster and more systematic.

    Read Also: MTF Swing Trading Strategy

    Risk Management in Swing Trading 

    Trading in general is more about how you manage your risk once you enter a trade. Because no matter how good your analysis is, some trades will go wrong.The goal is simple: protect your capital first, profits will follow.

    Let us see how we can manage risk while swing trading. 

    • Always Use a Stop Loss: This is the most basic rule. Before entering any trade, decide the level at which you will exit if the trade goes wrong. This is known as your stop-loss. For example, if you buy at 100, you set a stop loss at 95. If the stock even falls now, your loss is limited. 
    • Do not Risk too much on one Trade: Never put a big portion of your capital at risk in a single trade. Follow one simple rule of risking only 1-2% of your total capital per trade. So even if a few trades go wrong, your overall portfolio stays safe. 
    • Keep Risk-Reward in Mind: Before taking a trade, ask yourself, “Is it worth it”? For example, if you are risking ₹100, try to aim for at least ₹200. This way, even if some trades fail, you can still stay profitable over time.
    • Avoid Overtrading: Taking too many trades usually leads to mistakes. You do not have to trade every day. Wait for good setups and opportunities. Sometimes, doing nothing is also a good decision.
    • Adjust your position size: Not every trade is equal. If you feel that this trade looks risky, use less capital. If it looks strong, you can go slightly bigger. This helps you manage risk better without overexposing yourself. 

    Read Also: Best Swing Trading Patterns

    Conclusion 

    At its core, swing trading is about finding the right stocks, waiting for the right setup, and managing your risk properly.

    You do not need to catch every move in the market. Even a few good trades, when taken with discipline and logic, can make a difference over time. The important aspect is to stay patient and not rush into trades just because the market is moving.

    You need to understand that there will be losses, and that is part of the process. But if you keep those losses small and stick to a plan, you will grow consistently. 

    You can execute unlimited swing trades on Pocketful with zero brokerage on delivery. It offers advanced charts, instant buy/sell options, and same-day deposit and withdrawal for a seamless trading experience.

    S.NO.Check Out These Interesting Posts You Might Enjoy!
    1What is the Best Time Frame for Swing Trading?
    2Scalping vs Swing Trading: Which Strategy Fits You Best?
    3Swing Trading vs Day Trading: Which Strategy Is Right For You?
    4Supply and Demand Trading Strategy
    55 Must-Read Best Swing Trading Books for Trader

    Frequently Asked Questions (FAQs)

    1. What is the best stock for swing trading?

      There is no single best stock. Look for liquid stocks with good volatility and clear trends.

    2. How many stocks should I track?

      Curating a list of 10-20stocks is enough. You can track them. 

    3. Is swing trading risky?

      Yes, but risk can be managed with proper stop-loss and position sizing.

    4. How long should I hold a swing trade?

      It is suggested to hold for a few days to a few weeks.

    5. Do I need to analyse fundamentals before swing trading?

      Yes, because basic understanding helps avoid risky stocks. 

  • Best Exit Strategies for Day Traders

    Best Exit Strategies for Day Traders

    Have you ever bought a stock and watched it go up, only to see it crash before the market closed? We all have been there at some point. Day trading can be very exciting and rewarding. However, it requires a lot of strict discipline and a strong plan.

    Many beginners spend all their time finding the right stock to buy. They think a good entry is all they need to make money. But entering a trade is only half the battle. Your real success depends on your intraday entry and exit strategies.

    Knowing when to exit in intraday trading is what helps you keep your profits safe. It also helps you limit your losses when things go wrong in the market. If you do not have a proper plan, fear and greed can easily take over your mind.

    In this blog, we will talk about how you can plan your trades better. Let us dive into the world of smart trading and learn how to protect our hard-earned money.

    Meaning of Exit Strategies for Day Traders

    An exit strategy is a clear plan you make before you even start a trade. It tells you exactly when you will close your open position. In the stock market, closing a trade on the same day is often called squaring off.

    When you do day trading, you have to square off all your open trades before the market closes. If you forget to do this, your stock broker might do it for you. A good exit plan should always have three main parts to keep you safe.

    The first part is your target price. This is the exact price level where you will sell your stock to book a happy profit. 

    The second part is your stop-loss price. This is the danger level where you will sell your stock to stop any further loss.

    The third part is a daily time limit. For example, you might decide to close all your trades by 3:10 PM every day. You do this no matter if you are in profit or loss. This saves you from sudden wild market moves at the very end of the day. Platforms like Pocketful make it very easy to set these targets and stop-losses right when you place your buy order.

    Good Exit Strategies for Day Traders

    Now that we know why a clear plan is so important, let us look at three very effective exit strategies. You can easily use these methods every single day to protect your trading capital and lock in your profits safely.

    1. The Fixed Target and Stop-Loss Strategy

    This is the most common and simple strategy for anyone starting in the share market. In this method, you decide two exact price points before you even buy the stock. The first point is your target price. This is where you will sell the stock to take your profit home. The second point is your stop-loss price. This is your emergency exit. If the stock drops to this level, you sell it immediately to stop any bigger losses

    Let us understand this with a quick example. Suppose you buy a share of a company at 1000 Rupees. You decide your target price is 1050 Rupees and your stop-loss is 980 Rupees. Here you are risking 20 Rupees to make a profit of 50 Rupees. Once you place the order, you do not need to panic. If it hits 1050, you make money. If it hits 980, you take a small loss and move on.

    2. The Trailing Stop-Loss Strategy

    Imagine you buy a stock, and it starts going up very fast. You want to capture more profit, but you are scared it might suddenly fall and wipe out your current gains. This is exactly where a trailing stop-loss becomes your best friend in the market.

    A trailing stop-loss is a smart digital tool that moves up right along with your stock price. Let us say you buy a stock at 1000 Rupees and set a trailing stop-loss at 950 Rupees. If the stock has a great run and goes up to 1100 Rupees, trail your stop-loss at 1050 Rupees.

    Now, you are in a completely safe zone. Even if the stock suddenly crashes,You still walk away with a happy 5 Rupee profit. 

    3. Exiting at Support and Resistance Levels

    If you like reading price charts, this strategy is perfect for you. This method uses the natural bouncing points of the stock market. You can look at a chart to find the support and resistance zones. Support acts like a strong floor where a falling stock stops and bounces back up. Resistance acts like a hard ceiling where a rising stock struggles to cross and falls back down.

    If you buy a stock and it is rising nicely, you can plan your exit right near the upcoming resistance level. Since the stock will likely hit this ceiling and fall, it is the perfect spot to book your profits.

    Read Also: Top 10 Intraday Trading Strategies & Tips for Beginners

    How to determine Entry, Target and Stop-Loss for Exit strategies for day trader

    Finding the exact points to enter and exit might sound like rocket science. But we can easily do it using some simple market tools. First, you need to find the main market trend.

    You must ask yourself if the stock is going up, going down, or just moving sideways. You should always try to place your trades in the direction of the main trend. Trading against the trend is very risky for beginners.

    To find a safe entry price, you can look for support and resistance levels on your chart. Support is a bottom price level where a falling stock stops and bounces back up. Resistance is a top price level where a rising stock stops and falls back down.

    If a stock is in an upward trend, you can buy it near a strong support level. This gives you a safe entry point with less risk. Now, let us look at some technical tools, how you can use these tools to find your targets and stop-losses.

    Technical ToolHow it helps you in Day TradingHow to use it for Exits
    Moving AveragesIt smooths out messy price changes to show you a clear line of the trend.You can quickly exit your buy trade if the stock price falls below this moving average line.
    RSI (Relative Strength Index)It is a number that tells you if a stock is overbought or oversold by traders.If RSI goes above 70, the stock is overbought. You can use this signal as a target to book your profits.
    VWAPIt shows the real average price of a stock based on both volume and price.If the current price goes very far above the VWAP, it might fall soon. This is a good place to plan your exit.

    Once you find your perfect entry, you absolutely must set a stop-loss. You should place your stop-loss just slightly below the support level for your buy trades. This way, if the support level breaks, you are out of the trade with a very small loss.

    You need good software to see all these price levels clearly. Pocketful offers great and fast charting software to help you spot these entry and exit levels quickly.

    Advantage of Exit strategies for day trader

    Having a strict exit plan has many wonderful benefits for you. It helps you become a calm, disciplined, and relaxed trader. Let us look at the main advantages of having these strategies.

    • Protects Your Money: A stop-loss ensures that one single bad trade does not wipe out your whole account. It cuts your losses automatically without any delay.
    • Secures Your Profits Stock markets can go up and down very fast. A preset target helps you book your profits in cash before the market trend reverses.
    • Reduces Your Stress : When you know your exit points before trading, you do not panic. It removes negative emotions like fear and greed from your decisions.
    • No Overnight Tensions Since you exit everything on the same day, you sleep peacefully. You do not have to worry about bad global news coming after market hours.

    By deciding your exit point early, you also save yourself from sitting in front of the screen all day with a fast-beating heart. You simply let the system do the hard work for you.

    Disadvantage of Exit strategies for day trader

    While exit strategies are great, they do have a few downsides too. You need to be aware of these facts so you can manage your daily expectations well. Let us look at the disadvantages in a simple way.

    • Limited Daily Profits Since you must exit on the same day, you might miss out on bigger profits if the stock keeps going up the very next morning.
    • Needs Constant Attention Even with a plan, you have to watch the live market closely. This can take a lot of your time and mental energy every day.
    • Higher Trading Costs Day trading means you buy and sell very often. This frequent trading leads to higher brokerage fees and government taxes.
    • Early False Exits Sometimes, the price drops just enough to hit your stop-loss, and then goes back up. You exit with a loss, which feels very frustrating.

    Even with these negative points, the safety provided by an exit strategy is far better than trading blindly based on luck. It is always better to have limited profits than to face unlimited losses.

    Read Also: What Is Day Trading and How to Start With It?

    Conclusion

    Day trading can be a wonderful way to grow your money if you do it with strict rules. The stock market can be a very wild place, but your solid plan will keep you grounded. Always remember that saving your capital is much more important than making huge profits on a single day.

    We truly hope this guide helps you make much better choices in the stock market. You can use modern platforms like Pocketful to get advanced tools that make your daily trading journey smooth and easy. Keep learning new things, stick to your written plan, and enjoy the beautiful process of becoming a better trader every single day.

    S.NO.Check Out These Interesting Posts You Might Enjoy!
    1What is Tick Trading? Meaning & How Does it Work?
    2Crude Oil Trading Strategy: Best Time, Tips & Indicators
    3Common Trading Mistakes Beginners Make (And How to Avoid Them)
    4Understanding Intraday Trading Timings
    5Bank NIFTY Intraday Options Trading: Steps, Strategies & Tips
    6Top Indicators Used By Intraday Traders In Scalping
    7How to Choose Stocks for Intraday the Right Way?
    8Best Option Selling Strategy in India
    9MTF Strategy for Beginners in India
    10SEBI MTF Rules 2026 Explained

    Frequently Asked Questions (FAQs)

    1. What is the exact meaning of an exit strategy in day trading?

      What is the exact meaning of an exit strategy in day trading? An exit strategy is a clear, written plan you make before entering any trade. It tells you the exact price to sell for a profit and the exact price to sell for a loss. 

    2. What are key advantages of using a stop-loss?

      The biggest benefit is that it limits your financial loss if the stock price moves against your wish. 

    3. How to use technical tools for my daily exit plan?

      You can easily use simple tools like Moving Averages or RSI on your live stock charts. 

    4. How do I easily decide my daily profit target?

      You should always look at the risk and reward balance. If your stop-loss risks 100 Rupees, your profit target should be at least 150 Rupees or more.

    5. What happens if I forget to exit my intraday trade?

      If you do not exit your trade by yourself, your stock broker will do it for you just before the market closes. 

  • What is Cover Order?

    What is Cover Order?

    Stock market trading is simply buying and selling of shares of different companies. Many people in India are now trying intraday trading. This means they buy and sell shares on the same day before the market closes. This can make quick profits but can also be risky at times. 

    Managing risk is one of the most important parts of intraday trading. It means you decide how much money you are willing to lose before you even start. Without a plan, one bad trade can take away all your savings. This is why tools like cover orders are so popular in India. Let us start by looking at what is cover order and how it keeps your money safe.

    What is a Cover Order?

    If you are new to the market, the cover order meaning is very easy to understand. This acts like two-in-one deal. When you buy a stock, you usually place one order. But with this special type, you place two orders at the very same time.

    The first part is your main order. This is where you buy or sell the stock. The second part is a stop-loss order. This second part is like a security guard. It stands there to watch your trade. If the price goes the wrong way and hits a certain limit, this guard will automatically close your trade.

    Using a cover order in the share market means you are “covering” your risk from the start. You don’t have to wait and watch the screen every second. The system already knows when to pull you out of a bad trade. Many beginners ask what is a cover order when they see the option on their trading app. It is simply a way to trade with a safety net. This makes cover trading a great choice for people who want to be disciplined and avoid big losses.

    Key Features of Cover Orders

    Every trading tool has its own set of rules. Here are the main things you should know about these orders.

    • Mandatory Stop-Loss Order: In a normal trade, you can choose to set a stop-loss or not. But in this case, it is compulsory. You cannot place the order without telling the system where to stop the loss. This forces you to be a disciplined trader.
    • Intraday-Only Order Type: These orders are only for people who want to finish their trades on the same day. In India, the market closes at 3:30 PM. If you do not close your trade by 3:15 PM, your broker will usually do it for you automatically. You cannot hold these shares for the next day.
    • Higher Leverage with Lower Margin: Brokers give you “leverage,” which is like a temporary loan to buy more shares. Because you have a mandatory stop-loss, the broker feels safer. They know you won’t lose too much money. So, they let you trade with more money than you actually have in your account.

    Types of Cover Orders

    There are basically two ways you can use this tool depending on your view of the market.

    1. Long Cover Order: You use this when you think the market will go up. You buy first and set a stop-loss below your buying price. It is for the “bulls” who are feeling positive.
    2. Short Cover Order: You use this when you think the market will go down. You sell first and set a stop-loss above your selling price. It is for the “bears” who think prices will fall.

    Two Legs of a Cover Orders

    Every such order has two “legs” or parts.

    • The Main Leg: This is your entry into the market. It can be a buy or a sell.
    • The Stop-Loss Leg: This is your exit plan. It always works in the opposite direction of your first move to protect you.

    Read Also: What is Covered Call?

    Benefits of Cover Orders

    • Risk Management: You know exactly how much you might lose. This stops you from making emotional mistakes when the market gets scary.
    • Automation: You don’t have to keep staring at the charts. The system handles the exit for you.
    • Higher Leverage: You can trade a larger quantity of shares with less money. This can lead to better profits if your timing is right.
    • Peace of Mind: You can go about your day. If you are a working professional, you don’t have to worry about a sudden market crash wiping you out.
    • Faster Execution: Both the entry and the safety exit are sent to the exchange at once. This saves precious seconds.

    Risks & Limitations of Cover Orders

    • Mandatory Stop-Loss: Sometimes the price might hit your stop-loss and then immediately go back up. Because the stop-loss is mandatory, you might get “kicked out” of a trade too early.
    • Intraday Only: You cannot change your mind and keep the shares for a few days. You must exit before the day ends, even if you are in a small loss.
    • No Trailing Stop-Loss: Most basic cover orders don’t move automatically with the price. If the price goes up, you have to manually move your stop-loss higher to lock in profits.
    • Slippage Risk: In a very fast market, the price might jump over your stop-loss. This means you might lose a little more than you planned because the system couldn’t find a buyer at your exact price.
    • Over-Leverage Risk: Because the broker gives you extra money, you might be tempted to take very big trades. If many trades go wrong, it can still hurt your account.

    Cover Order vs Bracket Order

    Number of Orders: A cover order has two parts (Entry + Stop-loss). A bracket order has three parts (Entry + Stop-loss + Target Profit).

    In a cover order, you only set the bottom limit for loss. You have to manually sell to book your profit. In a bracket order, you set both the bottom limit and the top profit target.

    Use a cover order if you want to let your profits run as high as possible. Use a bracket order if you want to be completely “hands-off” and let the system book your profit too.

    Example of a Cover Order

    Example for Buy (Long Position)

    Let’s say you want to buy shares of Reliance at Rs.2,500 and you think that the price will go upto Rs.2,550. But risk also needs to be managed and you decide to exit if the price falls to Rs.2,480. 

    You place a buy cover order and your main order is at Rs.2,500. Your stop-loss is at Rs.2,480. If the price goes up to Rs.2,550, you can sell and make a profit of Rs.50 per share. But if the price starts to drop at Rs.2,480, the system will automatically sell it for you. Here you will only lose Rs.20 per share and the losses are capped.

    Example for Sell (Short Position)

    Short selling means you sell the shares first believing that the price will fall. Imagine HDFC Bank is at Rs.1,600 and you believe that the prices will go down, you sell it at Rs.1,600. 

    A stop-loss at Rs.1,615 is set, but if the price goes up instead of down, you will lose money. But once it hits Rs.1,615, the system will buy the shares back for you. You stop your loss at Rs.15 per share.

    This tool helps you see the balance. You decide the risk (the stop-loss) and you hope for the reward (the profit). It makes your trading very clear and logical.

    Read Also: Best Fast Order Execution Broker Platforms in India

    Conclusion

    Trading in the share market is a journey. Like any journey, safety should come first. The cover order is a simple and powerful tool that gives you that safety. It helps you manage your risk, gives you extra trading power, and keeps your emotions in check. Whether you think the market is going up or down, this tool helps you trade with a clear plan.

    For more market news and insights, download Pocketful – offering users zero brokerage on delivery trades and an easy to use platform designed for both beginners and experienced investors.

    S.NO.Check Out These Interesting Posts You Might Enjoy!
    1What is Algo Trading?
    2What is Spread Trading?
    3What is Quantitative Trading?
    4Arbitrage Trading in India – How Does it Work and Strategies
    5Silver Futures Trading – Meaning, Benefits and Risks
    6Best Brokers for Low Latency Trading in India
    7What Is Colour Trading
    8What is Spot Trading and How Do You Profit?
    9What is Commodity Market in India?
    10What is Future Trading and How Does It Work?

    Frequently Asked Questions (FAQs)

    1. Can I use a cover order for long-term delivery?

      No. These are strictly for intraday trading. You must close your position on the same day. If you want to hold shares for months or years, you should use a regular delivery order. 

    2. Can stop-loss be cancelled in cover orders?

      If you have filled the main order, stop loss becomes mandatory. The prices of the stop-loss can be changed but it cannot be removed entirely. 

    3. What happens if I forget to close my trade?

      Most Indian brokers will automatically close your open cover orders a few minutes before the market shuts. However, they might charge a small fee for this service.

    4. Can I use this for Options trading?

      Most popular brokers in India do not allow cover orders for Options. This is because Options are very volatile and the risk is too high for the broker to offer extra leverage.

    5. Why is my stop-loss not executing at the exact price?

      This happens during “slippage.” If the market moves too fast, there might not be anyone to buy your shares at your exact price. The system will then sell at the next best price available.

  • Silver Intraday Trading Strategy 

    Silver Intraday Trading Strategy 

    Silver has become a popular choice for intraday traders, mainly because it moves well during the day. And in trading, movement is what creates opportunity.

    But intraday trading is not just about taking quick trades. It’s about understanding how the market behaves, when it is most active, and how to approach it with a clear plan.

    In this blog, we will go through everything you need to know, like the best time to trade, what affects silver prices, simple strategies, and a few useful indicators.

    Why you should Trade Silver Intraday?

    Silver is one of those assets that moves a lot during the day. And for intraday traders, that movement is exactly what creates opportunities. But beyond just “price movement,” there are a few solid reasons why silver works well for intraday trading.

    • Prices Move Fast: Silver prices do not stay still. Even small global updates, like changes in the US dollar or interest rates, can push prices up or down quickly. For a trader, this means you do not have to wait for days. Good moves can come within hours.
    • You do not Need Very High Capital: With smaller contracts like Silver Mini and Silver Micro, you don’t need a huge amount of money to start. You can begin small and increase your position as you gain confidence.
    • Technical Levels Work Well: Silver respects basic technical concepts like support and resistance, breakouts, and trendlines, so even simple strategies can work if you follow them with discipline.
    • Global Events Create Good Opportunities: Big news events, like US inflation data or central bank decisions, often lead to strong moves in silver. These are the times when intraday traders usually find the best setups.

    Factors Affecting Silver Prices 

    • Movement of the US Dollar: Globally, silver is traded in US dollars. So, when the dollar gets stronger, silver prices usually fall. And when the dollar weakens, silver often goes up. It is a simple but very important relationship, and it affects the price of the metal.
    • Interest Rates and Inflation: Investors often consider silver as a way to protect against inflation. When inflation rises, silver can move up, and when interest rates go up, silver can slow down. This happens because higher interest rates make other investments more attractive.
    • Industrial Demand: The white metal is also used in industries such as electronics, automotive, energy, etc. So when demand from these sectors increases, silver prices can move higher.
    • Demand and Supply: Eventually, it still comes down to demand and supply. If more people want to buy silver and the supply is limited, prices go up. If demand is weak or supply is high, prices can fall.
    • Rupee vs Dollar: If you are trading in India, the rupee also matters. Silver can become more expensive because of a weak rupee, and on the contrary, a strong rupee will cause silver prices to come down. So even if global prices stay the same, local prices can still change.

    Read Also: Silver Trading on MCX

    Best Time for Silver Intraday Trading 

    Silver is traded on MCX (Multi-Commodity Exchange). 

    The market opens at 9:00 AM & closes at 11:30 PM most of the year. However, these hours are extended to 11:55 PM during daylight saving time in the US. 

    Daylight Saving Time is a system where clocks are adjusted to make better use of daylight during the year. Clocks are moved forward by 1 hour in summer, and clocks are moved back by 1 hour in winter. 

    If you want to trade silver, you need to focus on the right time. 

    1. Morning (9:00 AM to 12:00 PM): This is when the MCX opens.

    • The market is usually slow
    • Price moves are limited
    • Not many strong trends

    This time is better for watching the market and marking key levels rather than taking big trades

    2. Afternoon (12:00 PM  to 5:00 PM): You can take trades here, but opportunities are usually limited.

    3. Evening (5:00 PM to 11:30 PM): This is the most important time for silver trading.

    • Global markets like London and the US are active
    • Volume increases
    • Price moves become faster and clearer

    This is when most traders prefer to trade because the market gives better opportunities.

    Silver Intraday Trading Strategies 

    1. Breakout Strategy 

    This is one of the easiest strategies to understand. First, mark a range or what we call as resistance and support in technical language, like the high and low of the morning. If the price breaks out of that range, it will most likely continue in the same direction.

    • Buy when the price breaks above the high
    • Sell when it breaks below the low
    • Keep a stop-loss just inside the range

    2. Moving Average Strategy 

    MA strategy helps you stay with the trend. You can use something simple like 9 EMA and 21 EMA.

    • If the shorter average, i.e., 9 EMA, moves above the longer one, i.e., 12 EMA, it suggests an uptrend
    • If it moves below, it suggests a downtrend. 

    3. VWAP Strategy 

    VWAP is a very common intraday indicator. It stands for Volume-weighted average price.

    • If the price is above VWAP, the market is generally strong
    • If the price is below VWAP, the market is weak

    Many traders usually buy near VWAP in an uptrend and sell near VWAP in a downtrend

    4. News-Based Trading 

    Silver reacts quickly to global news, especially from the US. During events like inflation data or interest rate decisions, prices can move fast. But you have to be careful because movement is fast and trends can change very quickly.

    Read Also: Silver Price Last 10 Years in India

    Indicators That Work Best for Silver 

    1. RSI 

    RSI stands for Relative Strength Index and helps you understand if the market has moved too much in one direction.

    • If the RSI is above 70, it suggests the price of the commodity is in an overbought zone and is likely to correct from current levels.
    • Alternatively, if the RSI is below 30, it suggests that the price may be oversold, and there can be a possible rally from the current levels.

    It is mainly used to avoid entering at extreme levels or to find possible reversals

    2. MACD 

    MACD stands for Moving Average Convergence and Divergence, which helps you understand both trend and momentum.

    • When the MACD line crosses above the signal line, it suggests strength, and 
    • When it crosses below, it suggests weakness

    It works well when the market is moving in a clear direction.

    3. Bollinger Bands 

    Bollinger Bands show how much the market is moving. There are usually 3 types of bands: the upper band, the middle band, and the lower band. 

    When prices move closer to the upper band, the asset may be overbought, and when prices move closer to the lower band, the silver may be oversold. 

    Price often reacts near the upper and lower bands, so they can act like temporary resistance and support.

    4. Volume 

    Volume tells you how strong a move really is. High volume indicates a move is strong, and low volume means the move may not last longer. 

    For example, if a breakout happens with good volume, it has a better chance of continuing the ongoing uptrend.

    Conclusion 

    Intraday trading in silver can offer opportunities, but it’s not all about trading. It’s about knowing the market, keeping the trading process simple and being smart with risk. If you trade at the right time and you are disciplined, silver can be a good choice for intraday trading. Invest in Silver Funds & trade Silver Options with advanced tools, enjoy zero brokerage on delivery and zero lifetime AMC with Pocketful

    Frequently Asked Questions (FAQs)

    1. Is silver good for intraday trading?

      Yes, silver moves well during the day, which makes it suitable for intraday trading.

    2. What is the best time to trade silver?

      The evening session, after 5 PM,  when the global markets are also active, is usually the best time to trade.

    3. How much money do I need to start?

      You can start with smaller contracts, so you don’t need a very large amount.

    4. Does news impact silver prices?

      Yes, especially global news like US data. It can cause quick price movements.

    5. What is a common mistake that most traders make?

      Overtrading and not using a stop-loss are very common mistakes.

    Gold Rate in Top Cities of IndiaSilver Rate in Top Cities of India
    Gold rate in AhmedabadSilver rate in Ahmedabad
    Gold rate in AyodhyaSilver rate in Ayodhya
    Gold rate in BangaloreSilver rate in Bangalore
    Gold rate in BhubaneswarSilver rate in Bhubaneswar
    Gold rate in ChandigarhSilver rate in Chandigarh
    Gold rate in ChennaiSilver rate in Chennai
    Gold rate in CoimbatoreSilver rate in Coimbatore
    Gold rate in DelhiSilver rate in Delhi
    Gold rate in HyderabadSilver rate in Hyderabad
    Gold rate in JaipurSilver rate in Jaipur

  • Supply and Demand Trading Strategy

    Supply and Demand Trading Strategy

    When you look at a stock chart, it might feel like prices move randomly. But in reality, there is always a reason behind every rise and fall, and that reason is supply and demand.

    At its core, the market is nothing but a battle between buyers and sellers. When buyers are stronger, prices go up. When sellers dominate, prices fall. 

    Supply and demand trading is about understanding this battle and using it to make better trading decisions.

    What is Supply & Demand Trading?

    Supply and demand trading is a price-action-based strategy where traders identify key areas on a chart where buying or selling pressure is strong.

    Instead of relying heavily on indicators, this method focuses on how the price behaves.

    Demand indicates that buyers are strong, and the prices will move up, whereas supply indicates that sellers are strong and prices will move down.

    Importance of Demand and Supply in Trading

    A lot of traders just look at charts and try to guess what will happen next. But if you focus on demand and supply, you stop guessing, and you start asking better questions like, “Are buyers stronger right now? Or are sellers in control?  

    2. It Makes Entry Points Easier  

    One of the hardest parts of trading is knowing when to enter. This is where demand and supply really help.

    You start noticing certain areas where price reacted strongly before, because places where price shot up were a strong demand zone and conversely, places where price dropped, strong supply zone.

    3.  It Teaches You Patience  

    This is something most traders struggle with. People enter trades because they are getting bored or they have FOMO.

    But when you follow demand and supply, you naturally become more patient. You wait for the price to come to your level. You do not chase it, which alone can improve your trading a lot. 

    4. It Improves Your Timing  

    Timing can make or break a trade. If you enter too early, you end up losing money. Enter too late, you miss the move  

    Demand and supply help you enter closer to where the move starts, which means less risk with better reward, and less stress. 

    Read Also: How to Hedge with Commodity Trading

    What are Demand & Supply Zones 

    When you look at a stock chart, you will notice that the price does not just move randomly. It often reacts in certain areas again and again. Those areas are called demand and supply zones.

    In simple words, these are spots on the chart where a lot of buying or selling happened earlier, which caused a strong move in price.

    A demand zone is an area where buyers take control and push the price up quickly. 

    In this zone, you will usually see that the price moves slowly or sideways, and then suddenly shoots up. It matters because when the price comes back to that same area, buyers often step in again

    A supply zone is the opposite. It is an area where sellers have become strong and pushed the price down fast.

    In this zone, you will notice that the price moves up or sideways, then suddenly drops. That starting point of the fall becomes a supply zone.

    When prices return there again, sellers may become active. 

    Example 

    Let us say a stock is around ₹300. It stays there for some time. Then suddenly jumps to ₹340. 

    That ₹300 area becomes a demand zone. Now, if the price comes back to ₹300 again, buyers will be active, and they might step in again from that level.

    Supply & Demand vs. Support & Resistance 

    S. NoBasisSupply & DemandSupport & Resistance
    1Basic IdeaFocuses on areas where strong buying or selling has happenedFocuses on price levels where the price has reacted before
    2FormZones (a range or area)Lines (specific price levels)
    3ConceptBased on the imbalance between buyers and sellersBased on past price reactions
    4FormationCreated by strong, sudden moves in priceFormed by repeated rejection at a level
    5ApproachMore price-action basedOften used with technical analysis tools
    6Risk ManagementEasier to place stop-loss beyond the zoneStop-loss placed slightly above/below the line
    7ReliabilityOften considered more dynamic and realisticCan sometimes give false signals if too rigid

    Supply & Demand Trading Strategy 

    1. Buying Strategy 

    • Identify a strong demand zone
    • Wait for the price to return
    • Look for confirmation (like bullish candles)
    • Enter a buy trade
    • Place stop-loss below the zone. 

    2. Selling Strategy 

    • Identify a strong supply zone
    • Wait for the price to revisit
    • Look for bearish confirmation
    • Enter a sell trade
    • Place a stop-loss above the zone

    Risk Management in Supply & Demand Trading 

    1. Always Use a Stop-Loss

    This is non-negotiable. When you take a trade based on a demand or supply zone, you should know where to place a stop loss. If you are buying at a demand zone, stop-loss below the zone, selling at a supply zone, stop-loss above the zone. 

    2. Risk Only a Small Amount Per Trade

    Do not put a big chunk of your capital into one trade.

    A simple rule many traders follow is to risk only 1-2% of their capital per trade. This way, even if a few trades go wrong, your overall capital stays safe.

    3. Do not Trade Every Zone

    Not every demand or supply zone is worth trading. Some zones are weak, some are already tested multiple times.

    You can focus on fresh zones (not tested too many times), strong moves away from the zone, and zones that are aligned with the trend because quality matters more than quantity.

    4. Wait for Confirmation

    Do not blindly enter just because the price reached a zone. Wait for some sign of why buyers or sellers are stepping in. Look for 

    • Strong rejection candle
    • Engulfing pattern
    • Momentum shift

    This extra patience can save you from many bad trades.

    Advantages of Supply and Demand Trading

    • Easy to Understand: Demand and supply trading does not involve the use of complex technical indicators. It mainly focuses on price action, which makes it a go-to strategy for traders. 
    • Works in all markets: You can trade using the demand and supply zones in all types of markets, like equity, forex, and crypto, because the concept remains the same. 
    • Helps you Trade with Market Logic: Instead of guessing, you are trading based on price behaviour and trying to follow the zones where buying and selling have already happened. 

    Read Also: What is Demand-Pull Inflation?

    Disadvantages of Supply and Demand Trading

    • Zones can be subjective: Two traders might draw different zones on the same chart. There is no single perfect way to mark them. It completely depends on the traders’ perspective. 
    • Not always accurate: Sometimes, price breaks a zone instead of reacting to it. No strategy works 100% of the time. 
    • Can be misused by beginners: Beginners often do not have much of an idea about trading. They mark too many zones, enter without confirmation, and ignore trend direction.

    Conclusion 

    When you start looking at charts in combination with demand and supply zones, things become a lot clearer. You are no longer just reacting to price movements. You begin to understand why those moves are happening and where they are likely to happen again.

    Demand and supply zones help you focus on the areas that actually matter. They teach you to wait patiently, take better entries, and manage your risk more effectively.

    But like any trading approach, this also takes practice. What matters is staying consistent, learning from your trades, and improving step by step.

    In the long run, trading is less about being right every time and more about being disciplined. Stay patient, keep your trading simple, and let consistency grow your capital over time – start trading with Pocketful

    S.NO.Check Out These Interesting Posts You Might Enjoy!
    1What is Commodity Market in India?
    2What is Intraday Trading?
    3What is Options Trading?
    4What is Future Trading and How Does It Work?
    5Different Types of Trading in the Stock Market
    6What Is Leverage in the Stock Market?
    7Natural Gas Trading Guide: Price Factors, Risks & Strategy
    8What Is Day Trading and How to Start With It?
    9What is AI Trading?
    10Arbitrage Trading in India – How Does it Work and Strategies

    Frequently Asked Questions (FAQs)

    1. What is supply and demand trading in simple terms?

      It is a trading method where you buy at demand zones and sell at supply zones.

    2. Is supply and demand trading better than indicators?

      It depends, but many traders prefer it because it focuses on real price action.

    3. Can beginners use this strategy?

      Yes, but it requires practice and patience.

    4. Does it work in intraday trading?

      Yes, it works in intraday, swing, and positional trading.

    5. What timeframe is best?

      Higher timeframes (like daily) are more reliable.

  • Open Free Demat Account

    Join Pocketful Now

    You have successfully subscribed to the newsletter

    There was an error while trying to send your request. Please try again.

    Pocketful blog will use the information you provide on this form to be in touch with you and to provide updates and marketing.