Category: Trading

  • What is MTF Square Off? Meaning, Process, Margin Call & How to Avoid It

    What is MTF Square Off? Meaning, Process, Margin Call & How to Avoid It

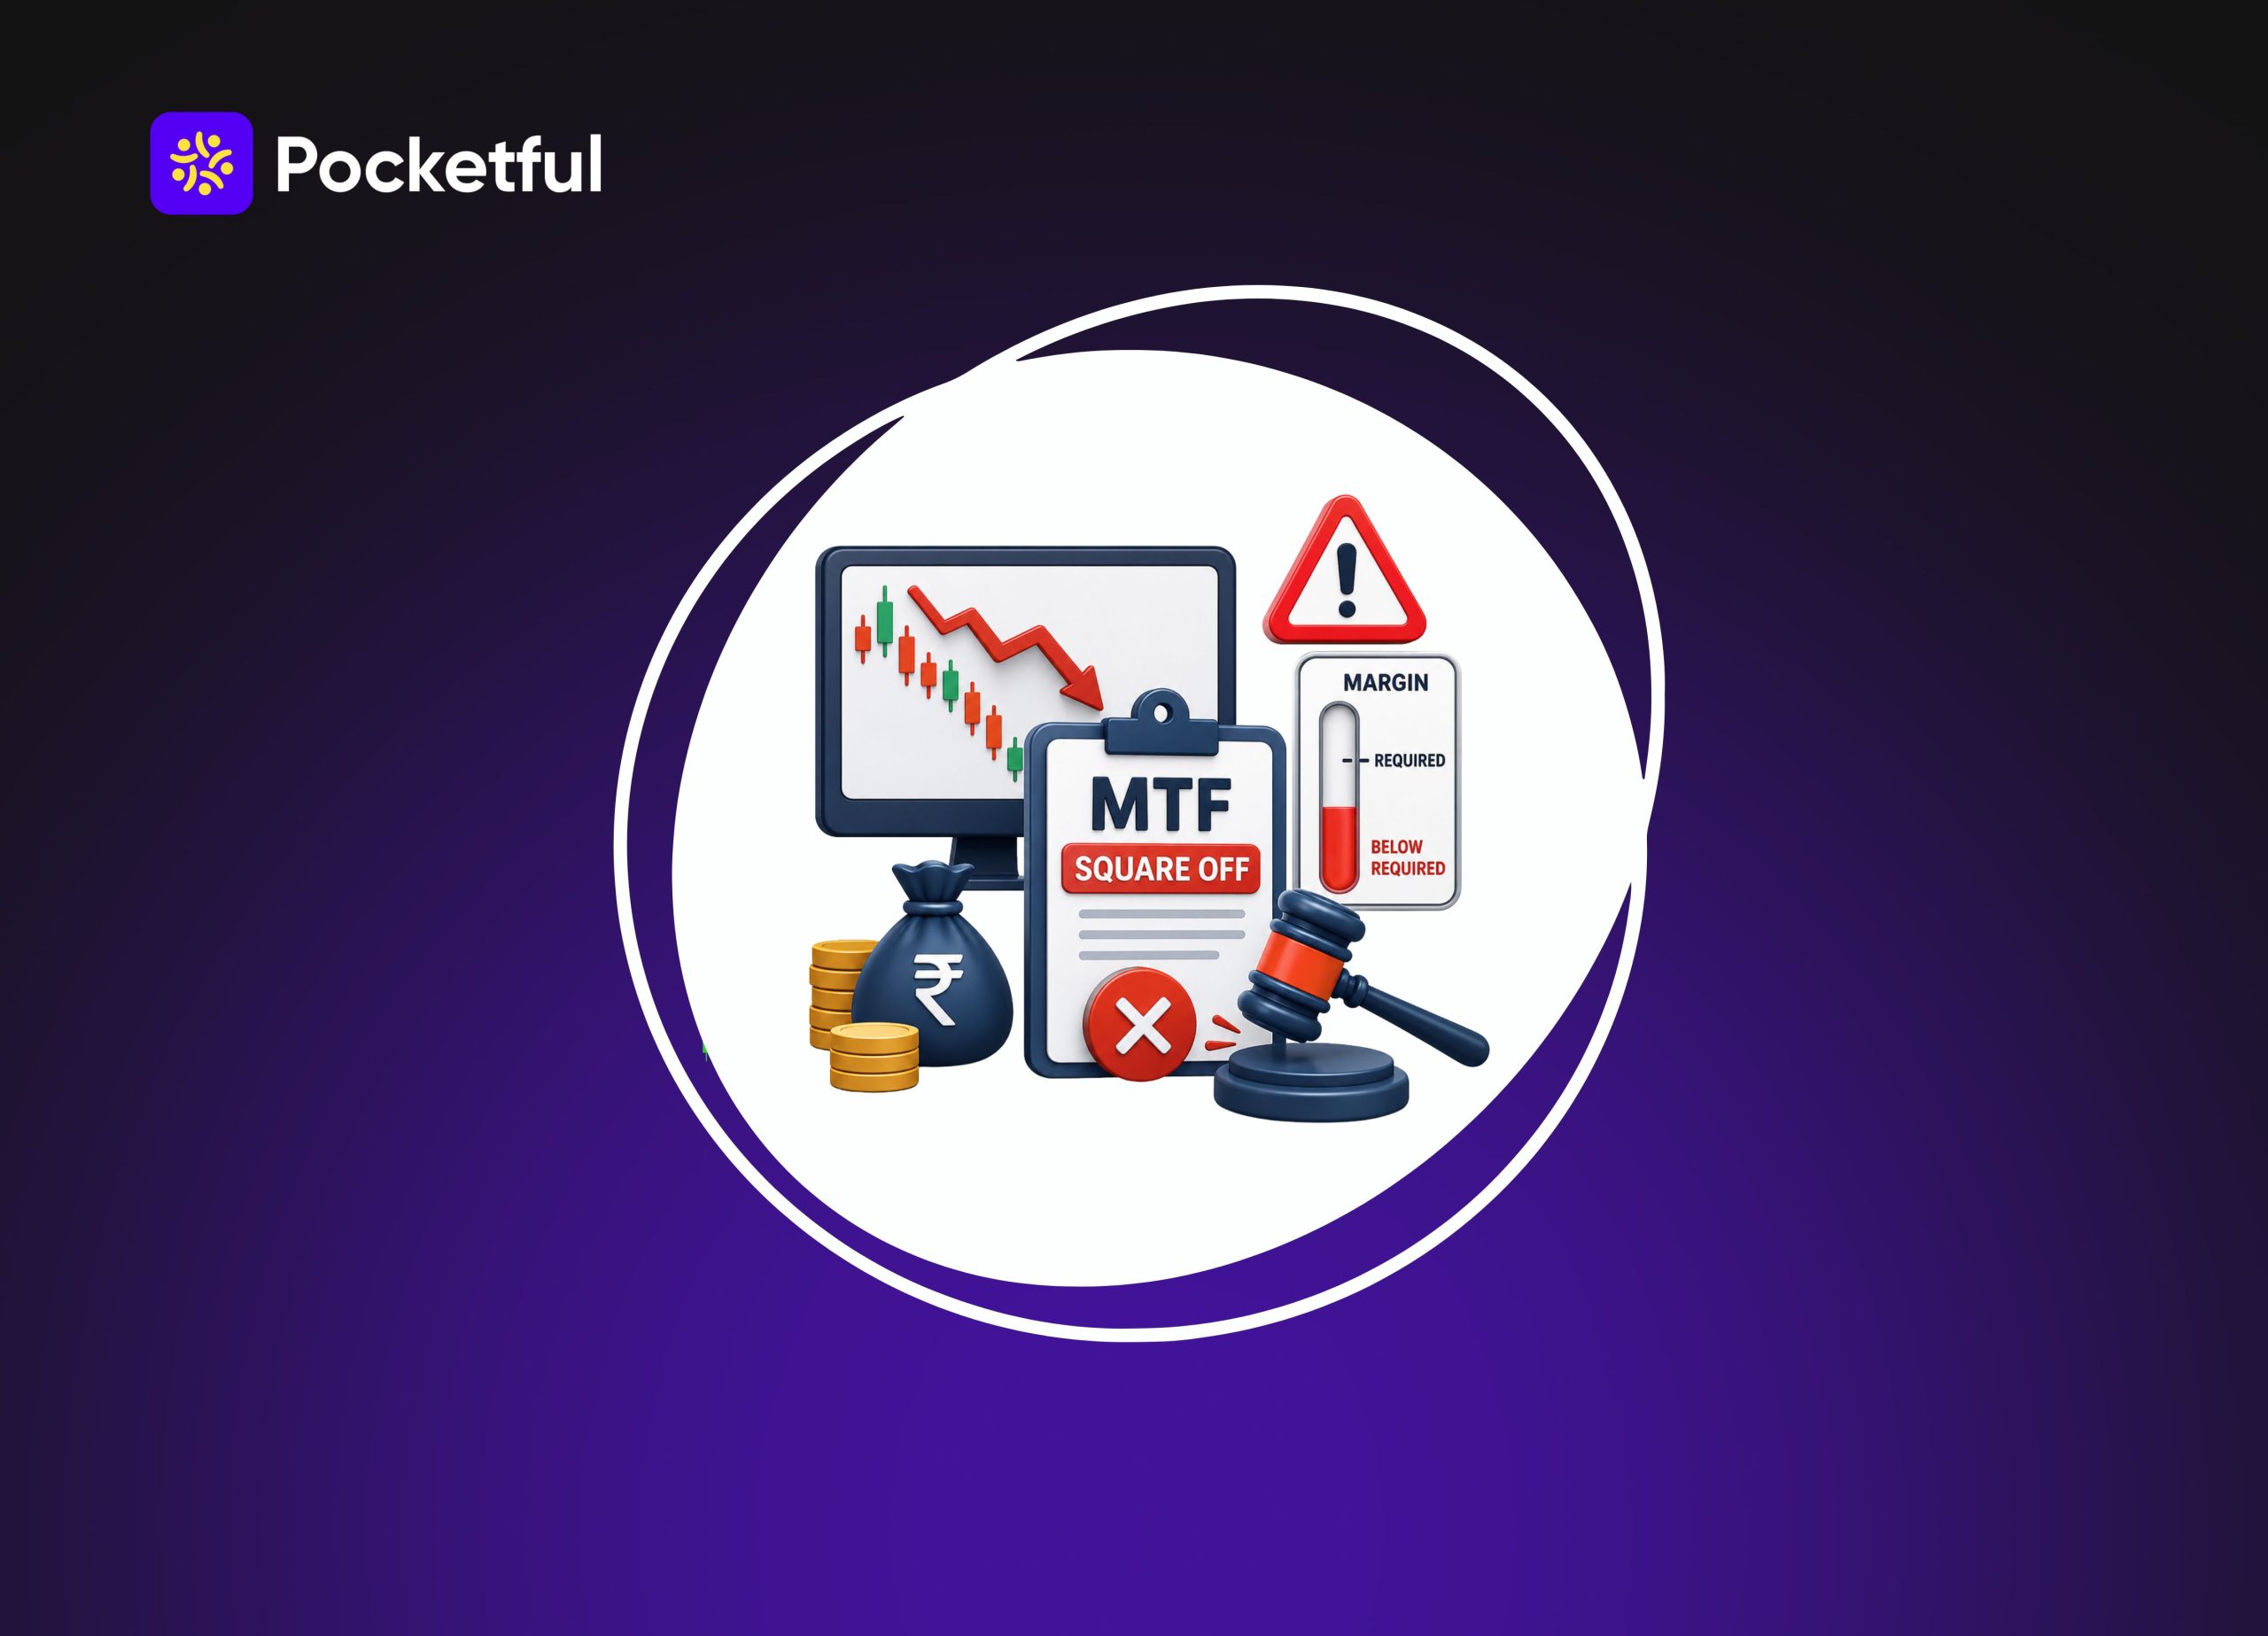
    If you have ever traded using borrowed funds from your broker, chances are you have come across the term MTF square-off at some point. Margin Trading Facility, or MTF, lets you buy more stock than your cash allows, with the broker funding the rest. 

    But this convenience comes with a cost and a catch. If your position moves against you and your margin falls below the required level, the broker has the right to square off your position, often without asking you first.

    It might sound scary if you have never been in it, but once you understand the mechanics, it stops feeling like a mystery and starts feeling like something you can use to plan your trades. Let us break it down properly.

    What is MTF Square Off?

    When you buy shares under MTF, you are putting in a portion of the money as margin, and the broker is funding the remaining amount. In return, the broker holds your shares as collateral. 

    Interest is charged on the funded amount, and there is a constant requirement to maintain a certain margin percentage.

    Square-off, in simple terms, means the broker sells off your MTF position. 

    This can happen for a few reasons. The most common one is that the value of your holding has dropped, and now the margin you have deposited is no longer enough to cover the broker’s exposure. 

    When this happens, you get a margin call, which is a notification asking you to add more funds. If you do not respond in time, the broker squares off the position to protect their own capital, not yours.

    There is also a time-based square-off. Some brokers, depending on their MTF terms, may automatically square off positions that have crossed a certain holding period if they were not converted or if certain conditions were not met. It varies from broker to broker.

    Why Do Brokers Do This? 

    To understand this, try to think from the broker’s perspective for a second. 

    When they lend you money to buy shares, that loan is backed by the shares themselves. If the stock price falls sharply, the value of that collateral drops too. 

    The broker is now exposed to more risk than they signed up for. Square-off is their safety net. 

    It is just risk management on their end, and somewhere in between, it protects you too, even if it does not feel that way.

    Without this mechanism, a small correction in a stock could snowball into a huge loss that neither the trader nor the broker can absorb. 

    How Does MTF Square-off Work? 

    1. Initial Margin

    First, there is the initial margin you pay when you take the MTF position. 

    2. Maintenance Margin

    Then there is the maintenance margin, which is the minimum percentage you need to keep the position open. If the stock price drops and your margin percentage falls below this maintenance level, that is when the alarm bells go off.

    3. Margin Call

    You will get a margin call through SMS, email, or a notification in the trading app. This usually gives you a short window, sometimes the same day, sometimes a day or two, to bring your margin back up either by adding funds or by reducing your position size.

    If you do not act, the broker’s risk management system squares off your position to bring the margin back within limits. Sometimes it is a partial square-off; sometimes it is the entire position, depending on how far the shortfall is.

    This is why keeping an eye on your MTF positions regularly is important.

    Example: 

    Let us say you want to buy shares worth ₹1,00,000, and you decide to opt for MTF instead of paying the full amount yourself.

    The app you’re trading on might ask for 40% as margin, which comes to ₹40,000, and they fund the remaining ₹60,000. 

    Now you have ₹1,00,000 worth of stock, but you have only paid ₹40,000 out of your own pocket.

    The stock drops 8% over the next few days. 

    Your holding, which was worth ₹1,00,000, is now worth ₹92,000. That ₹8,000 loss will come out of your margin. 

    So your ₹40,000 margin has effectively shrunk to ₹32,000, even though the broker’s funded amount of ₹60,000 stays the same.

    Now here comes the role of the maintenance margin. 

    If your broker requires you to always maintain, say, 35% margin against the current value of the position, then on a ₹92,000 holding, you would need at least ₹32,200 as margin. 

    You are on the edge at ₹32,000. This is usually when the margin call notification pops up in your inbox or app.

    If the stock falls another couple of percent from there, your margin gap widens further, and if you have not deposited funds by the deadline given, the broker steps in and starts squaring off enough of your position 

    In this case, that might mean selling off a portion of your shares rather than the entire holding, just enough to restore the 35% cushion.

    Read Also: MTF Holding Period Explained

    Risks Involved in MTF Square-Off

    • Volatility: A stock that seems stable can move 5-6% in a single session on news or sector sentiment, and if you are leveraged, that swing hits your margin much harder than it would in a regular cash position.
    • Interest Costs: MTF is not free leverage. Interest accrues daily on the funded amount, and if a position drags on longer than planned, those costs eat into your returns even if the stock has not moved much.
    • No Buffer Amount: Some traders use every rupee of available margin, leaving zero cushion for even a minor dip. This is a fast way to get caught in a margin call during daily market noise, not even a crash.
    • Timing: Square-offs during highly volatile sessions can happen at prices worse than expected, since the broker is trying to exit quickly, not necessarily at the best possible price for you.

    How to Control Risk?

    1. Most of the risk around MTF square-off is manageable if you build a few habits into your trading routine.
    2. Keep a margin buffer. Do not use the entire leverage available to you. This will not trigger the margin call easily. 
    3. Track your positions daily. A quick glance at your margin utilisation once a day helps you catch problems early instead of finding out through a square-off notification.
    4. Set your own mental stop-loss. Even before the broker’s system forces an exit, decide in advance the price at which you will cut a losing MTF position yourself.
    5. Avoid holding MTF positions through major events like earnings announcements or big macro data releases unless you have specifically planned for the volatility. 
    6. Choose your broker carefully. Margin requirements, interest rates, and square-off policies differ quite a bit across platforms.
    7.  Do not treat MTF as free money. It is a tool, useful when used with discipline, risky when used carelessly.

    Recovery After MTF Square Off

    If you do get squared off, resist the urge to immediately jump back in with a bigger position to recover the loss. This is one of the most common emotional traps in trading. 

    Take a step back, understand what triggered the square-off. 

    It also helps to review your position sizing after an event like this. If a single square-off has dented your capital, it is usually a sign that the position was larger than it should have been as compared to your overall portfolio.

    Read Also: Is Margin Trading Facility (MTF) Safe in India?

    Conclusion 

    MTF square off is simply the system doing what it is meant to do when margin requirements are not met. Once you understand the mechanics, the margin call process, and the common mistakes that lead to forced exits, it becomes a lot easier to trade with leverage responsibly.

    The core idea is fairly simple. Use leverage with a buffer, track your positions, and don’t let interest costs or volatility surprise you. 

    Do that consistently, and MTF becomes a useful tool for your trading strategy rather than a source of stress every time the market gets a rough patch. 

    S.NO.Check Out These Interesting Posts You Might Enjoy!
    1Margin Against Shares: How Does it Work?
    2Margin Pledge: Meaning, Risks, And Benefits
    3What is Intraday Margin Trading?
    4What is Operating Profit Margin?
    5What is Stock Margin?

    Frequently Asked Questions (FAQs)

    1. Can I avoid a square-off after getting a margin call? 

      Yes, just add more funds or reduce your position size before the deadline given in the margin call, 

    2. Does MTF square-off happen automatically every day? 

      No, it only happens when your margin falls short of the maintenance requirement or when time-based rules apply, not as a daily routine.

    3. Is the square-off price the best price for me? 

      Not always. Since brokers often need to exit quickly, especially in volatile sessions, the price may not be the most favourable one for you.

    4. How much margin buffer should I keep to stay safe? 

      There is no fixed number, but keeping some extra than the minimum required margin gives you room to absorb small price swings.

  • Risk to Reward vs Accuracy: Which Matters More in Trading?

    Risk to Reward vs Accuracy: Which Matters More in Trading?

    Many new guys think to win, you must predict market perfectly every time. Have you ever thought why some people make money in markets even if they are wrong half of the time.They waste hours finding a magic trick that never fails. But the truth is very different. You do not need to be right always to make a solid portfolio. In fact, running after perfection can give you big losses. What you truly need is smart balance. Today, we will see the real secret behind smart trading. We will check how managing potential losses against potential gains is way more important than guessing the right direction every single time.

    What exactly is Accuracy and Risk to Reward?

    Let us understand two main pillars of trading. First one is accuracy. In simple words, accuracy means your win rate. If you take ten trades and six make money, your accuracy is 60 percent. Most beginners run behind a very high accuracy rate.

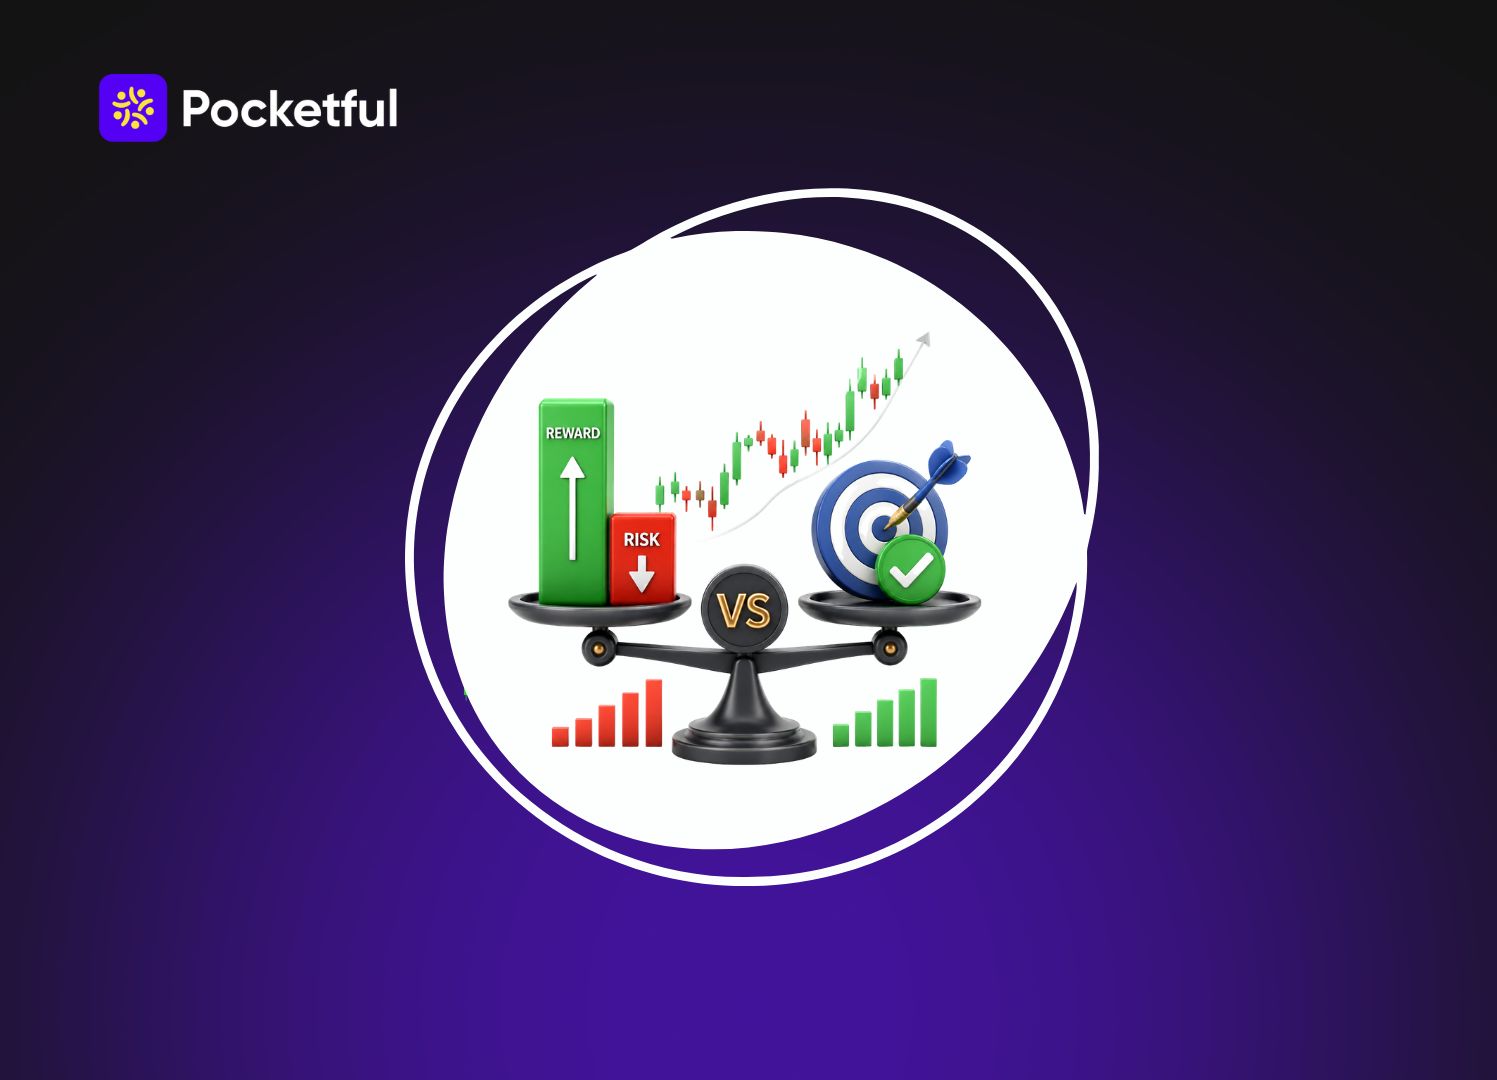
    The second pillar is the risk to reward concept. This simply means how much money you are ready to lose compared to how much you expect to win. For example, if you risk ₹1,000 on a trade to make a profit of ₹2,000, your risk reward ratio is 1:2.

    When we compare risk to reward vs accuracy, a clear picture comes out. High accuracy feels very good for the mind. But a good setup for risk and reward is what actually saves your capital in the long run. You can be wrong more times than right and still come out in profit.

    Decoding Trading Accuracy: Mathematical breakdown 

    Let us look at some math to understand this better. We will check two practical examples which happen daily in the markets.

    High Accuracy, Poor Risk-to-Reward (The Retail Trap) 

    Many new traders get caught in this trap. They book small profits fast but hold on to losing trades hoping it will bounce back. Imagine a trader winning 80 percent of time. His accuracy is amazing. But, he wins ₹2,000 on a good trade and loses ₹10,000 on a bad trade.

    If he does 10 trades, he wins 8 times making ₹16,000. But he loses 2 times and loses ₹20,000. Even with high accuracy, he ends up taking home a net loss of ₹4,000.

    Low Accuracy, Strong Risk-to-Reward (Professional Model) 

    Now, let us see how professional traders do it. They are very fast to cut their losses. Imagine a pro trader who wins only 40 percent of time. He wins ₹10,000 on a good trade but loses only ₹4,000 on a bad trade.

    In 10 trades, he wins 4 times making ₹40,000. He loses 6 times and loses ₹24,000. Even with low accuracy, he takes home a solid profit of ₹16,000. This proves a trader with average accuracy but strong risk control can remain profitable.

    How to Get Breakeven in Risk to Reward

    Before you place any trade, you should know your breakeven point. This is the minimum win rate you need so that you do not lose any money. Here are a few points on how it works:

    • If you have a bigger reward for your risk, you need fewer winning trades to stay safe.
    • The breakeven point drops as your reward goes up. For instance, a 1:2 ratio only needs a 33.3 percent win rate to break even.

    Below is a cheat sheet table based on standard market models. It shows when you make a loss, when you break even, and when you make a profit based on different win rates.

    Risk : Reward20% Win Rate30% Win Rate40% Win Rate50% Win Rate60% Win Rate
    1:1LOSSLOSSLOSSBREAK EVENPROFIT
    1:2LOSSLOSSPROFITPROFITPROFIT
    1:3LOSSPROFITPROFITPROFITPROFIT
    1:4BREAK EVENPROFITPROFITPROFITPROFIT
    1:5PROFITPROFITPROFITPROFITPROFIT

    Option Buying Case Study

    Let us look at a real life case study on option buying. Option buying is tricky because time acts against you. We have two traders, A and B. Both start with ₹10 lakh in capital. Both follow moderate risk practices and risk ₹20,000 per trade.

    Trader A likes to book profits early. He aims for a ₹10,000 profit target, but the risk he takes is ₹20,000. His setup gives a poor ratio of 2:1. Because of this bad setup, Trader A needs a huge 67 percent win rate just to survive.

    Trader B is smarter with his approach. He sets a higher profit target of ₹40,000 while keeping the same risk of ₹20,000. This gives Trader B a strong 1:2 setup, meaning his reward is double his risk. Thanks to this, Trader B only needs a 34 percent accuracy to stay viable. He also operates under much less psychological pressure.

    Read Also: Risk-Reward Ratio & Position Sizing in Trading

    Benefit of using risk to reward ratio

    Here are the top five benefits of strictly following a good risk setup:

    • Protects your capital: It shields your trading account from sudden catastrophic market drops.
    • Keeps you profitable long term: You can secure long-term profitability even if your win rate is lower than 50 percent.
    • Builds consistency: It creates a disciplined and consistent approach to your daily trading.
    • Forces you to pick quality trades: It ensures you only focus on opportunities where the potential profit clearly outweighs the potential loss.

    Why Risk to Reward Reduces Stress

    Trading can be a very stressful journey if you are always afraid of being wrong. Market psychology plays a huge role in your success. Having a strong setup solves many mental problems. Here is why it reduces stress:

    • Removes the pressure to be perfect: You do not have to guess right every time. You can comfortably accept losses because they are small.
    • Control your emotions: When your risk is small, you don’t panic or get greedy. Soft emotions like fear and overconfidence are kept in check.
    • Improves focus: You only take trades that offer a big reward. This helps you ignore bad trades and wait patiently for the right entries.

    Conclusion

    In the end, both things matter in their own way. Having good accuracy is great, but combining it with a smart risk setup makes you a truly peaceful investor. If you are looking for a smooth investing experience with powerful tools, you can explore Pocketful. It provides smart user interface. It has advanced feature of scalping where you can set your stop loss and target price very fast which helps investor to achieve its idol Risk to reward ratio.

    S.NO.Check Out These Interesting Posts You Might Enjoy!
    1Best Option Selling Strategy in India
    2Trade Breakouts with Options Without Overpaying IV
    3Option Buying vs Option Selling: Key Differences
    4Why Option Buyers Lose Money in Trading
    5Supply and Demand Trading Strategy

    Frequently Asked Questions (FAQs)

    1. What is the meaning of a risk to reward ratio? 

      It measures the potential loss compared to the potential profit of a trade. A 1:2 setup means risking ₹1 to make ₹2.

    2. What is trading accuracy? 

      Accuracy is your win rate. It shows the percentage of your trades that are profitable out of the total trades taken.

    3. What are the benefits of a strong risk setup? 

      It protects your capital and keeps you profitable even if your win rate is less than 50 percent. It also reduces trading stress.

    4. How to use this concept effectively? 

      Decide your stop loss and profit target before taking a trade. Make sure your potential profit is always bigger than your potential loss.

    5. Is accuracy more important than risk management? 

      No. A trader with average accuracy and strong risk control can stay profitable. But high accuracy with bad risk control will eventually fail.

  • How to Use AI to Optimize Your Trading Strategy

    How to Use AI to Optimize Your Trading Strategy

    Stock markets move at a very high speed today. Millions of price changes happen across screens every single second. Human eyes simply cannot track all this fast moving data manually. We often find ourselves overwhelmed by endless charts and news updates. This is exactly where modern technology steps in to save the day. Smart computer programs can read massive amounts of information instantly. Let us understand how it actually works.

    What AI Optimized Trading Actually Means in 2026

    If you are wondering how to use AI for trading, it simply means moving from manual guesswork to smart logic. In 2026, artificial intelligence in the stock market involves using computer programs to read charts, news, and market mood instantly. The system uses mathematical rules to decide exactly when to buy or sell a stock.

    Let us look at a practical example. A traditional trader might spend hours reading company earnings reports and checking moving averages on a screen. A modern automated system finishes this exact same task in mere milliseconds.

    It spots a sudden spike in positive news and matches it with a technical breakout on the pricing charts. Learning how to use AI in trading means setting up these mechanical rules so the computer does the heavy lifting for you. You become a manager of digital systems instead of a manual clicker.

    This systematic approach removes human panic and emotional errors completely. A recent SEBI study showed that over ninety percent of retail traders lose money in options trading. 

    Three AI Layers: LLMs, Classical ML, and Reinforcement Learning

    Artificial intelligence in financial markets operates on three distinct levels. Each layer serves a unique purpose for different market participants. You will mostly interact with the first two layers, while the third remains largely used by big financial institutions.

    Understanding these layers helps you pick the right tool for the right job. A text based model cannot predict stock prices accurately on its own. Similarly, a mathematical pricing model cannot read a news article or summarize earnings calls.

    AI LayerCommon ToolsRole in TradingKey Limitations
    Large Language Models (LLMs)ChatGPT, Claude, GeminiIdea generation, sentiment analysis, writing backtest codeWeak at price prediction, prone to guessing wrong numbers
    Classical Machine Learningscikit-learn, XGBoost, LightGBMFiltering signals, identifying market trends, ranking parametersRequires clean data, can easily memorize past data incorrectly
    Reinforcement Learning (RL)Stable Baselines3, RLlibAdaptive execution, position sizing, dynamic entry timingHighly fragile in new markets, very complex to design for retail users

    These tools work best when we combine them properly. You might use a language model to write the initial strategy code in Python. Then, classical machine learning is used to filter out bad trade signals based on historical market data.

    What AI Can Do and What It Still Cannot Do

    Traders often misunderstand the true power of machine learning in the stock market. It is highly capable but it is not magic. Setting realistic expectations is vital for your long term survival in the markets.

    Here is what artificial intelligence can actually do for you:

    • Scan thousands of stocks and technical indicators in seconds.
    • Read and summarize financial news, earnings reports, and social media sentiment instantly.
    • Backtest years of historical data to see if a strategy worked in the past.
    • Execute trades automatically without fear, greed, or any hesitation.

    Here is what artificial intelligence still cannot do:

    • Predict the future with absolute certainty or guarantee zero losses.
    • Anticipate sudden, unexpected real world events like geopolitical conflicts.
    • Factor in real time slippage perfectly during major news spikes.
    • Replace your need to manage risk and monitor the overall system.

    Read Also: The Impact of AI on Stock Market Trading

    How to Do AI Trading

    Setting up an automated system follows a clear five step loop. This structured approach ensures that you test ideas properly before risking any real money. We will walk through these steps simply.

    Step 1: Generate Strategy Ideas with LLMs

    Use Large Language Models to turn vague market observations into testable ideas. You can convert subjective thoughts into mechanical rules based on strict price data. You just type what you want in plain English, and the tool helps you write the code even if you do not know Python.

    Step 2: Prepare Clean Data

    Collect reliable historical market data from trusted sources. Clean this data meticulously by removing duplicate timestamps and filtering out extreme news spikes. If you punch bad data to a good system, you will always get bad results and unexpected losses.

    Step 3: Build an Optimizer

    Search for a robust set of parameters using machine learning tools. Focus on steady risk adjusted returns rather than a single massive peak of past performance. Finding the right settings takes patience, as you do not want a system that only worked once by pure luck.

    Step 4: Walk Forward Validation

    Test the optimized strategy on completely unseen historical data. Think of this step as a mock exam before the real test. This ensures the system survives in new market conditions rather than just memorizing the past.

    Step 5: Deploy Live Signals

    Connect the logic to a broker interface or a visual alert system. Start with very small capital to monitor how the system handles real world execution. It is always best to paper trade first before trusting the system with your hard earned money.

    Where AI Fails Traders

    Relying entirely on algorithms without active supervision leads to significant risks. Systems fail when live market realities break historical assumptions. You must be aware of these common traps.

    • Regime Shifts and Changing Markets: Markets constantly change from trending periods to ranging periods. A model trained heavily in a massive bull market will fail miserably when a sudden bear market begins. You must regularly check your systems to ensure they match current market conditions.
    • News Spikes and Liquidity Gaps: Algorithms struggle to simulate real time price slippage during major scheduled news events. A stop loss might look safe on a paper test but suffer massive gaps in a live, panicked market. Hard coding restrictions to pause trading around major news events protects your capital.
    • The Trap of Overfitting: A system might look flawless on historical data purely because it memorized the market noise. Such over optimized systems typically collapse immediately when trading with real money. The curve is fitted so tightly to past events that it cannot adapt to slight future variations.

    Beginner Friendly AI Trading Workflow

    You do not need to write complex computer code to get started today. The modern ecosystem offers simplified platforms that bring intelligence directly to your trading terminal. These platforms bridge the gap between complex technology and retail accessibility.

    Using trusted platforms like Pocketful makes the entire transition smooth for Indian investors. Pocketful offers Pocketful GPT, a smart assistant designed to explain trades, simplify market concepts, and generate instant insights. You can comfortably ask the assistant about technical indicators, sector rotation, or risk management before placing a live trade.

    The new SEBI rules require secure logins and approved connections to keep retail investors safe. Pocketful takes care of these technical headaches in the background so you can focus entirely on your strategy. You can also read their educational blogs and newsletters to stay updated on market trends.

    The ideal workflow starts with researching via the smart assistant. Next, you test the logic on historical charts or a virtual paper account. Finally, you automate the execution through the robust API interface.

    Pros and Cons of Using AI to Optimize Your Trading Strategy

    Every technological advancement brings clear advantages and hidden drawbacks. Evaluating these fairly helps you build a highly balanced approach to the stock markets. You should weigh these carefully before starting.

    Pros:

    • Emotionless Execution: Algorithms follow programmed rules strictly. They stop you from revenge trading after a loss and prevent greed during massive market rallies.
    • Unmatched Speed: Machines process news and price data in milliseconds. This allows for order execution speeds no human click can possibly match.
    • Massive Data Handling: An automated system can easily track hundreds of stocks simultaneously. It never gets tired or loses focus during long trading hours.

    Cons:

    • Constant Maintenance Needs: Algorithms require active, ongoing monitoring. As market conditions naturally change, the underlying code and rules must be updated to stay relevant.
    • False Confidence: Excellent past performance in backtests often creates a false sense of security. Historical success never promises future profitability in live markets.

    Read Also: Benefits of AI in the Stock Market

    Conclusion

    Artificial intelligence serves as a highly powerful assistant for the modern investor. It handles repetitive analytical tasks, filters massive datasets, and executes orders with extreme precision. We can see how this levels the playing field for retail traders.

    While it does not predict the future or completely eliminate all market risks, it provides a structured framework for navigating financial markets. Adopting these tools thoughtfully allows you to operate with greater efficiency, speed, and clarity.

    S.NO.Check Out These Interesting Posts You Might Enjoy!
    1How AI and Machine Learning Are Transforming Trading Strategies?
    2Scope of AI in Investing: Usage, Benefits, and Challenges
    3What is AI Washing? Definition, Tips, Evolutions & Impact
    4Best Artificial Intelligence (AI) Stocks In India
    5Best Artificial Intelligence (AI) Smallcap Stocks

    Frequently Asked Questions (FAQs)

    1. What is AI trading? 

      It is a computer based algorithms and machine learning to analyze market data, spot trends, and execute trades automatically.

    2. Is algorithmic trading legal for retail investors in India? 

      Yes, it is fully legal. Retail investors can safely use approved broker connections to run their personal strategies while following regulatory guidelines.

    3. What are the benefits of using AI for your strategy? 

      It offer unmatched speed and removes emotional bias.

    4. Do you need to know coding to use AI tools? 

      No. Many modern platforms offer no code strategy builders and smart text assistants, making it easy for beginners to start.

    5. How can you start using AI for trading? 

      Start by using smart screening tools to gather market insights. Always test your strategies on paper before connecting them to a broker

  • The Impact of AI on Stock Market Trading

    The Impact of AI on Stock Market Trading

    The financial landscape is shifting at a rapid pace. A few decades ago, buying shares required manual effort, phone calls, and intense physical monitoring. Today, technology handles the heavy lifting effortlessly. Advanced computer systems now scan massive amounts of market data in a matter of seconds.

    This modern approach brings discipline and structure to the financial sector. It helps ordinary participants and large institutions navigate complex price movements with ease. The old days of slow manual execution are permanently fading away.

    A faster and more calculated era is taking over the exchanges. This transformation changes how wealth is built and managed in the modern economy.

    What is AI Driven Trading?

    Artificial intelligence acts as a digital brain programmed to learn and make decisions. When developers apply this technology to financial markets, machines buy and sell shares automatically. The use of AI in trading completely removes human emotions like fear and greed from the decision-making process.

    This setup relies on complex mathematical formulas and vast amounts of historical data. AI trading systems can monitor stock prices and execute orders the moment a specific condition is met. This automation forms the core impact of AI on stock market operations today.

    Modern algorithms can read news reports and understand the market mood instantly. Using AI for stock trading means a computer can spot a positive earnings report and buy shares before a human finishes reading the headline. The combination of AI and trading allows for execution within milliseconds.

    Today, many AI traders use these smart systems to find hidden patterns that the human eye misses. For example, a system might be programmed to buy a stock if it drops by two percent and sell when it rises by three percent. Platforms like Pocketful offer an ideal environment for this. 

    Impact of AI on Stock Market Trading

    The shift towards automation has completely changed the landscape of financial exchanges. This technology offers several distinct advantages that reshape how market participants operate on a daily basis.

    • Better Risk Management: A recent report by the market regulator revealed that 93 percent of individual participants in the equity derivatives segment incurred net losses. The average loss reached nearly two lakh rupees per person over three years. The data shows that human participants often hold onto losing stocks hoping they will bounce back. Automated systems solve this problem by strictly following stop-loss rules and removing human emotional bias.
    • Massive Volume Contribution: Automated systems now dominate daily market activity. Reports indicate that these algorithms contribute to over fifty percent of the cash market volumes on major Indian exchanges. Large foreign institutions generate nearly 97 percent of their profits through these automated channels. 
    • Instant Data Analysis: Machines scan thousands of articles and financial reports to understand the overall market sentiment. Advanced models like BERT can accurately label news as positive or negative in real time. This capability allows the system to buy or sell before manual participants even see the headlines.
    • Strict Regulatory Oversight: The regulator introduced strict rules in 2026 to make automated environments safer. Every algorithmic order must now carry a unique exchange identification number. Brokers take full responsibility for the algorithms running on their platforms. This ensures that no hidden or illegal strategies harm retail participants.
    • Lower Transaction Costs: Automated execution helps in reducing slippage and overall transaction costs. The technology places orders at the most optimal prices available without hesitation. Retail participants can easily access this technology through modern discount brokers. For example, Pocketful provides zero account opening fee and offers an advanced algorithmic setup without any additional interface costs.

    Read Also: Benefits of AI in the Stock Market

    Power of High Frequency Trading: Speed and Precision

    High frequency trading is a specific type of automated system that executes a massive number of orders in fractions of a second. This method relies purely on speed and precision to capture tiny price differences in the market.

    • Execution in Milliseconds: In financial markets, a delay of one second can lead to significant losses. High frequency systems operate at speeds that humans cannot comprehend. These setups place and modify orders in less than 99 milliseconds. Such extreme speed allows the computer to secure a favorable price before the market moves.
    • Capturing Small Price Differences: High frequency models do not wait for a stock to double in price. They focus on capturing tiny price differences over thousands of transactions. These microscopic gains accumulate into substantial profits by the end of the trading session.
    • Analyzing Deep Market Data: These systems require highly detailed information to function properly. They analyze tick data, which records every single trade and quote change instantly. They also look at Level 2 market depth to see all pending buy and sell orders. This helps the machine predict short-term supply and demand accurately.
    • Controlled Speed Limits: Regulators have implemented strict limits to maintain market stability. Retail participants are restricted to a maximum of 10 orders per second unless they register formally. This threshold prevents system overloads while still allowing regular investors to use basic automation safely.

    Man vs Machine: Why Human Intuition Matters

    FeatureHuman IntuitionMachine Automation
    Data ProcessingSlow and limited to a few sources at a time.Instantaneous analysis of thousands of data points.
    Emotional ControlProne to fear, greed, and panic decisions.Strictly follows rules with zero emotional bias.
    AdaptabilityCan easily understand unexpected global events.Struggles with completely new unprogrammed scenarios.
    Execution SpeedTakes several seconds or minutes to act.Executes complex orders in a few milliseconds.
    Strategy BuildingExcellent at creative big-picture thinking.Excellent at executing repetitive mathematical tasks.

    Despite the incredible speed and data-crunching abilities of machines, the human element remains irreplaceable. Algorithms are only as smart as the people who program them. A machine cannot easily understand the context behind a sudden political event or a global crisis unless it has been explicitly trained for it.

    Conclusion

    A significant step forward for the global economy is marked. This is caused by the integration of advanced technology into financial exchanges. Unmatched speed and precision is brought by automated systems. Discipline is also provided by them. Complex price movements are made easier to be navigate. Harmful emotional biases are removed by it. At the same time, these tools are ensured to be guided by wisdom. Foresight is also provided by the creative and adaptable nature of the human mind. The right balance is remained critical to be found. Programmed efficiency and thoughtful human oversight must be balanced.

    S.NO.Check Out These Interesting Posts You Might Enjoy!
    1How AI and Machine Learning Are Transforming Trading Strategies?
    2Scope of AI in Investing: Usage, Benefits, and Challenges
    3What is AI Washing? Definition, Tips, Evolutions & Impact
    4Best Artificial Intelligence (AI) Stocks In India
    5Best Artificial Intelligence (AI) Smallcap Stocks

    Frequently Asked Questions (FAQs)

    1. What is automated stock trading? 

      It is a system where computer programs buy and sell shares using predefined rules and complex mathematical models.

    2. What are the main benefits of this technology? 

      It executes orders instantly and removes human emotions like fear and greed. It also processes massive amounts of market data in seconds.

    3. How can retail investors use these tools? 

      Investors can use regulated broker platforms that offer visual strategy builders. They can also connect their own rules using application programming interfaces.

    4. Is it completely safe to rely on algorithms? 

      No system is entirely flawless. Technical failures or sudden market crashes can still cause unexpected losses. Proper risk management remains essential.

    5. Do new market rules affect everyday participants? 

      Yes. Recent regulations require formal registration for systems executing more than 10 orders per second. This ensures a safer environment for everyone.

  • What Is SGX Nifty? Meaning, Timings & GIFT Nifty Explained

    What Is SGX Nifty? Meaning, Timings & GIFT Nifty Explained

    Traders wake up every morning and check for the international indexes even before the Indian stock market opens. Investors rely on this global indicator and watch it carefully as it provides strong hints about how the domestic market will act. This index helps the investors to understand the mood of the global market. This mood acts as an early sign to understand about the aftermath of major international news that happened while the domestic market was closed. By observing these early price movements, investors make decisions and strategies so that they can maximize profits and mitigate the upcoming risks. 

    What is SGX Nifty?

    In the global stock market, the term sgx nifty india holds a lot of value. To fully understand the sgx meaning, traders look at its basic origin. The sgx nifty full form is Singapore Exchange Nifty. It was a special financial contract based on the Indian Nifty 50 index, actively traded on the stock exchange platform in Singapore.

    Because it operated in a different country, the sgx nifty timings in india were followed closely by everyone. The sgx nifty time in india started hours before the local stock markets opened. This early start is exactly why the index was created in the first place. It was built to allow international investors to invest in the Indian stock market without needing to travel or register directly in India.

    Foreign portfolio investors, international institutions, and Non-Resident Indians mostly used this index. It helped them participate in the growth of top Indian companies while operating under the rules of the Singapore Exchange. The system made buying and selling much easier for those located outside India, bringing global capital closer to the domestic market.

    How Does SGX Nifty Work?

    To understand how this famous index operated, it is important to look at a few basic market concepts.

    The index simply mirrored the top 50 companies listed on the National Stock Exchange in India. When these top Indian companies performed well, this international index also showed positive growth. They were deeply connected in terms of their daily performance.

    It worked as a futures contract. This means buyers and sellers agreed on a fixed price today to buy or sell the index at a future date. This mechanism helped market participants lock in prices and reduce future investment risks without owning the actual shares.

    The stock market in Singapore opens about two and a half hours before the Indian market. Therefore, any overnight news from America or Europe reflects in Singapore first.

    Because it opened early, it absorbed all the global news and events immediately. This created an early price discovery process, giving a clear hint of whether the markets would open in profit or loss. Traders used this information to prepare for the trading day.

    Key Features of SGX Nifty

    This international index had several unique features that made it very popular among global traders.

    Key FeatureSimple Explanation
    Tracks Nifty 50 PerformanceIt directly followed the movement of the Indian Nifty 50 index, tracking the exact same top companies.
    Extended Trading HoursIt traded for almost 16 hours a day, allowing global investors to trade during their own comfortable time zones.
    International ParticipationIt provided a clear platform for global traders facing limitations in accessing the domestic Indian market directly.
    High LiquidityWith global institutions participating heavily, there were always enough buyers and sellers for smooth trading.
    USD-Denominated TradingContracts were traded in US Dollars, making it easy for foreigners to trade without worrying about currency conversion.
    Indicator of Global Market SentimentIt acted as a mirror for global feelings, rising with happy world markets and falling during international panic.

    SGX Nifty Trading Hours

    The trading hours were one of the biggest reasons for the massive success of this index globally.

    Historically, it operated from 6:30 AM to 11:30 PM Indian Standard Time. This massive window covered most of the active global day.

    Long hours mean that traders can react to news instantly. If a major event happened in the United States at night, traders could adjust their investments immediately in Singapore. This flexibility was highly valued by large institutions.

    The trading was split into different sessions. It had a morning session that covered Asian market hours and an evening session that overlapped with European and American market hours.

    The Indian market operates only from 9:15 AM to 3:30 PM. This limited time makes it hard for domestic traders to react to evening global news until the next morning.

    MarketNormal Trading Hours (IST)
    SGX Nifty6:30 AM to 11:30 PM
    Indian Nifty (NSE)9:15 AM to 3:30 PM

    Read Also: GIFT Nifty Timings: Trading Hours, Opening Time & Market Impact

    Why Was SGX Nifty Important?

    The index was highly respected in the financial world for several practical reasons.

    It worked like a morning weather report for the stock market. Traders checked it to see if the Indian market would start strong or weak.

    Any political changes, economic reports, or natural disasters that happened overnight were immediately visible in its early price movements. This provided a clear snapshot of global reactions.

    By looking at the early trends, domestic traders could plan their buying and selling actions before the Indian market even opened. This head start was crucial for daily success.

    Foreign investors used it as a safety net. If they expected a loss in their Indian investments, they could balance it by taking a smart position in Singapore to manage market risk.

    Factors That Affect SGX Nifty

    Since it was a globally traded index, it was influenced by a variety of international elements.

    FactorHow It Affects the Index
    Global Stock MarketsThe overall mood of the world economy played a huge role, with global crashes pushing this index down immediately.
    US Market PerformanceIf the United States stock markets closed in profit, this index usually opened on a positive note the next day.
    Asian Market TrendsSince Singapore is in Asia, the performance of Japanese and Chinese markets directly impacted early morning sessions.
    Crude Oil PricesIndia buys a lot of crude oil. When oil prices go up, it hurts the Indian economy, causing the index to drop.
    Currency Exchange RatesA stronger US Dollar against the Indian Rupee can pull foreign money out of India, negatively affecting the index.
    FIIs and Institutional ActivityLarge buying or selling by Foreign Institutional Investors moved the prices quickly due to the massive funds involved.
    Major Economic AnnouncementsImportant news like interest rate changes or inflation reports from major countries created instant price changes.

    How to Interpret SGX Nifty?

    Reading the index correctly requires a basic understanding of stock market openings.

    If the index is trading higher than the previous day’s closing price, it suggests that the Indian market will likely open with profits. If the index is showing a negative number in the morning, it indicates that the Indian market might open weakly or in a loss.

    A gap-up opening happens when the market opens much higher than yesterday. A gap-down opening means it opens much lower, and the index helps predict these exact jumps.

    However, the index is not a magical tool that perfectly predicts the future. Sometimes local Indian news, like a major company’s result, can completely change the market direction at 9:15 AM.

    Traders should use it only as a helpful guide. It is wise to look at actual domestic trends before investing real money.

    Advantages of SGX Nifty

    The platform offered numerous benefits to the global financial community.

    AdvantageExplanation
    Easy Access for Foreign InvestorsInternational investors could trade safely without facing the strict paperwork required to register in India.
    Better Price DiscoveryBecause it traded for a longer time, it helped find the true value of shares based on continuous global events.
    Longer Trading WindowHaving extended hours meant fewer surprises, giving investors plenty of time to enter or exit trades.
    Global Exposure to Indian MarketsIt put the Indian growth story on the global map, attracting huge amounts of foreign capital.
    Efficient Hedging ToolIt served as a brilliant tool to protect massive investment portfolios from sudden market crashes.

    Limitations of SGX Nifty

    SGX Nifty is very popular but still there are some drawbacks associated with this index, let’s have a look at these drawbacks. 

    LimitationExplanation
    Cannot Perfectly Predict Indian MarketsGlobal panic might push the index down, but strong domestic buying could reverse the trend entirely.
    Influenced by Global VolatilityThe index sometimes reacted too aggressively to international events that had little impact on Indian companies.
    Futures Premium and DiscountThe price in Singapore and the actual price in India sometimes showed small differences, confusing normal investors.
    Limited Access for Indian Retail InvestorsAverage citizens living in India were not legally allowed to buy or sell these contracts directly.
    Dependency on International SentimentIt relied heavily on the feelings of foreign investors, sometimes ignoring the actual strengths of the domestic economy.

    Can Indian Investors Trade SGX Nifty?

    This is a very common question among new traders who want to participate in early morning market movements.

    Trading was strictly limited to foreign portfolio investors, large global institutions, and Non-Resident Indians. Domestic residents were blocked from this specific market.

    Due to strict foreign exchange rules set by the government, domestic residents were banned from trading in offshore derivatives. This eligibility rule helped prevent domestic money from leaving the country unnecessarily.

    Only those entities that had international trading accounts and were based outside India could legally participate, buy, and sell these contracts.

    Even after the recent transition to the new system, standard domestic retail investors still cannot trade these international contracts directly. They can only watch the numbers to guess the market direction.

    Read Also: What is the Timing for Commodity Market Trading?

    SGX Nifty vs GIFT Nifty

    In 2023, a massive change took place in the Indian financial landscape that completely changed how this index operated.

    GIFT Nifty is the new, upgraded version of the old index. It is essentially the same product, but it is now traded within India at the NSE International Exchange located in Gujarat.

    The Indian government and stock exchanges wanted to bring trading volumes and financial power back home. Instead of Singapore earning fees from Indian products, India wanted to retain that business domestically.

    On 3rd July 2023 all trading activities were successfully shifted from Singapore to India. This was an official transition that took place without any major disruptions. 

    The main difference is the location and regulation. The old index was controlled by Singapore authorities, while the new one is regulated by Indian authorities in a special financial zone. Additionally, the new index trades for an even longer duration of almost 21 hours.

    This move boosts the Indian economy, creates local jobs, and positions India as a powerful global financial hub. It also makes trading safer and more transparent under Indian supervision.

    FeatureSGX NiftyGIFT Nifty
    Exchange LocationSingaporeGIFT City, Gujarat, India
    Operating HoursAround 16 hoursAlmost 21 hours
    Regulatory BodySingapore AuthoritiesIndian Authorities (IFSCA)
    Launch / Transition DateHistoricalJuly 3, 2023

    Conclusion

    Understanding these market indicators helps the investors to analyse the market movements and make smarter choices. While the old Singapore based index has now transformed into a domestic powerhouse, its core purpose remains exactly the same.

    It continues to provide valuable early morning clues, helping traders navigate the daily ups and downs of the financial world with better confidence. Keeping an eye on these global trends ensures that market participants are never caught off guard by overnight news.

    For more market news and insights, download Pocketful offering users zero brokerage on delivery trades and an easy to use platform designed for both beginners and experienced investors.

    S.NO.Check Out These Interesting Posts You Might Enjoy!
    1What is the Best Time Frame for Swing Trading?
    2MCX Trading: What is it? MCX Meaning, Features & More
    3What is the NIFTY EV & New Age Automotive Index?
    4What is Crude Oil Trading and How Does it Work?
    5What Is Day Trading and How to Start With It?

    Frequently Asked Questions (FAQs)

    1. What is SGX Nifty? 

      It was a futures contract that told us about the top 50 Indian companies. This was traded on the Singapore exchange which opened the option for the global investors to invest in the Indian market and companies.

    2. Is SGX Nifty different from Nifty 50? 

      Nifty 50 is the domestic index that is traded on the NSE (National Stock Exchange) during the normal market trading hours, SGX on the other hand was a financial contract that tells us about the same 50 companies but was traded in the Singapore exchange for the extended hours. 

    3. Can Indian citizens trade in SGX Nifty? 

      No, regular Indian residents were not allowed to buy or sell these contracts due to strict financial rules. People that are not resident of India and are of foreign origin can only trade. 

    4. Why was SGX Nifty moved to GIFT City? 

      The main aim for moving it to GIFT City was to bring more trading business, liquidity and financial control in India. This helped India to become a global financial center and also benefited in retaining the profits domestically.  

    5. SGX Nifty is now known as?  

      After the transition that took place on 3 July 2023, the Index was officially renamed to GIFT Nifty and was moved to Gujarat International Finance Tec-City.

  • Risk-Reward Ratio & Position Sizing in Trading Explained

    Risk-Reward Ratio & Position Sizing in Trading Explained

    Talk to ten traders about what went wrong with their last blown-up account, and nine of them will blame the stock, the news, or market manipulation. Almost none of them will blame the two things that matter how much they risked on that one trade, and whether the potential reward even justified taking it in the first place.

    That is the risk-reward ratio and position sizing for you. Nobody posts a screenshot on Twitter saying “I sized my position correctly today.” But talk to any trader who has survived in the Indian markets, and they will tell you how important these two concepts are than any indicator or strategy.

    Let us break both down properly in today’s blog.

    What is Risk-Reward Ratio 

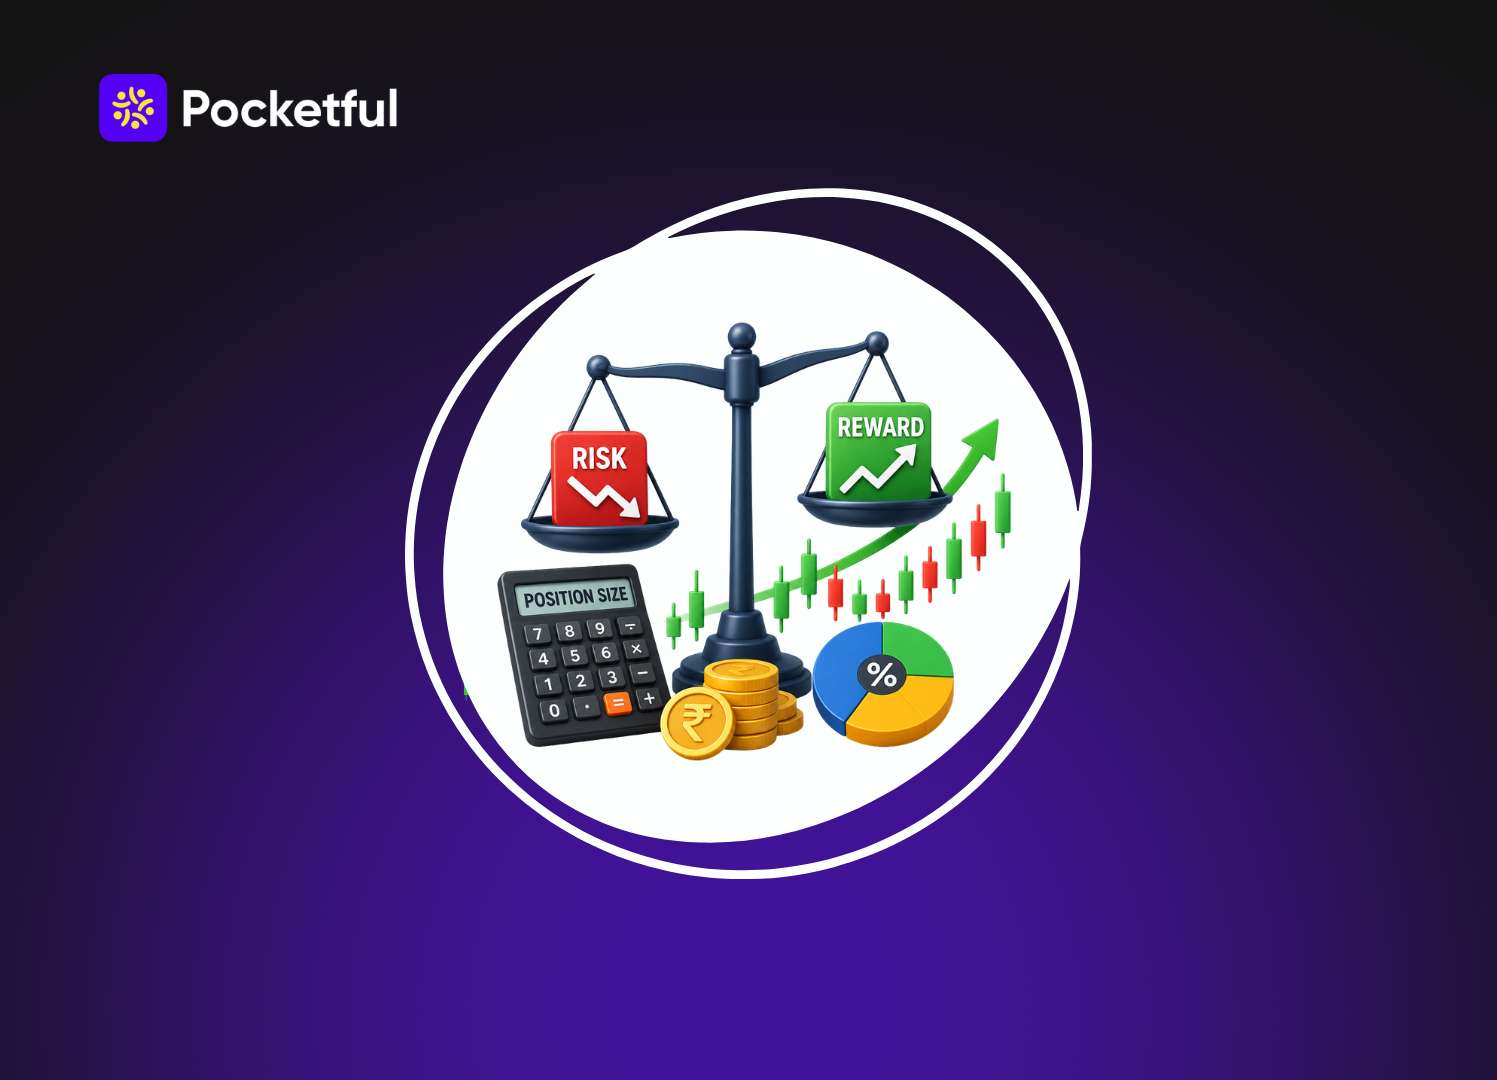
    In simple terms, risk-reward ratio compares how much you can afford to lose on a trade against how much you gain, if it goes your way.

    Say you buy ABC shares at ₹950, put your stop-loss at ₹930, and you are targeting ₹1,010. 

    Your risk here is ₹20 per share. Your reward is ₹60 per share. That is a risk-reward ratio of 1:3, which implies that for every rupee you are risking, you are chasing three rupees in return.

    You are risking ₹30 to make ₹15. That is a 2:1 ratio, which means you are risking double what you hope to earn. Even if this trade feels right, the calculation is already working against you.

    Importance of Risk-Reward Ratio 

    1. Tells you the Basic Comparison:

    Risk-reward ratio is just a comparison. How much are you willing to lose on a trade versus how much you are hoping to gain? 

    Buy Y share at ₹1,850, stop-loss at ₹1,820, target at ₹1,940, and you are risking ₹30 to make ₹90. 

    That is a 1:3 ratio, and it means the trade has room to be wrong more often than it is right.

    A good risk-reward ratio does not always mean you will win. It means you do not need to win as often to stay profitable.

    2. It Forces Discipline You Did Not Know You Needed

    The other underrated benefit is that checking your risk-reward ratio before entering a trade forces you to actually plan the trade. Where is your stop-loss? Where is your target? If you cannot answer those two questions with real price levels, you are not trading, you are gambling with extra steps.

    3. Acts as a Filter Against Emotional Decisions

    Markets test your patience constantly, especially in F&O where prices move fast, and emotions move faster. A good risk-reward ratio acts like a filter between your rational trading plan and your emotional in-the-moment decisions. 

    When you have already decided your risk and reward before entering, there is less room for panic-selling at the first red candle.

    Read Also: What is Central Pivot Range (CPR) In Trading?

    What is Position Sizing 

    Risk-reward ratio tells you if a trade is worth taking. Position sizing tells you how much of your capital to put behind it. 

    Let us say you have got ₹5,00,000 in your trading account. 

    At 2% risk per trade, you are willing to lose ₹10,000 max on any single position. 

    If you are trading and your stop-loss is ₹40 away from your entry, your position size works out like this:

    Position Size = Risk Amount / Stop-Loss Distance = ₹10,000 / ₹40 = 250 shares

    This your entire position, regardless of how confident you feel. 

    Compare this to what most retail traders in India actually do: they see a stock they like, decide “I’ll put ₹2 lakh into this,” and only then figure out their stop-loss. 

    That is position sizing backwards. You should always calculate your risk first, then size your position to match it, and never the other way round.

    Combining Both: Risk-Reward & Position Sizing 

    They work together as a system.

    A trade with excellent risk-reward but sized too large can still wipe out your account.

    A trade with perfect position sizing but poor risk-reward will just slowly bleed your capital over time

    The traders who build wealth in Indian equities and F&O over the long run are usually doing three boring things consistently:

    1. Only taking trades where the reward is at least 1.5 to 2 times the risk
    2. Never risking more than 1-2% of capital on any single trade
    3. Sticking to both rules even when they are sure about a trade 

    Common Mistakes People Make 

    • Moving the stop-loss: Trade goes against you, and instead of accepting the ₹1,000 loss you already planned for, you shift the stop-loss lower. Now that ₹1,000 loss turns into ₹3,000, and the risk-reward ratio you calculated at the start does not mean anything anymore.
    • Averaging down on losers: Stock falls below your stop, but instead of exiting, you buy more to bring down the average price. This is not position sizing anymore; it is adding risk to a trade that already told you it was wrong.
    • Revenge trading: After a loss, there is this urge to jump straight into another trade. Position sizing usually goes out the window here. People end up taking oversized positions on setups they have not even properly evaluated, 
    • Exiting winners too early: Target was ₹100 but the moment price touches ₹60, fear kicks in, and you book profit. Do this often enough, and your actual risk-reward ratio ends up nowhere close to what you planned on paper.

    What SEBI’s Data Says About This

    This is not just theory. SEBI’s own study on individual traders in the equity F&O segment found that 93% of individual retail participants ended up in losses in FY 2022-24 studied, and weak risk management was one of the recurring reasons behind it. 

    It is not that people were picking bad trades every single time. A lot of it came down to oversized positions and poor risk-reward planning turning small, manageable losses into much bigger ones. 

    Read Also: Why Option Buyers Lose Money in Trading

    Conclusion 

    The risk-reward ratio and position sizing are two important concepts of trading. There is no adrenaline in calculating 2% of your capital or checking if your target is at least double your stop-loss distance. But this calculation is exactly what separates traders who last from traders who have one good month, which is followed by a month that wipes out their entire capital.

    Before your next trade, whether it is a cash market swing trade or a Nifty options bet, ask yourself two questions. 

    Is the reward worth the risk I am taking? And is my position sized so that being wrong does not cost me more than I can afford to lose? 

    S.NO.Check Out These Interesting Posts You Might Enjoy!
    1Best Option Selling Strategy in India
    2Trade Breakouts with Options Without Overpaying IV
    3Option Buying vs Option Selling: Key Differences
    4Risk-Reward Ratio & Position Sizing in Trading
    5Supply and Demand Trading Strategy

    Frequently Asked Questions (FAQs)

    1. How much of my capital should I risk on one trade? 

      Most experienced traders stick to 1-2% of total capital per trade.  

    2. Why do most retail traders get position sizing wrong? 

      They decide the investment amount first, like “I will put ₹2 lakh into this stock”, and only figure out the stop-loss after. 

    3. Why do I keep losing money even with good risk-reward setups? 

      Usually it is execution, not the ratio itself. People plan a 1:3 trade on paper, then panic-exit at breakeven or shift their stop-loss mid-trade. The ratio only works if you actually stick to it.

    4. Should my risk-reward ratio change based on market conditions? 

      It is worth changing in choppy, sideways markets since targets are less likely to hit. In trending markets, you can afford to stretch your ratio a bit since there are high chances that price will move in your favour.

    5. Is there a tool to calculate position size quickly? 

      Yes, most broking platforms in India, including Pocketful, now have built-in position-size calculators, and it is worth using every single time.

  • What Is a Liquidity Sweep?

    What Is a Liquidity Sweep?

    Traders often observe the price breaking through a significant support or resistance level, only to reverse direction shortly thereafter. To understand such a move, it is essential to know what a “liquidity sweep” is in trading. In this article, we will explain the meaning of a liquidity sweep in simple terms, look at an example, discuss why it occurs, learn how to identify it on a chart, and highlight the mistakes to avoid while trading. This will help you better understand market movements.

    What Is a Liquidity Sweep in Trading? 

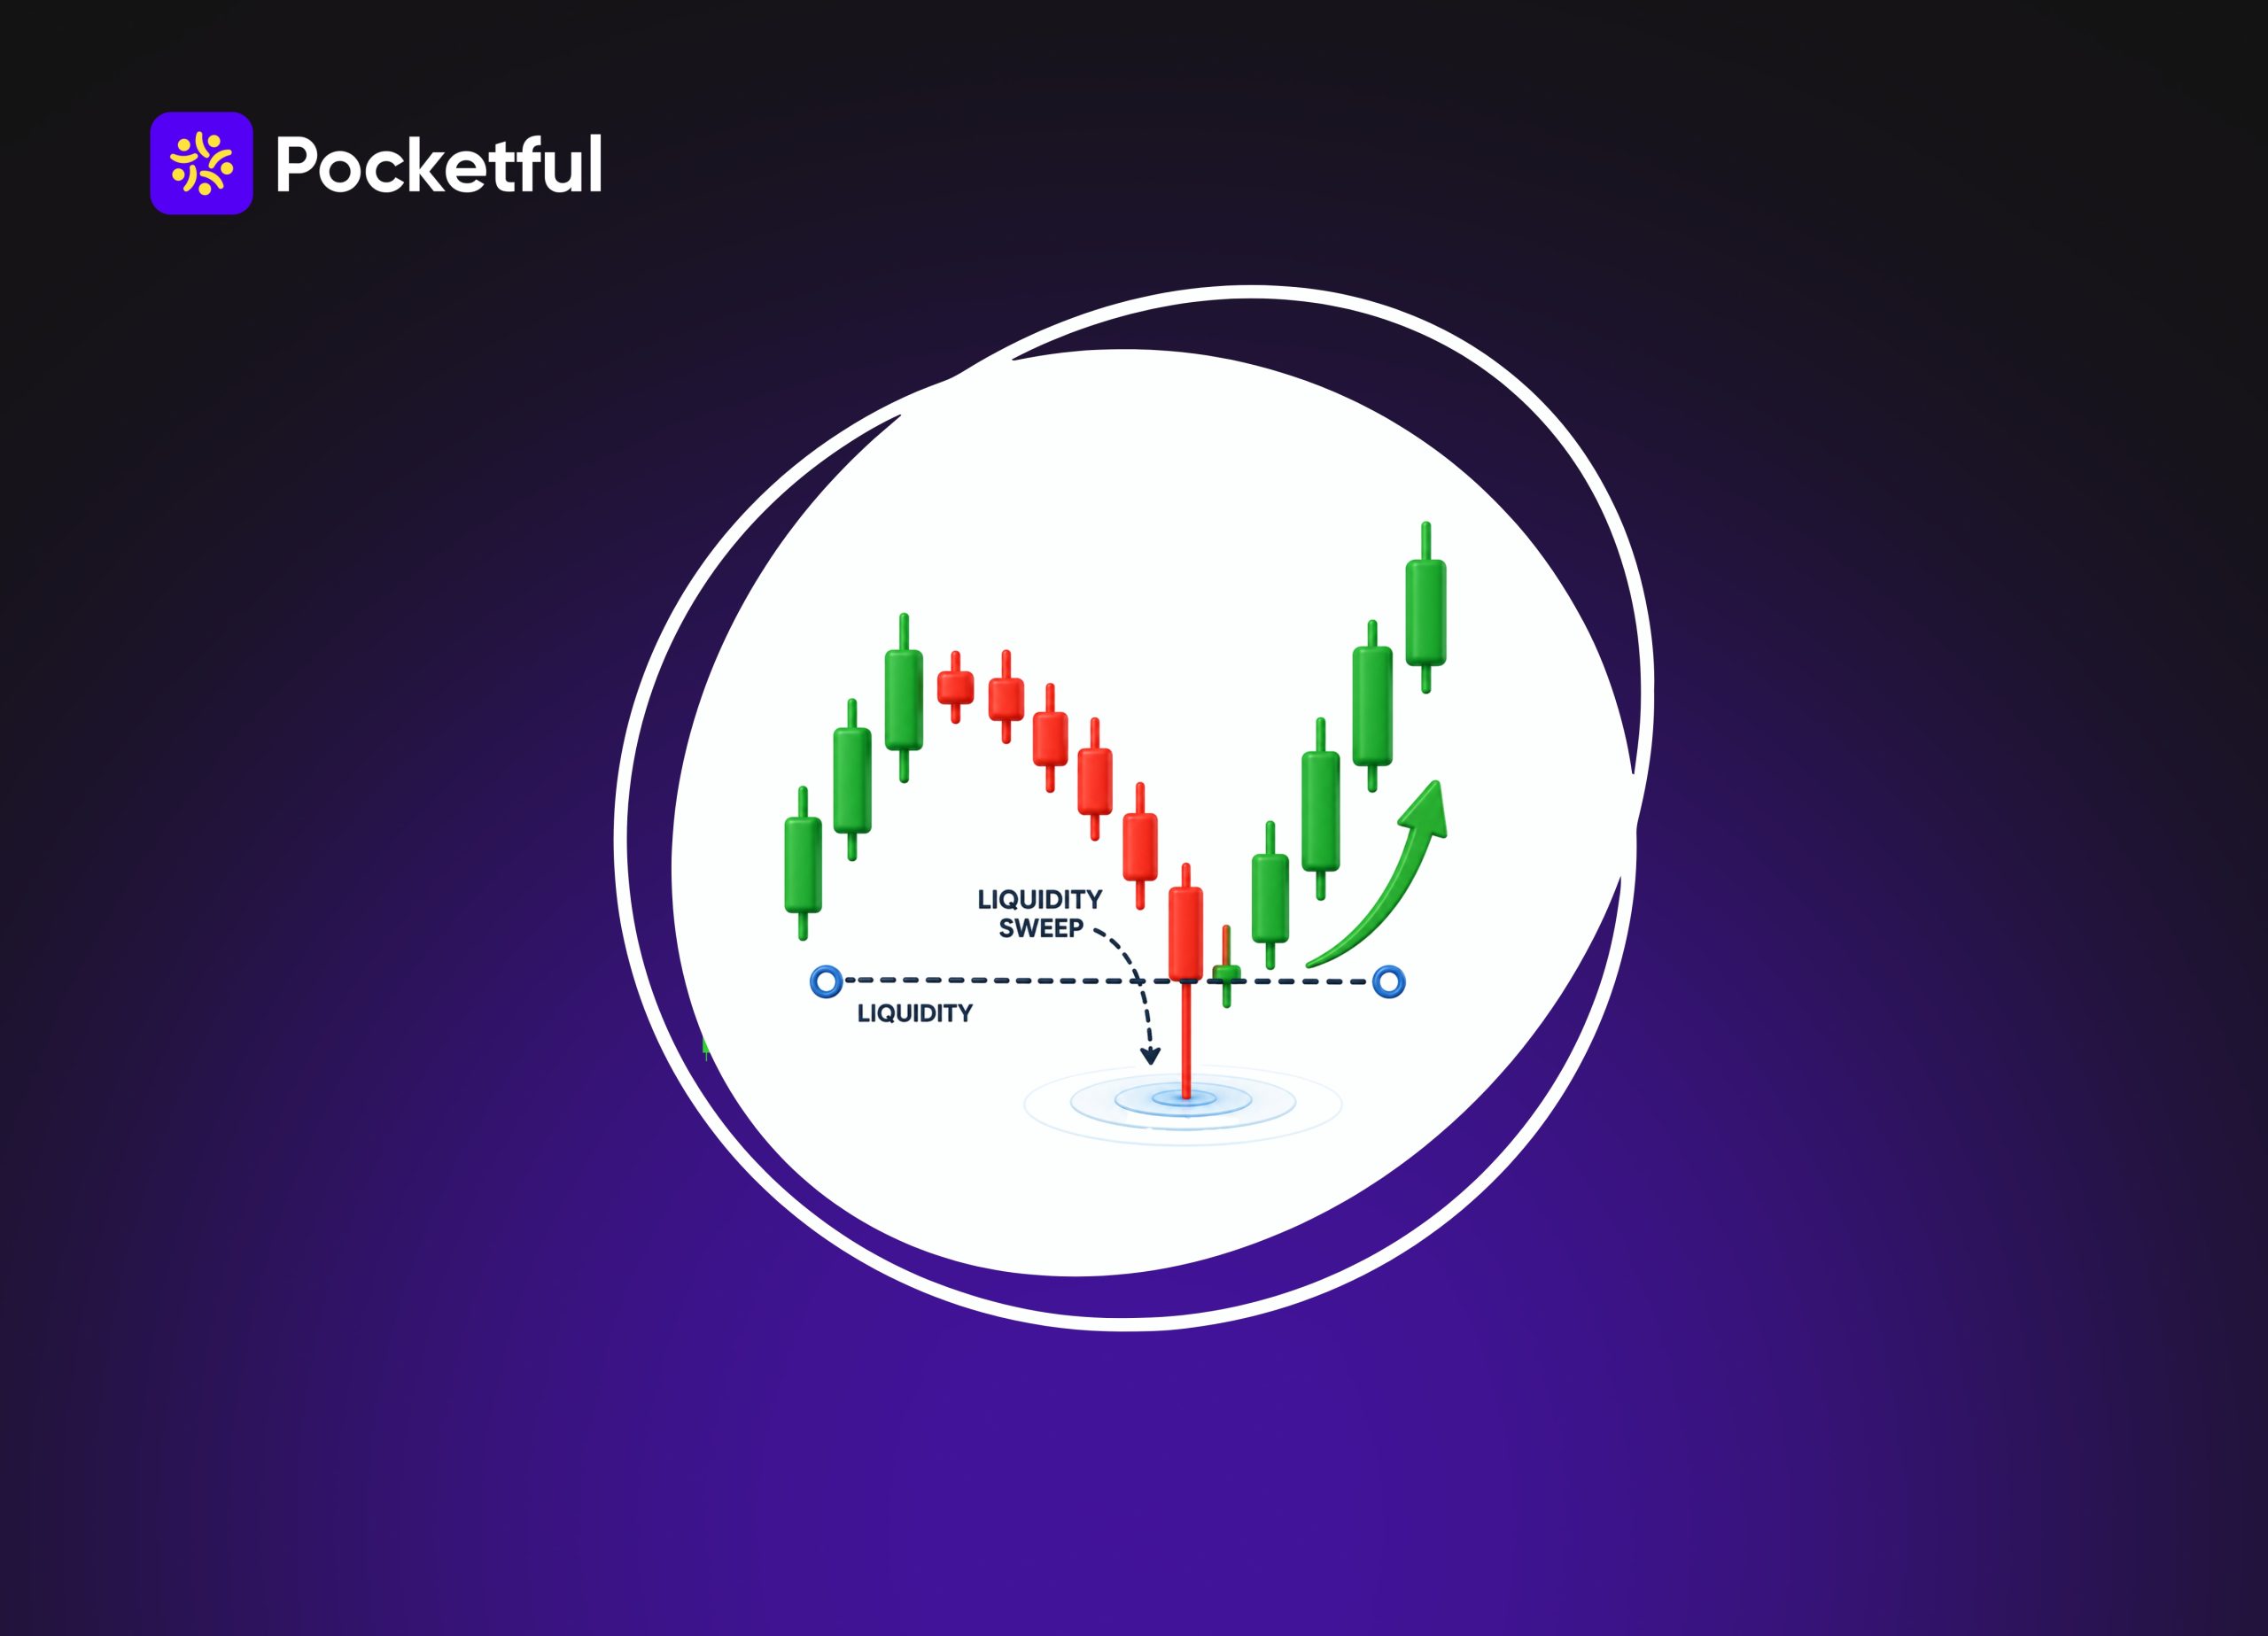
    A “Liquidity Sweep” is a price action concept in trading. It occurs when the price moves slightly above or below a significant level (such as a previous swing high, swing low, support, or resistance) to trigger the buy, sell, or stop-loss orders situated there. This process is known as a liquidity sweep. Following this, the price may continue moving in the same direction or reverse immediately.

    Meaning of Liquidity Sweep

    In simple terms, a liquidity sweep refers to the collection of liquidity (orders) present at a specific price level in the market. Here, “liquidity” refers to the buy, sell, and stop-loss orders that are clustered in large numbers around a particular level.

    Example of a Liquidity Sweep

    Suppose a stock’s previous high is ₹500. Many traders place buy orders above ₹500, while some short sellers place their stop-loss orders just above this same level. The price first rises to ₹503, triggering these orders. If the price subsequently drops back to ₹498, this serves as an example of a liquidity sweep; the price “swept” the liquidity located above the level before changing direction.

    Why Does a Liquidity Sweep Happen? 

    The primary objective of a liquidity sweep is to reach price levels where the highest volume of orders is concentrated. This is why such sweeps frequently occur around key support, resistance, and swing levels.

    • Access High-Liquidity Areas: The market often gravitates toward levels with a high concentration of buy, sell, and stop-loss orders. These zones are known as high-liquidity areas.
    • Execute Large Orders: Large market participants require substantial liquidity to fill their sizable orders. Consequently, the price sometimes moves toward levels where a large volume of orders is available.
    • Collect Clustered Stop-Loss Orders: Many traders place their stop-loss orders at similar price levels. When the price reaches these levels, multiple orders are triggered simultaneously, resulting in a surge in liquidity.
    • Test Important Price Levels: The price often briefly breaches key support or resistance levels. This helps gauge the strength of buying or selling pressure at those specific levels.
    • Facilitate Better Price Discovery: A liquidity sweep aids in matching available market orders and facilitates better price discovery for the subsequent market move. However, the direction of the market following such an event should always be confirmed through price action.

    Where Does Liquidity Usually Build? 

    Liquidity is not distributed evenly across the chart. It tends to accumulate at price levels where a large number of traders place similar entry, exit, or stop-loss orders.

    Market AreaWhy Liquidity Builds Here
    Previous Swing HighBreakout buy orders and short traders’ stop-loss orders are often present above this level.
    Previous Swing LowStop-loss and breakdown sell orders for long positions are frequently observed here.
    Equal HighsWhen the same high is formed multiple times, this level becomes a common focus for traders, leading to an increase in orders.
    Equal LowsA large number of stop-loss orders often accumulate below a low that is repeatedly tested.
    Major Support & ResistanceThese are levels where there is significant participation from both buyers and sellers; consequently, liquidity is also high.
    Psychological Round NumbersTraders often place orders at round levels such as ₹100, ₹500, ₹1,000, or ₹25,000, which increases liquidity at these points.

    Read Also: What is Pyramid Trading?

    Types of Liquidity Sweeps 

    Liquidity sweeps are primarily of two types. Both occur at distinct price levels and aid in understanding market behavior.

    1. Buy-Side Liquidity Sweep

    A buy-side liquidity sweep occurs when the price moves above a previous swing high, equal high, or resistance level areas where buy orders and stop-loss orders from short sellers are located. If the price fails to sustain itself above this level after triggering these orders and subsequently drops back down, it is considered a buy-side liquidity sweep.

    2. Sell-Side Liquidity Sweep

    A sell-side liquidity sweep occurs when the price drops below a swing low, equal low, or support level. During this movement, stop-loss orders for long positions and sell orders are triggered. If the price subsequently rebounds, it may indicate a sell-side liquidity sweep.

    3. Buy-Side vs Sell-Side Liquidity Sweep 

    Buy-Side Liquidity SweepSell-Side Liquidity Sweep
    It forms above the Swing High or the resistance level.It forms below the swing low or support level.
    It collects buy-side liquidity.It collects sell-side liquidity.
    It often appears after an upward false breakout.It often appears after a downward false break.
    Upon receiving confirmation, the price may move downwards.Upon receiving confirmation, the price may move upwards.

    Liquidity Sweep vs Liquidity Grab vs Stop Hunt 

    These three terms might seem similar, but in trading, they are used in slightly different contexts.

    Liquidity SweepLiquidity GrabStop Hunt
    Price movement occurring at a significant liquidity zone.A rapid price move that sweeps liquidity over a short timeframe.A situation where traders’ stop-loss orders are triggered.
    It is widely used in market structure analysis.It is commonly used in price action trading.It is the most widely used term in retail trading.
    After this, the trend may continue or change.Often, the move ends quickly.This is often observed during a false breakout or false breakdown.

    How to Identify a Liquidity Sweep on a Chart 

    Observing a single candle is not enough to identify a liquidity sweep; it is essential to understand price action and key levels in conjunction.

    • Mark Important Price Levels: First, mark recent swing highs, swing lows, support, and resistance levels on the chart. Liquidity sweeps often occur around these areas.
    • Watch for a Temporary Price Break: Observe whether the price moves above or below a key level for a brief period. This can be an early indication that liquidity is being collected.
    • Check the Candle Close: If the candle closes back inside the level instead of sustaining above or below it, the likelihood of a liquidity sweep increases.
    • Look for Market Confirmation: Do not trade solely based on a level break. Confirm the price’s actual direction using subsequent candles and the market structure.
    • Use Multiple Confirmations: For better decision-making, analyze the liquidity sweep alongside the trend, support and resistance levels, and other price action signals. This can help reduce the risk of entering a trade incorrectly.

    How Traders Use Liquidity Sweeps in Their Trading Strategy 

    Many traders use the “Liquidity Sweep” concept to understand market context. It is not a standalone signal for entry or exit but rather a component of a broader trading plan.

    • Finding High-Interest Trading Zones: Traders first identify price levels where market activity is likely to be high. This makes it easier to focus on significant trading zones.
    • Timing Trade Entries: Some traders wait for a setup to form after a liquidity sweep; this allows them to enter the market at the right moment rather than rushing into a trade.
    • Filtering Low-Quality Setups: Instead of trading every price break, traders can use liquidity sweeps to filter out weak setups, thereby reducing the number of unnecessary trades.
    • Building Trading Confluence: Experienced traders combine liquidity sweep analysis with factors such as trends, support and resistance, volume, or other technical indicators. Having multiple confirmations makes decision-making easier.
    • Managing Trading Risk: Insights gained from liquidity sweeps help traders determine whether the moment is right to enter a trade. This helps avoid taking positions without a clear setup.

    Is Liquidity Sweep Trading Suitable for Beginners? 

    Beginners can also learn about Liquidity Sweeps, but a basic understanding of price action and market structure is essential first. Trading based solely on this concept without proper preparation is not the right approach.

    • Learn the Basics First: Before diving into Liquidity Sweeps, it is best to learn fundamental concepts such as support and resistance, trends, and candlestick patterns.
    • Practice Before Live Trading: Practice on historical charts or a demo account first. This allows you to understand Liquidity Sweep setups without exposing yourself to real financial risk.
    • Use Charting Tools: Utilize advanced charting tools to better understand liquidity zones and price movements on the chart. For instance, advanced charts and other trading tools available on platforms like Pocketful can assist in market analysis.
    • Focus on Confirmation: Beginners should not enter a trade simply because a level has been broken. It is advisable to make a decision only after receiving confirmation.
    • Keep Risk Small: Start by practicing with a small amount of capital and limit the risk on each trade. This helps avoid significant losses while you are learning.

    Conclusion

    Understanding the “Liquidity Sweep” helps in better interpreting market behavior. It is not merely a standalone trading signal but a crucial component of price action and market structure. When combined with proper confirmation and risk management, it can assist in making better trading decisions. If you analyze charts, learning this concept will certainly prove beneficial.

    S.NO.Check Out These Interesting Posts You Might Enjoy!
    1What is the Best Time Frame for Swing Trading?
    2MCX Trading: What is it? MCX Meaning, Features & More
    3Silver Futures Trading – Meaning, Benefits and Risks
    4What is Crude Oil Trading and How Does it Work?
    5What is Spread Trading?
    6What is Tick Trading? Meaning & How Does it Work?
    7What is Algo Trading?
    8What Is Day Trading and How to Start With It?

    Frequently Asked Questions (FAQs)

    1. What is a liquidity sweep in trading?

      It is a price move that triggers orders at a significant price level.

    2. What does the liquidity sweep mean?

      A liquidity sweep means gathering liquidity in the market.

    3. Is a liquidity sweep a reversal signal?

      No, a reversal doesn’t always have to happen.

    4. How do you identify a liquidity sweep?

      Look for significant highs, lows, and confirmations along with the price.

    5. Is a liquidity sweep the same as a stop hunt?

      No, the two are related, but not always the same.

  • Closing Auction Session (CAS): Meaning, Timings & Process

    Closing Auction Session (CAS): Meaning, Timings & Process

    Determining the correct closing price in the stock market is crucial. The Closing Auction Session (CAS) was introduced for this very purpose, helping to facilitate fair price discovery before the market closes. In this article, we will explain the meaning, timings, and process of the Closing Auction Session (CAS) in simple language.

    What is the Closing Auction Session (CAS)? 

    The Closing Auction Session (CAS) is a special trading process that takes place before the stock market closes, aimed at determining a stock’s official closing price in a more fair and transparent manner. While orders are matched continuously during regular trading, in the CAS, the exchange aggregates all eligible buy and sell orders to identify the price point that allows for the maximum volume of share transactions (Maximum Executable Quantity). This price becomes the official closing price for the day. This method provides a better reflection of the market’s actual demand and supply.

    Example: Suppose the following orders were received for a company’s shares during the CAS:

    Price Buy OrdersSell Orders
    ₹4984,000 2,500 
    ₹4997,000 6,000 
    ₹50010,000 10,000 
    ₹5016,000 11,000 

    In this example, the highest volume of 10,000 shares is matched at ₹500. Therefore, the exchange will declare ₹500 as the official closing price of the share. In other words, the price selected for the CAS is the one where the highest number of buy and sell orders can be successfully matched.

    Note: In CAS, the closing price is not always the Last Traded Price (LTP). It is determined based on the price that allows for the best order matching, making the closing price more reliable and fair.

    Snapshot of Closing Auction Session (CAS) 

    ParticularDetails
    Full FormClosing Auction Session (CAS)
    Introduced BySecurities and Exchange Board of India (SEBI)
    Applicable OnEquity Cash Segment (Phase-wise Implementation)
    Initial CoverageF&O (Derivatives) Eligible Stocks
    Effective From3 August 2026
    Session Duration3:15 PM to 3:35 PM (20 Minutes After Normal Market Trading)
    Main ObjectiveFair, transparent and efficient Closing Price Discovery
    Closing Price Based OnEquilibrium Price (Maximum Matching of Buy & Sell Orders)
    Who Can Participate?Retail Investors, Institutional Investors, FIIs/DIIs and Brokers (as per exchange rules)

    Closing Auction Session Timings 

    The Closing Auction Session (CAS) takes place on every trading day from 3:15 PM to 3:35 PM. During this 20-minute period, orders are accepted and matched in various stages, and finally, the official closing price of the share is determined based on the closing price discovery process.

    Time What Happens?
    9:15 AM – 3:15 PMRegular trading sessions take place.
    3:15 PM – 3:20 PMTransition Phase, where the Reference Price is calculated and the exchange prepares for the auction.
    3:20 PM – 3:25 PMBoth Market Orders and Limit Orders can be placed, modified, or cancelled.
    3:25 PM – 3:30 PMOnly Limit Orders are allowed. Order Entry closes randomly between 3:28 PM and 3:30 PM.
    3:30 PM – 3:35 PMBuy and Sell Orders are matched, and the Official Closing Price is determined based on the auction results.

    Read Also: What is the Timing for Commodity Market Trading?

    How Does the Closing Auction Process Work? 

    Understanding the Closing Auction Session process is simple. After the market closes, this process unfolds in specific stages, culminating in the determination of the stock’s official closing price.

    Step 1: Trading Session Ends

    Regular trading concludes at 3:15 PM. Following this, the respective stocks enter the auction phase.

    Step 2: Auction Orders Are Accepted

    During the designated period, investors can place new orders and modify existing ones in accordance with the rules. This allows the exchange to gauge the actual buying and selling sentiment in the market.

    Step 3: Best Matching Price Is Identified

    Once order entry is complete, the exchange identifies the price point that facilitates the highest volume of share transactions. This is the pivotal stage of closing price discovery.

    Step 4: Trade Execution

    Eligible buy and sell orders are executed at the determined price. Subsequently, all successful trades are finalized.

    Step 5: Closing Price Is Published

    Finally, the exchange declares this price as the stock’s official closing price. This price is subsequently used in various market processes.

    Which Orders Are Allowed During CAS? 

    Order TypeAllowed?Remarks
    Limit OrderYes The most widely used order in CAS. Participation in the auction is based on this.
    Market OrderYes It is accepted only during the designated stage. It is not available thereafter.
    Stop-Loss OrderNo Stop-loss orders are not accepted in CAS.
    Iceberg OrderNo Iceberg orders are not part of the auction session.

    Why Did SEBI Introduce the Closing Auction Session? 

    SEBI introduced the Closing Auction Session (CAS) to ensure that the closing price of shares is determined more accurately and transparently, based on actual demand and supply. This strengthens the price discovery process in the market and mitigates the impact of last-minute trades on the closing price.

    • Better Price Discovery: In the CAS, all eligible buy and sell orders are matched simultaneously. This results in a closing price that allows for the execution of the maximum number of orders.
    • Greater Transparency: The auction-based process operates according to established rules. This makes the mechanism for determining the closing price clearer and more impartial.
    • Minimizing Last-Minute Price Impact: Large trades occurring just before market close could previously influence the closing price. The CAS helps reduce this impact by considering all eligible orders rather than just a single trade.
    • Better Execution for Large Orders: The CAS facilitates the efficient matching of large buy or sell orders from mutual funds, FIIs, DIIs, and other major investors, leading to more effective order execution.
    • Alignment with Global Markets: Many major stock exchanges worldwide utilize closing auctions. By implementing the CAS, the Indian stock market has been brought closer to international price discovery systems.

    Read Also: Understanding Intraday Trading Timings

    Who Will Be Most Affected by CAS? 

    The Closing Auction Session (CAS) can impact various market participants differently. Let us understand who might be affected and how.

    • Retail Investors: There will be no significant change for long-term investors. However, obtaining a more accurate closing price could lead to better valuation of their investments.
    • Intraday Traders: Intraday traders may need to adjust their exit timing and order planning slightly, as the trading process differs at the time of market close.
    • F&O Traders: The closing price is crucial for F&O traders, as it is used in the settlement process for certain contracts.
    • Mutual Fund & ETF Investors: The closing price is used to determine the NAV of mutual funds and ETFs. Improved price discovery can lead to more accurate valuations.
    • Institutional Investors: FIIs, DIIs, and other large investors can benefit from better execution of large orders and a fairer closing price.

    CAS vs Previous Closing Price Method 

    The table below shows the key differences between the old and new systems.

    Parameter Previous MethodClosing Auction Session (CAS)
    Closing Price BasisBased on the last 30 minutes VWAPBased on the final price determined in the auction
    Price DiscoveryDependent on continuous tradingDetermined by the matching of buy and sell orders.
    Price AccuracyIn some cases, the closing price could have been affected.It better reflects actual demand and supply.
    Large Orders ImpactThe impact of large orders could have been significant.The impact remains relatively balanced with the auction process.
    TransparencyBased on the standard trading processMore transparent due to the structured auction mechanism.
    Applicable StocksA uniform approach for all stocksInitially applicable only on F&O Eligible Stocks

    Conclusion

    The Closing Auction Session (CAS) represents a significant shift towards making the process of determining the closing price in the Indian stock market more transparent and fair. Understanding the process and the timing of the Closing Auction Session enables you to make better decisions at market close and trade with greater confidence under the new regulations.

    S.NO.Check Out These Interesting Posts You Might Enjoy!
    1Different Types of Trading in the Stock Market
    2How Does the Stock Market Work in India?
    320 Things to Know Before the Stock Market Opens
    4What is the Best Time Frame for Swing Trading?
    5Intraday Trading Rules and New SEBI Regulations

    Frequently Asked Questions (FAQs)

    1. What is the Closing Auction Session (CAS)?

      It is a process that takes place after market hours to determine the official closing price of a share.

    2. What is the Closing Auction Session timing?

      The CAS runs from 3:15 PM to 3:35 PM and is conducted in distinct phases.

    3. Is the Closing Auction Session applicable to all stocks?

      No. Currently, it has been implemented in a phased manner and applies initially only to F&O-eligible stocks.

    4. Can retail investors participate in CAS?

      Yes, if your broker supports this facility, you can place orders during the CAS.

    5. Why is the Closing Price Important?

      The closing price is used for NAV calculations, settlement, and various other market processes.

  • How to Use a Stock Screener for Portfolio Building

    How to Use a Stock Screener for Portfolio Building

    Choosing the right stocks in the stock market is a major challenge for many investors. Understanding how to use a stock screener for portfolio building can be very helpful. Using various filters, Pocketful Stock Screener helps you shortlist stocks according to your investment strategy. In this article, we’ll explain in simple terms how to use it correctly to build a well-balanced portfolio.

    What Is a Stock Screener? 

    A stock screener is a tool that helps you quickly find stocks based on your specific needs. By applying various filters, you can view a list of stocks from among thousands of listed companies that align with your investment strategy. This simplifies the research process and saves time when shortlisting the right companies.

    Example: If you wish to view companies with low debt and consistently rising profits, selecting the relevant filters will allow the screener to display only those stocks that meet these criteria. You can then conduct detailed research on these companies.

    How to Use Stock Screener for Portfolio Building 

    To build the right portfolio, one should use a stock screener following a systematic process. This makes it easier to shortlist companies that align with your investment strategy.

    • Start with the right screener category: First, select a category that suits your needs such as Large-Cap Stocks, High ROE Stocks, Debt-Free Stocks, or Undervalued Stocks. This generates an initial list for you.
    • Narrow down the list using relevant filters: Now, apply available filters according to your strategy to retain only those companies that align with your investment criteria.
    • Compare key company metrics: Compare returns, valuation, growth, and other available financial data for the shortlisted stocks. This makes it easier to select the best options.
    • Select stocks from diverse sectors: Instead of relying on a single sector, include companies from various sectors. This leads to a more balanced portfolio.
    • Conduct thorough research before investing: A stock screener only helps identify potential companies. Before making a final decision, be sure to examine the company’s business, financial performance, and recent updates.

    Why a Stock Screener Is Useful for Portfolio Building 

    A stock screener reduces the time required to find suitable stocks aligned with your investment strategy from among thousands of listed companies. It makes the research process more organized and simplifies the task of shortlisting the right companies for your portfolio.

    Without a stock screenerWith a stock screener
    One has to examine thousands of stocks individually.Key stocks get shortlisted in just a few minutes.
    It is difficult to compare the right companies.Comparing companies based on uniform standards becomes easier.
    Research takes more time.Initial research becomes faster and more systematic.
    Many good opportunities could be missed.Potential options aligned with your strategy are easily found.
    There is no clear process for selecting stocks.It provides a systematic start for investment.

    Explore Different Types of Stock Screeners 

    Every investor has a unique goal, so a single screener does not suit everyone. The Pocketful Stock Screener offers various categories that allow you to easily find the right stocks based on your investment strategy.

    • Fundamental Screeners: This category is useful if your focus is on strong companies. It provides ready-made screeners for Large Cap Stocks, High ROE Stocks, Debt-Free Stocks, Undervalued Stocks, and High Dividend Yield Stocks, helping to accelerate your initial research.
    • Technical Screeners: This category is beneficial for investors and traders who seek opportunities based on charts and price trends. It allows you to shortlist potential stocks based on technical indicators.
    • Candlestick Screeners: This section is helpful if you plan your entry or exit points based on candlestick patterns. It enables you to quickly find stocks exhibiting specific chart patterns.
    • Price and Volume Screeners: This screener helps identify stocks showing significant changes in price or trading volume. It can be useful for identifying active stocks during the initial screening stage.
    • Sector, Group Stocks, and Indices Screeners: This category is useful if you wish to analyze companies within a specific sector, business group, or index. It makes it easier to compare stocks within the same category and diversify your portfolio.

    Read Also: Best Free Stock Portfolio Tracker in India

    How to Choose the Right Screener Based on Your Investment Goal 

    Choosing the right screener based on your investment objectives is the first step towards finding the right stocks.

    Investment objectiveSuitable screenerWhen should you choose it?
    Building wealth over the long termHigh ROE Stocks, Consistent Compounding StocksWhen looking for companies with consistent, strong growth
    Robust and low-risk portfolioLarge Cap Stocks, Debt Free StocksWhen investing in stable and established companies
    Finding good opportunities at a low priceUndervalued StocksWhen you want to engage in value-based investing
    Receiving regular dividendsHigh Dividend Yield StocksWhen the focus is on regular income from investments
    View companies with recent outperformanceBest Quarterly ResultsWhen analyzing companies based on recent financial performance

    Step-by-Step Process to Build a Portfolio Using a Stock Screener 

    Following the right process makes it easier to build a better portfolio using a stock screener.

    Step 1: Choose the right screener

    Start with a screener like Pocketful Stock Screener,  suited to your investment goals such as those for Large-Cap, High-ROE, Debt-Free, or Undervalued stocks.

    Step 2: View the list of stocks

    Examine the stocks displayed by the chosen screener and shortlist potential companies based on your strategy.

    Step 3: Analyze the company

    Review the company profiles, financial performance, and other available information for the shortlisted stocks.

    Step 4: Compare similar companies

    Compare companies within the same sector to make it easier to select one with strong fundamentals and superior performance.

    Step 5: Build a balanced portfolio

    Create a balanced portfolio by combining selected stocks across different sectors and market capitalizations.

    What to Check Before Adding a Stock to Your Portfolio 

    Understanding a few simple points before buying any stock helps in making better decisions down the line.

    • Understand the company’s business: Before investing in a company, understand how it generates revenue. If the business model isn’t clear, it is unwise to invest simply by following others.
    • Check the earnings track record: Prioritize companies that demonstrate consistent sales and profit growth over time. Avoid making decisions based solely on one or two good quarterly results.
    • What is the debt burden: Having debt isn’t necessarily bad for a company, but excessive debt can create future financial strain. Therefore, it is essential to examine this aspect.
    • What has changed recently: Events such as new announcements, major orders, management changes, or quarterly results can directly impact a company. It is advisable to check for such updates before investing.
    • Price matters too: A good company shouldn’t necessarily be bought at any price. Always assess whether the current price is reasonable for your investment.

    How to Keep Your Portfolio Diversified 

    A good portfolio is one where not every stock plays the same role.

    • Avoid concentrating all your capital in a single theme: If most of your stocks belong to the same industry, adverse news regarding that sector could impact your entire portfolio. It is wiser to include companies operating in diverse business areas.
    • Vary the size of the companies: Large companies often offer stability, whereas smaller companies may hold the potential for rapid growth. Combining both ensures your portfolio does not rely on a single direction.
    • Limit stocks with similar business models: Two companies may have different names, yet their business operations could be nearly identical. Holding too many such stocks increases the number of holdings without actually enhancing diversification.
    • Leave room for new opportunities: If all your capital is already invested, it may be difficult to capitalize on attractive opportunities that arise later. Therefore, it is advisable to set aside a portion of funds for future investments.
    • Do not neglect your portfolio: Sometimes, a stock may appreciate beyond expectations, causing it to occupy a disproportionately large share of the portfolio. In such instances, rebalancing the portfolio is a prudent move.

    Read Also: How to Build a Portfolio With Exchange-traded Funds (ETFs)

    How to Get Started with Pocketful Stock Screener

    Getting started with the Pocketful Stock Screener is simple. Follow these steps to find stocks that match your investment strategy:

    Step 1: Start the Pocketful Stock Screener

    Log into your Pocketful account and go to the Stock Screener page.

    Step 2: Select a Pre-Built Screener

    Select from pre-built screeners such as Large Cap Stocks, High ROE Stocks, Debt-Free Stocks, Undervalued Stocks or High Dividend Yield Stocks, depending on your investment objective.

    Step 3 : Filter on relevance

    Use filters like market cap, valuation, profitability, debt or technical indicators to refine your search and come up with a list of stocks that fit the bill.

    Step 4: Compare and Analyze Stocks
    Review key financial metrics, compare companies within the same sector, and evaluate their business performance before making a decision.

    Step 5: Build and Monitor Your Portfolio
    Shortlist your preferred stocks, create a diversified portfolio, and revisit the screener regularly to discover new investment opportunities.

    Common Mistakes While Using a Stock Screener 

    Minor errors can turn even good stocks into poor investment choices.

    • Applying all filters at once: Many people apply too many filters simultaneously. This can cause good companies to be excluded from the results. Start with fewer filters and add more as needed.
    • Relying solely on screener results: A screener helps identify stocks but does not make the final decision for you. Before investing in any company, make sure to understand its business and recent performance.
    • Comparing incompatible companies: Every company operates in a different sector and line of business. Therefore, instead of comparing a bank with an IT or FMCG company, base your decisions on comparisons between companies within the same industry.
    • Ignoring current market conditions: Even good stocks can be affected by market conditions. So, alongside using a screener, keep an eye on current market trends and significant news.
    • Changing screeners instead of the strategy: Stick to your investment strategy rather than trying out a new screener every few days. Constantly changing your approach can make it difficult to select the right stocks.

    Conclusion

    A stock screener helps you spot the right companies, but great investing always comes down to good judgment. When you combine a screener with your own strategy and do solid research first, building a strong, balanced portfolio gets a lot easier. 

    S.NO.Check Out These Interesting Posts You Might Enjoy!
    1Mutual Fund vs ETF. Are They Same Or Different?
    2What are ETFs? Are ETFs good for beginner investors?
    3ETF vs Index Fund: Key Differences You Must Know
    4How to Invest in ETFs in India – A Beginner’s Guide
    5What is Nifty BeES ETF? Features, Benefits & How to Invest?

    Frequently Asked Questions (FAQs)

    1. What is a stock screener?

      It’s a tool that helps you quickly shortlist stocks based on your preferences.

    2. Can beginners use a stock screener?

      Yes, even beginning investors can use it to find stocks better.

    3. Does a stock screener guarantee profitable stocks?

      No, it only helps you find stocks. Make investment decisions only after doing your research.

    4. Which filters should I use for long-term investing?

      You can start with filters like High ROE, Debt Free, and Large Cap.

    5. How often should I use a stock screener?

      Use it whenever you need to find new investment opportunities or review your portfolio.

  • Global Index vs Indian Index: Key Differences

    Global Index vs Indian Index: Key Differences

    Have you ever wondered how people know if the stock market is doing well? A stock market index acts like a thermometer for the financial world. It tracks a specific group of stocks to show how the broader market is performing.

    Investors monitor these market indices to understand trends and check the health of the economy. Lately, there is a growing interest in both Indian and international markets. People want to find new growth opportunities beyond our borders.

    By tracking different markets, you can build a balanced portfolio and reduce your financial risk. When comparing a Global Index vs Indian Index, you will see how each offers unique benefits to help grow your wealth.

    What is a Stock Market Index?

    A stock market index is a tool that measures changes in the stock market. It groups similar companies based on their size or industry. This makes it easy for you to track a section of the economy without watching every single stock.

    Most modern indices are calculated using a free float market capitalization method. This means the index value depends only on shares available for public trading. Shares held by promoters or the government are not counted. Naturally, bigger companies have a bigger impact on the final index value.

    Stock market indices matter because they act as a benchmark. Fund managers use them to see if their mutual funds are performing well. For you, they help show the general mood of the market at a glance.

    What is a Global Index?

    A Global Index tracks companies listed in international markets. It gives you a quick snapshot of how foreign economies and big multinational businesses are doing.

    A key feature is that it includes many different businesses across various countries. This spreads your risk so you do not depend on just one country. These indices are also valued in foreign currencies like the US Dollar or Euro.

    Tracking global indices is important to understand international trends. They also serve as a benchmark for international funds. Some of the most famous global stock market indices include the S&P 500, Nasdaq Composite, Dow Jones, and FTSE 100. 

    What is an Indian Index?

    An Indian Index tracks companies listed on the domestic exchanges, like the National Stock Exchange and Bombay Stock Exchange. It acts as a direct mirror of our own financial landscape as they measure how our domestic stock market and local economy are performing.

    Indian Index tracks companies operating mostly in India. They reflect our economic growth and are valued entirely in Indian Rupees. This index helps investors to understand the mood of the domestic market on a daily basis. Experts and retail investors use them to guide and make decisions about their domestic investments.

    The most popular indexes used by the investors in India are Nifty50, Sensex, Nifty Bank, and NiftyIT. 

    Global Index vs Indian Index

    Understanding the differences between the domestic and international index is very important for the investors. It allows them to spread their investments and to build a diverse portfolio. 

    ParameterGlobal IndexIndian Index
    MeaningTracks the performance of companies listed in international markets.Tracks the performance of companies listed on Indian stock exchanges.
    Market CoveredGlobal or specific foreign markets.Domestic Indian stock market.
    ExamplesS&P 500, Nasdaq Composite, FTSE 100, Dow Jones.Nifty 50, Sensex, Nifty Bank, Nifty IT.
    Companies IncludedForeign companies located outside India like Apple and Amazon.Indian companies like Reliance Industries and HDFC Bank.
    CurrencyUSD, GBP, JPY, EUR, or other local international currencies.Indian Rupees (INR).
    Main PurposeMeasures international market performance and global trends.Measures the performance of the Indian stock market and economy.
    Key Influencing FactorsUS Federal Reserve decisions, global inflation, and oil prices.Indian economic state, RBI policies, and domestic inflation.
    Suitable ForInvestors seeking international exposure and geographical diversification.Investors focused strictly on the domestic Indian market.

    Top Global Indices vs Major Indian Indices

    • S&P 500 vs Nifty 50: The S&P 500 tracks the biggest 500 companies of the USA which covers about 80% of their market. Nifty 50 on the other hand tracks the 50 biggest companies of India. S&P is mainly concentrated with companies related to the technology sector, while Nifty50 mostly has companies related to the banking and financial sector. 
    • Nasdaq Composite vs Nifty IT: The Nasdaq Composite covers companies that are global giants like Apple and Microsoft, this composite includes approximately 3000 stocks in it. Nifty IT is much smaller compared to Nasdaq and it only tracks the top Indian Tech service based companies like TCS and Infosys. 
    • Dow Jones vs Sensex: The Dow Jones tracks 30 big US companies using a price weighted method. The Sensex tracks 30 well established Indian companies on the Bombay Stock Exchange. However, it uses the free float method.
    • FTSE 100 vs Nifty 50: The FTSE 100 tracks the 100 major companies of London. Many are global firms that make money all over the world. The Nifty 50 focuses on Indian companies driven mostly by our local economy and consumption.

    Factors That Influence Global Stock Indices

    • Interest Rate Decisions: The change in the interest rates by the central banks like the US Federal Reserve directly impacts the borrowing rates. If the rates are pushed upwards the global stock prices fall. 
    • Inflation Data: Rising prices can lower stock values. This happens because companies face higher production costs.
    • GDP Growth: Strong economic growth shows better consumer demand worldwide. This boosts confidence in investors and the global markets.
    • Corporate Earnings: The profits made by a global giant directly affects the index values. 
    • Geopolitical Events: Conflicts, trade wars, or political tensions have direct correlation with the disruption of global trade. These events often cause sudden market drops.
    • Currency Movements: A strong US Dollar can affect the profits of US companies making money overseas.
    • Commodity Prices: Changes in gold and crude oil prices impact global inflation. This affects corporate profits around the world.

    Read Also: ETF vs Index Fund: Key Differences

    Factors That Influence Indian Stock Indices

    • RBI Monetary Policy: Interest rate changes by the RBI affect borrowing costs for Indian businesses. This directly impacts their profits.
    • Government Budget: Policies and taxes announced in the Union Budget are big triggers for local stocks.
    • FII and DII Investments: The buying and selling by foreign and domestic institutions guide the market. Their large investments give our market clear direction.
    • Rupee Exchange Rate: A weaker Rupee makes imports expensive. However, it helps export sectors like Information Technology.
    • Corporate Earnings: Profits from large Indian companies dictate the mood of the index. Big companies like Adani, Reliance and HDFC Bank can push the whole market in a positive direction. 
    • Domestic Economic Growth: India’s GDP and people demand in the rural area is the key driver of the index. Good numbers put a positive impact on the domestic market. 
    • Inflation and Interest Rates: Rising inflation makes the central bank of India keep interest rates high. This slows down corporate expansion and market growth.

    How Global Markets Impact Indian Markets

    We often see our markets react to Wall Street. US Market Influence on Indian Markets is very visible. If US markets fall, Indian markets usually open lower the next day. This happens because investor feelings shift quickly across borders.

    The Impact of Federal Reserve Decisions is also very strong. When the US raises interest rates, foreign investors might take money out of India to invest in safer US assets. This selling puts heavy pressure on our local stocks.

    The Dollar Index (DXY) and Rupee Movement play a critical role too. A strong US Dollar usually weakens the Indian Rupee. This makes importing goods more expensive for us and drives up domestic inflation.

    The Effect of Crude Oil Prices is something we cannot ignore. We import a lot of crude oil. High oil prices cause inflation and hurt the profits of our manufacturing companies.

    Foreign Institutional Investors (FIIs) dictate a lot of movement in India. Bad global economic news often leads to heavy selling by FIIs. This directly pulls down major indices like the Nifty 50.

    Lastly, Global Economic Slowdowns and Their Effect on India are significant. A global slowdown reduces the demand for our exports. This hurts sectors like IT and pharma that rely on international clients.

    Benefits of Tracking Global Indices

    • Better Market Awareness: It helps you predict shifts in our domestic stocks. It acts like an early warning system.
    • International Diversification: It is the first step to spreading your investments across different countries. This reduces your dependence on a single economy.
    • Understanding Global Economic Trends: They show which industries are doing well worldwide. You get to see the big picture.
    • Identifying Overseas Investment Opportunities: You can spot high growth sectors. Themes like artificial intelligence might not be fully available in the Indian market yet.

    Benefits of Tracking Indian Indices

    • Understand Domestic Market Trends: They give a clear picture of our country’s economic progress. They show how healthy our domestic businesses are becoming.
    • Benchmark Mutual Fund Performance: You can check if your mutual funds are performing better than the overall market.
    • Better Investment Decisions: Tracking different sectors helps you see which parts of the economy are leading. It shows if banking or IT is currently doing well.
    • Suitable for Long-Term Wealth Creation: It helps you focus on long term growth. You can avoid getting distracted by daily news.

    Read Also: GIFT Nifty vs Nifty 50: Key Differences

    Common Mistakes Investors Make While Comparing Global and Indian Indices

    • Comparing returns without considering currency fluctuations: An international index might show huge gains. However, currency changes can lower your actual returns when converted to Rupees.
    • Ignoring sector composition: The S&P 500 is tech heavy, while the Nifty 50 focuses on banks, comparing them is not feasible as there is a very major difference.
    • Assuming one index predicts another: A rise in a global index does not guarantee the Indian market will go up on the same day. Local factors always play a big role.
    • Overlooking valuation differences: Developed and emerging markets trade at different values. This is based on their unique risks and growth rates.
    • Chasing short-term global trends: Moving money just because a foreign market rallied is risky. It can disrupt your carefully planned long term strategy.

    Conclusion

    Both global and domestic indices have a special place in a smart financial strategy. A global index gives you exposure to international brands and spreads your risk. On the other hand, an Indian index captures the massive potential of our growing economy. Understanding how they work together helps you build a strong portfolio. This knowledge will guide you toward smarter and more confident financial choices.

    For more market news and insights, download Pocketful – offering users zero brokerage on delivery trades and an easy to use platform designed for both beginners and experienced investors. 

    S.NO.Check Out These Interesting Posts You Might Enjoy!
    1Mutual Fund vs ETF. Are They Same Or Different?
    2Difference Between Gold ETF and Silver ETF
    3ETF vs Stock – Which One is the Better Investment Option?
    4Gold ETF vs Gold Mutual Fund: Differences and Similarities
    5ETF vs FOF: Key Differences

    Frequently Asked Questions (FAQs)

    1. Can Indian investors directly buy a global index?

      You cannot directly buy a global index. However, you can invest in international mutual funds or global ETFs that track these indices.

    2. Which is better for long term investing, global or Indian index?

      Both serve different purposes. An Indian index offers high growth potential in a developing economy. A global index provides geographical diversification and exposure to international brands.

    3. Why does the US Dollar Index affect the Indian market?

      A rising US Dollar Index generally leads to a weaker Indian Rupee. This increases the cost of imports like crude oil, which can drive up domestic inflation.

    4. Is the Nifty50 different from S&P 500?

      Yes, Nifty50 tracks the biggest 50 Indian companies that generally includes companies from the banking and financial sectors. On the other hand S&P 500 tracks the 500 biggest companies of the US that majorly deals in the tech sector.  

    5. Do global indices carry currency risk?

      Yes, they do. Since global indices are measured in foreign currencies, your investments are subject to exchange rate changes. This can impact your final returns.

  • Open Free Demat Account

    Join Pocketful Now

    You have successfully subscribed to the newsletter

    There was an error while trying to send your request. Please try again.

    Pocketful blog will use the information you provide on this form to be in touch with you and to provide updates and marketing.