When it comes to the markets, there are two primary approaches: technical analysis and fundamental analysis. While fundamental analysis focuses on evaluating the intrinsic value of an asset, technical analysis studies price movements through charts and patterns. Among various technical approaches, price action stands out for its simplicity and effectiveness, as it emphasizes understanding raw price movements without relying on complex indicators.
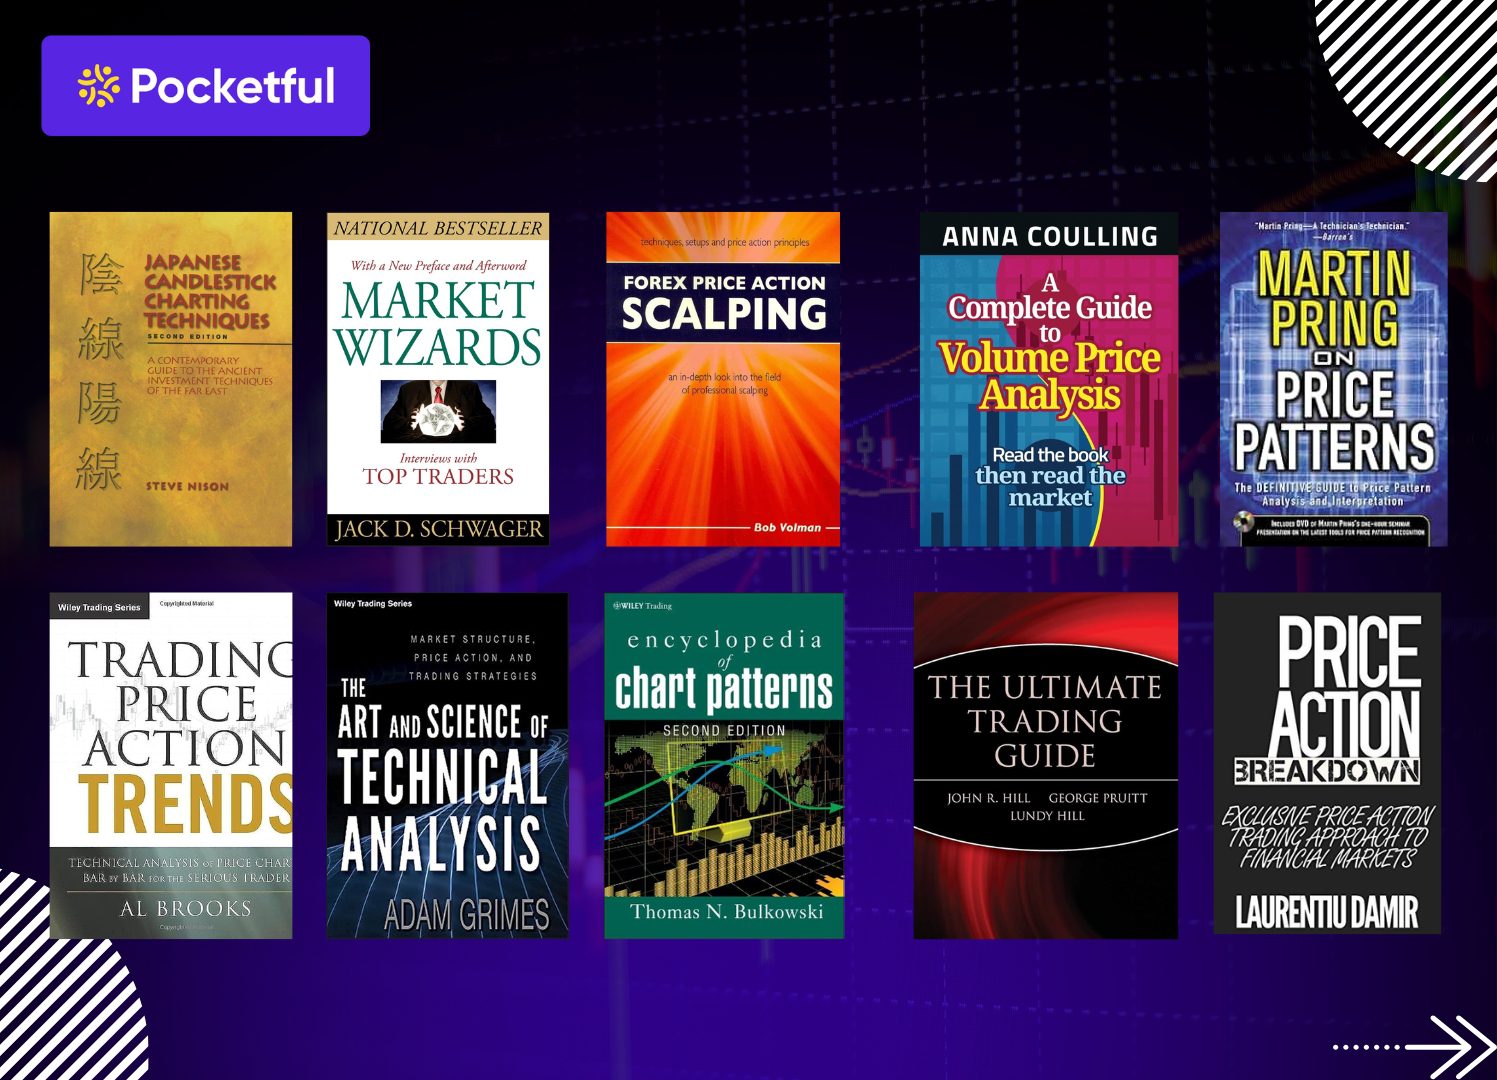
In this blog, we will give you an overview of the top 10 best price action trading books.
What is Price Action?
Price action is a study of price movements of a stock plotted over time, and traders make decisions based on these historical price movements. The traders who trade based on the price action focus more on chart patterns, candlesticks, trendlines, support and resistance, etc. Traders and analysts who use price action examine key elements such as:
- Chart patterns (like triangles, flags, or head-and-shoulders) to predict potential market direction.
- Candlestick formations, which provide insight into market psychology (e.g., bullish/bearish reversals).
- Trendlines, which help identify whether the market is trending upward, downward, or moving sideways.
- Support and resistance levels, which indicate where the price is likely to pause, reverse, or break out.
By interpreting these, traders get an idea about the market sentiment directly from price movements.
10 Best Price Action Trading Books
| Book Title | Author | Year | Goodreads Rating |
|---|---|---|---|
| Martin Pring on Price Patterns | Martin J. Pring | 2004 | 4.14 |
| A Complete Guide to Volume Price Analysis | Anna Coulling | 2013 | 4.24 |
| Forex Price Action and Scalping | Bob Volman | 2011 | 4.13 |
| The Market Wizards | Jack D. Schwager | 1989 | 4.25 |
| Japanese Candlestick Charting Techniques | Steve Nison | 1991 | 4.31 |
| Trading Price Action Trends | Al Brooks | 2011 | 4.06 |
| The Art and Science of Technical Analysis | Adam Grimes | 2012 | 4.23 |
| Encyclopedia of Chart Patterns | Thomas Bulkowski | 2000/05 | 4.09 |
| The Ultimate Trading Guide | John R. Hill | 2000 | 3.25 |
| Price Action Breakdown | Laurentiu Damir | 2015 | 4.2 |
Overview of Best Price Action Trading Books
An overview of the best price action trading books is given below:
1. Martin Pring on Price Patterns
This book was written by Martin J. Pring in 2004. It is a comprehensive guide that explains the steps to use price patterns, such as head and shoulders, triangles, etc. Pring was a renowned technical analyst, and with his extensive experience, he wrote this book, which has helped many traders. In his book, he has covered all the relevant topics such as support and resistance, trendlines, etc. Martin Pring explains the formation of these patterns and the method to use them effectively.
What will you learn?
- A trader will learn to identify and analyse different patterns like double top, head and shoulder, etc.
- Entry and exit points based on the patterns.
- Combining the price with the volume and moving average.
- Reliability of patterns and failure indicators.
2. A Complete Guide to Volume Price Analysis
This book was written by Anna Coulling and was published in 2013. This book explains the concept of volume price analysis, which combines the volume and price movement of a stock to identify its strength of bullish or bearish market moves. This book helps a trader in identifying false breakouts and improving their decision-making. It offers the trader a practical way to understand the market moves without relying on indicators.
What will you learn?
- How the market moves can be predicted using price and volume.
- Using volume signals to identify buying and selling pressure.
- Using volume confirmation to identify a false breakout.
- Understanding the various phases of the market, such as accumulation and distribution.
3. Forex Price Action and Scalping
The book was published in 2011 and was written by Bob Volman. This book is suitable for traders who are interested in manual scalping and want to do scalping in a short time frame. They are preferred by the traders who generally trade in the currency segment. However, the book also focuses on proper risk management.
What will you learn?
- Techniques for scalping based only on price movement.
- How to take a trade based on a 5-minute chart pattern.
- Real chart pattern examples along with a detailed explanation of it.
- Strategies for fast entry and exit in forex trades.
4. The Market Wizards
The author of the book was Jack D. Schwager, and the book was first published in 1989. This book details the in-depth interviews of the most successful traders of that time. Those traders made their fortune in different market segments, including stocks, forex, commodities, etc. The major takeaways of the book are risk management, patience and discipline. The book is in conversational form. All traders seek inspiration from this book.
What will you learn?
- Perspective of successful traders.
- The psychological traits required for trading price action.
- Risk management techniques.
- How to modify their trading strategies based on changing market dynamics.
5. Japanese Candlestick Charting Techniques
The book was first published in 1991 and was primarily focused on the usage of candlestick patterns in the modern trading world. The author of the book is Steve Nison. This book can be a foundation for traders who want to learn the art of candlestick patterns and how they can reveal market segments. This book navigates a trader from basic to advanced usage of chart patterns. It covers numerous candlestick patterns and how to combine them with other technical tools.
What will you learn?
- The evolution and importance of the candlestick pattern.
- How to use a candlestick pattern along with other technical tools.
- Understanding the psychology of the market, which influences candlestick formation.
- Detailed explanation of reversal and continuation patterns with examples.
6. Trading Price Action Trends
This series of books was first published in 2011 and was written by AL Brooks. This book is not suitable for beginners, as it is highly technical. The techniques presented in this book are applicable across all time frames. The book is based on identifying the trading ranges and their breakouts and helps a trader in finding out the false breakouts. This book presents a systematic and detailed approach to analysing every candlestick pattern.
What will you learn?
- One to five-minute charts are used for analysis of small price action.
- Recognising patterns, breakouts and reversals.
- Deep analysis of price structure, without studying volume.
- Calculating the support and resistance levels
7. The Art and Science of Technical Analysis
The book “The Art and Science of Technical Analysis” was written by Adam Grimes and was published in 2012. The book primarily focused on a data-driven approach to studying technical analysis and price action. The author was a successful trader and has traded for various proprietary firms, hedge funds, etc. The book stresses the importance of stop loss and target. Adam Grimes explains what works in the market and what does not, and the importance of removing guesswork from the price analysis.
What will you learn?
- The reason behind the changes in market price.
- Recognition of pattern by statistical analysis.
- Duration of the effectiveness of the price trend.
- Practical and realistic trading strategies.
8. Encyclopedia of Chart Patterns
This book was first written and published in 2000, and in 2005, its second edition was published. The book focuses on statistical and visual examples of chart patterns. In this book, almost every trading chart pattern is included. This book is generally used by swing and positional traders. This visual book is suitable for traders who wish to understand the real reasons behind every pattern. The writer of the book, Thomas Bulkowsky, shows the success and failure rate, and the average returns of different candlestick formations.
What will you learn?
- Failure and success rate of the candlestick pattern.
- How to trade and handle trades based on each pattern.
- Finding rare and potential formations.
- A comprehensive collection of performance statistics and chart patterns.
9. The Ultimate Trading Guide
This book was written by John R. Hill and was published in 2000. The book combines the trend-following strategy and technical analysis, followed by effective money management strategies. The book teaches traders to build their strategies using effective techniques. It introduces the method to develop, test and trade complex and structured strategies considering the price behaviour of the market.
What will you learn?
- How to use quantitative price action techniques.
- Establishing and evaluating a trading system.
- Understanding both the psychological and technical aspects of trading.
- Analysing the chart to understand the entry and exit points.
10. Price Action Breakdown
Price Action Breakdown was written by Laurentiu Damir and was published in 2015. In this book, the author focuses on a simplified and practical approach to trading based on price action. The book primarily focuses on the foreign exchange (forex) market and introduces an approach that emphasizes the analysis of market movement, structure, and the psychology behind it. The book explains how to identify important levels and execute trade setups based on it.
What will you learn?
- Basic price action concepts made easy for beginners.
- Key strategies using important price levels.
- How to analyse support and resistance levels, trends, etc.
Read Also: Best Stock Market Traders in the World
Conclusion
On a concluding note, various traders have shared their experiences and successful strategies in different books written by them. Those price action trading books help new traders in refining their strategies without relying on too many indicators. No matter whether you are an experienced or a novice trader, these books help you in building a strong foundation, and by reading them, you can create a trading strategy that suits your trading style. However, it is advised to consult your investment advisor before executing any trades.
Frequently Asked Questions (FAQs)
What is the meaning of price action trading?
Price action trading is an approach that involves analyzing and making decisions based on historical price movements, often using candlestick patterns, chart structures, and key price levels.
Can I start trading by reading the best price action trading books?
Yes, one can learn the art of price action trading by reading the best price action trading books. However, it is advisable to consider your risk profile, trade by keeping a stop-loss and only after consulting your investment advisor.
Is price action trading useful only in forex trades?
No, price action trading is effective in different market segments such as equity, commodities, forex, etc.
What are some of the best price action trading books?
The best price action trading books are Martin Pring’s on Price Patterns, A Complete Guide to Volume Price Analysis, Price Action Breakdown, etc.
What is scalping?
Scalping is a trading approach in which the trader quickly takes entry and exits from trading positions in large quantities and tries to take advantage of small price movements.