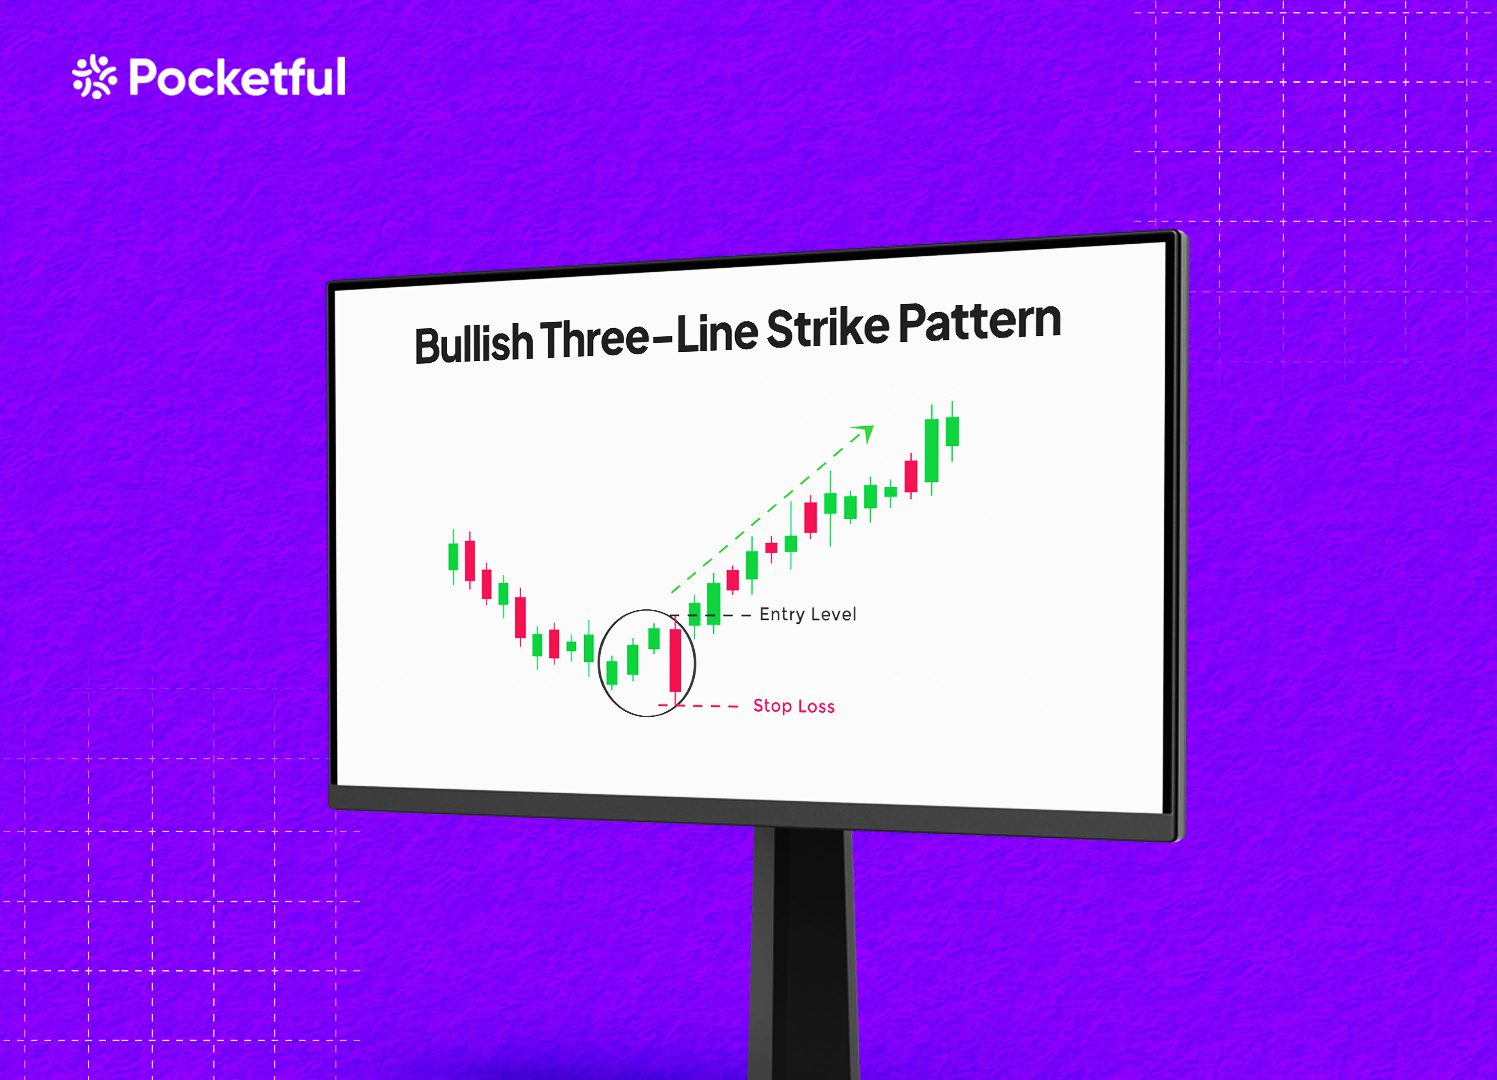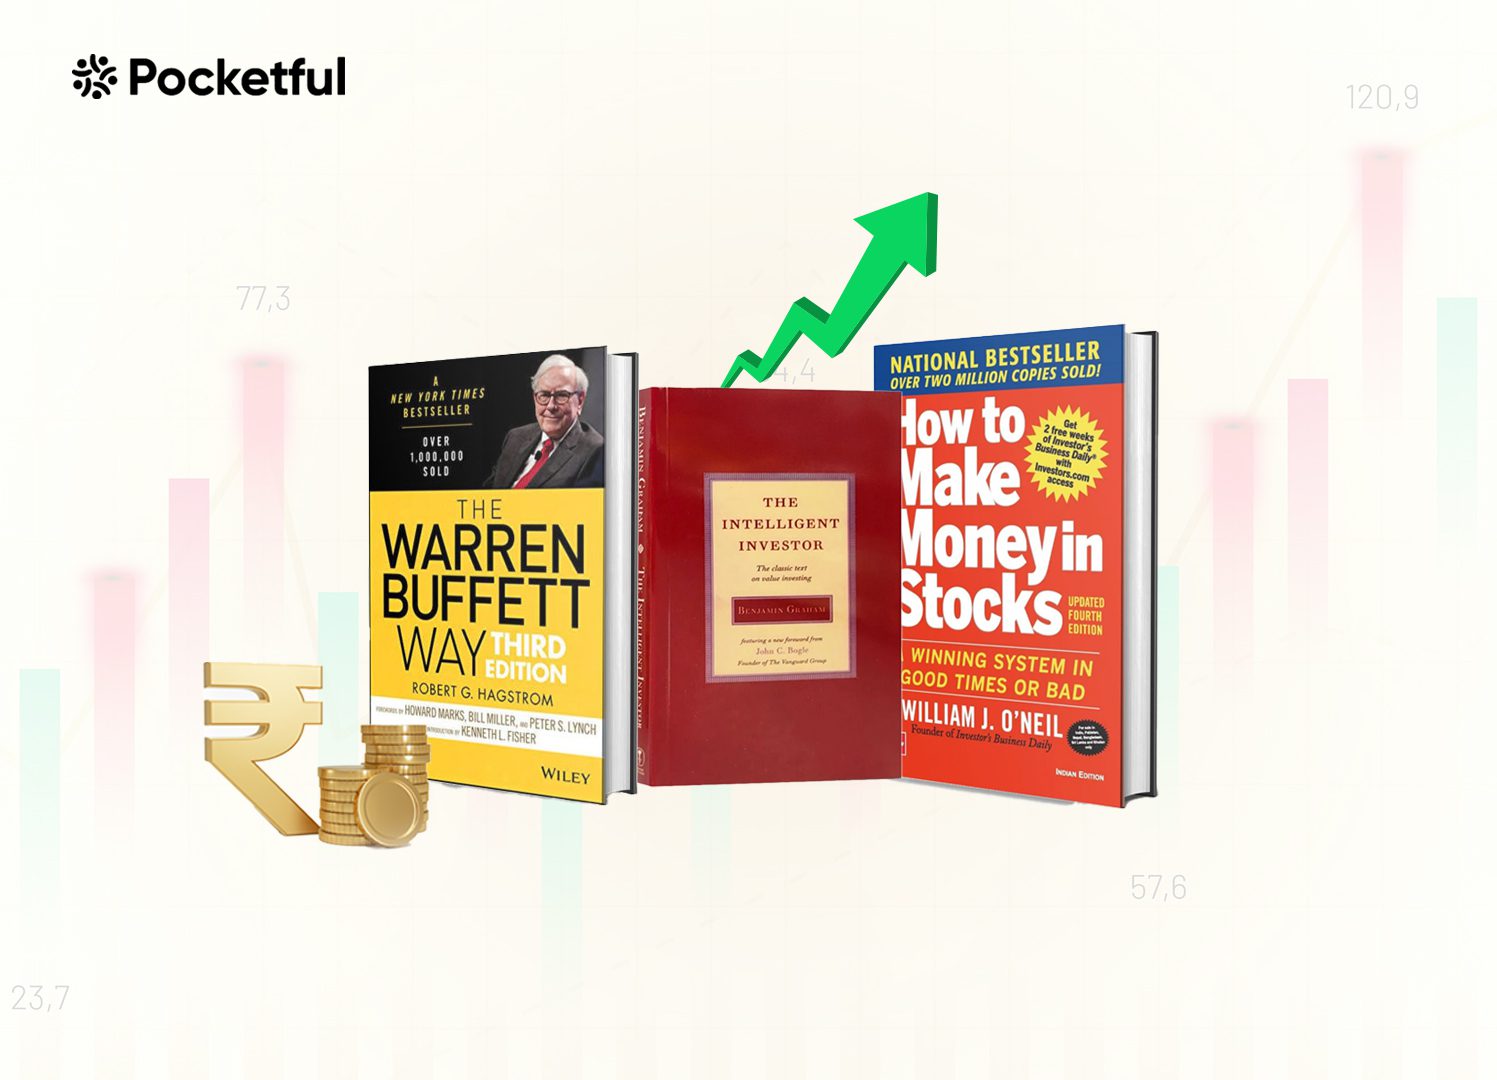
Welcome to our guide on the top 10 books for beginners in trading and investing. These carefully selected books will give you invaluable insights, regardless of your investing experience. These books are put together in such a way that one gets knowledge and develops confidence in the successful navigation of the stock market – from foundational principles to practical strategies. Dive in to uncover the best resources you need to build a solid investment foundation!
List of Top 10 Trading & Investing Books for Beginners
| S.No. | Book Name | Year | Name of the Author | Pages | Rating (Goodreads) |
|---|---|---|---|---|---|
| 1 | The Intelligent Investor | 1949 | Benjamin Graham | 640 | 4.22 |
| 2 | A Beginner’s Guide to the Stock Market | 2020 | Matthew R. Kratter | 282 | 4.3 |
| 3 | A Random Walk Down Wall Street | 1973 | Burton G. Malkiel | 496 | 4.14 |
| 4 | Common Stocks and Uncommon Profits | 1958 | Philip A. Fisher | 272 | 4.16 |
| 5 | The Little Book That Still Beats the Market | 2005 | Joel Greenblatt | 176 | 4.2 |
| 6 | One Up on Wall Street | 1989 | Peter Lynch & John Rothchild | 304 | 4.25 |
| 7 | The Warren Buffett Way | 1994 | Robert G. Hagstrom | 320 | 4.18 |
| 8 | How to Make Money in Stocks | 1988 | William J. O’Neil | 464 | 4.1 |
| 9 | The Little Book of Common Sense Investing | 2007 | John C. Bogle | 240 | 4.32 |
| 10 | Rule #1 | 2006 | Phil Town | 322 | 4.12 |
Best Books on the Stock Market – An Overview
An overview of the best books for beginners in trading and investing are given below:
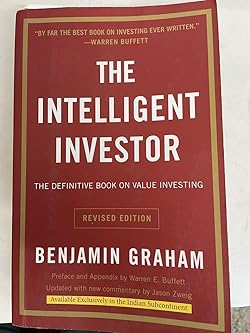
1. The Intelligent Investor
This book by Benjamin Graham is one of the best investment books for beginners and experts. The motive of this book is to help potential investors avoid errors while making investments and help them achieve their investment goals. Benjamin Graham was Warren Buffet’s mentor. The principles and investment strategies mentioned by Graham in this book can help investors develop a successful investing strategy without taking excessive risk. This book clears up every doubt of first-time investors and enhances the understanding of the stock market and value investing. The book is filled with practical examples of what to look for while choosing stocks.
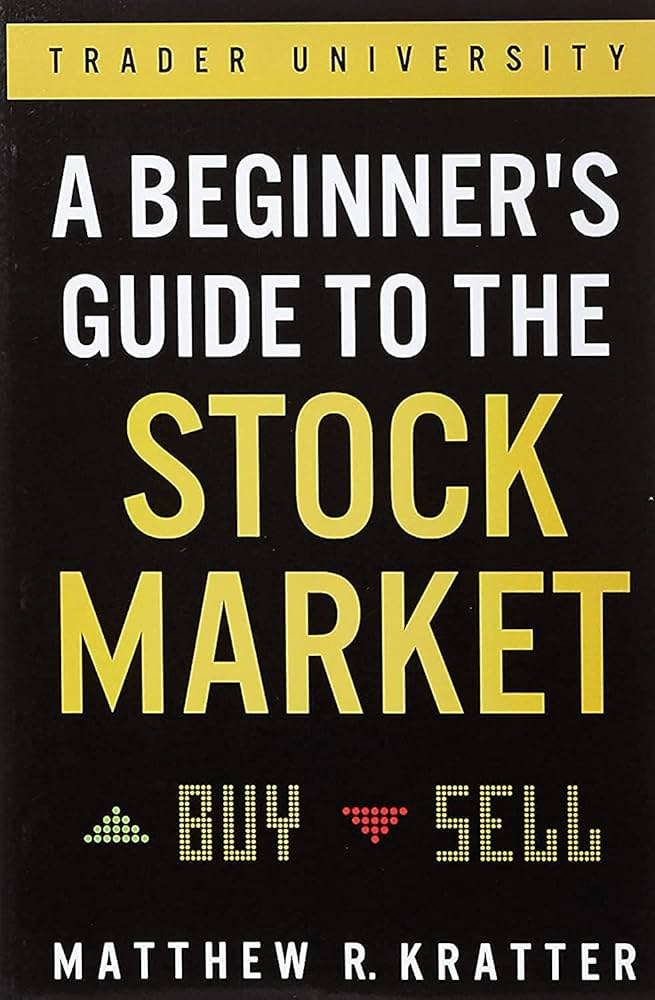
2. A Beginner’s Guide to the Stock Market
“A Beginner’s Guide to the Stock Market” by Matthew R. Kratter provides an easily understood introduction to investing in the stock market for a beginner. A hedge fund manager himself, Kratter shares practical knowledge and insights he has amassed during his years in financial markets. He includes vital information on how to purchase and sell stocks, understand the mechanics of the market, and common mistakes one should avoid. He simplifies these concepts so they are easily understood by someone new to investing. Readers learn practical strategies for stock picking, risk management, and building a profitable portfolio from scratch.
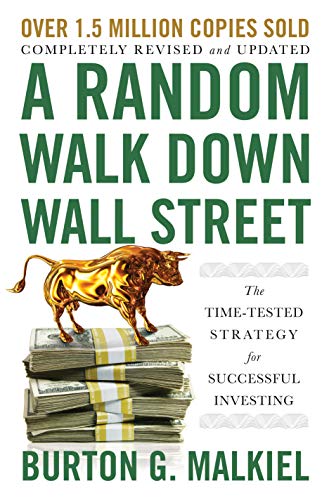
3. A Random Walk Down Wall Street
“A Random Walk Down Wall Street” by Burton G. Malkiel is a classic, timeless book that explains a path toward long-term investing. The book provides in-depth views on the efficient market hypothesis, indexing, and asset allocation, focusing on how selecting individual stocks and timing the market often results in a waste of time. He makes the case that for most people, the smartest choice is to go with low-cost index funds. He offers historical evidence and practical advice to support his approach, which would form a good resource for a beginning investor interested in a clear, evidence-based investment approach.
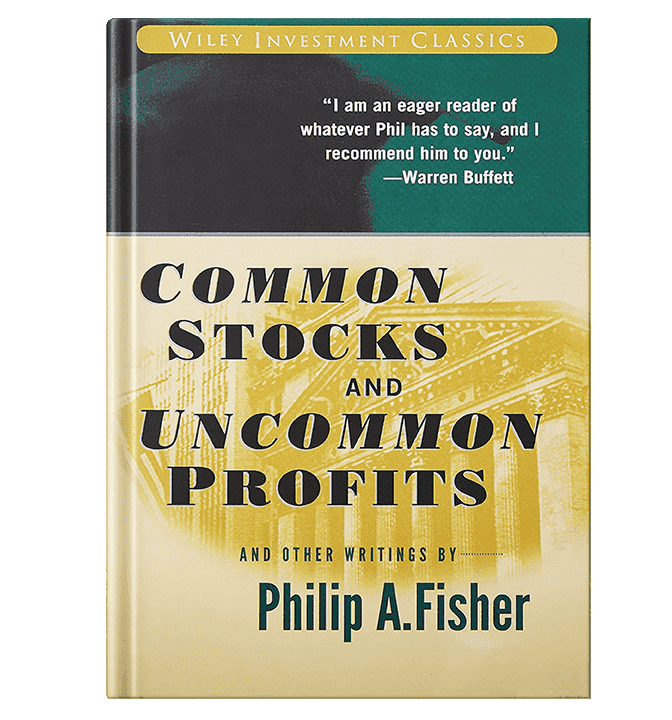
4. Common Stocks and Uncommon Profits
“Common Stocks and Uncommon Profits” by Philip Fisher is nothing less than a seminal work in growth investing, generally regarded as essential reading for any investor who wants to identify high-quality stocks. Fisher is a highly respected pioneer in investment analysis, known, among other things, for his observation that qualitative information about companies is even more important than quantitative information. Fisher points out the 15-point stock checklist he adheres to, ranging from management quality to competitive advantage to market potential to help investors identify, buy, and hold on to great companies. He also stresses that one should conduct enough research to understand a company’s true potential rather than mere financial statements.
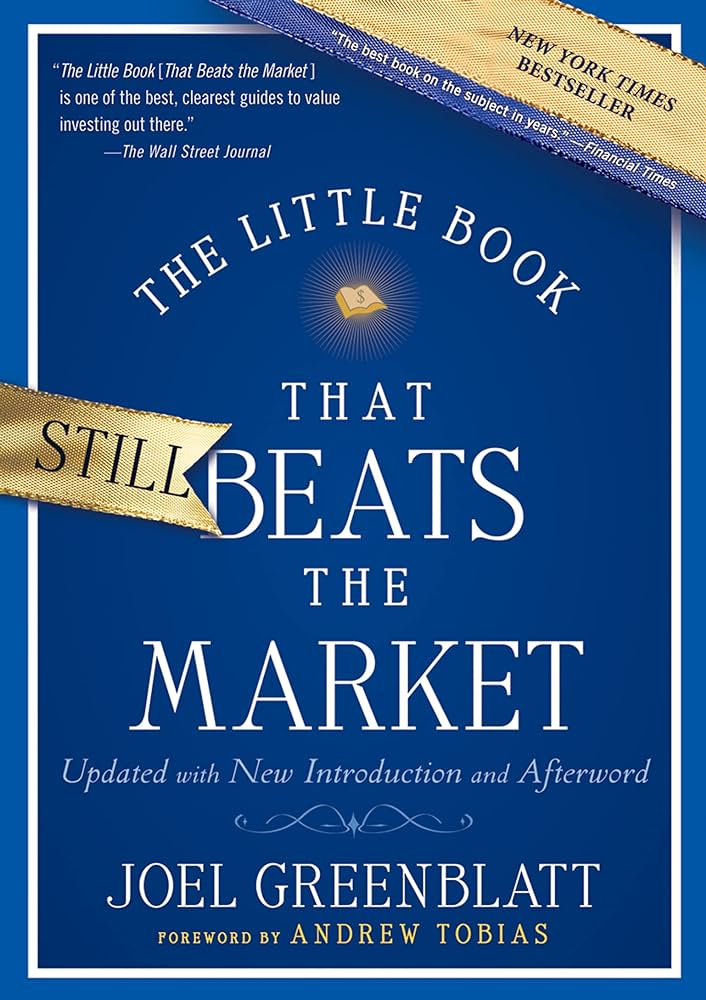
5. The Little Book That Still Beats the Market
“The Little Book That Still Beats the Market” by Joel Greenblatt outlines in a very simple yet powerful way how to invest in stocks with his “magic formula” so that even unsophisticated investors can beat the market. This book lays out in a structured manner how one might find undervalued stocks that have high returns on capital, which includes buying good companies at bargain prices. Greenblatt describes his formula in a super simple way that any reader can understand. Through a step-by-step process, readers learn how to build a portfolio of stocks to generate consistent and above-average returns.
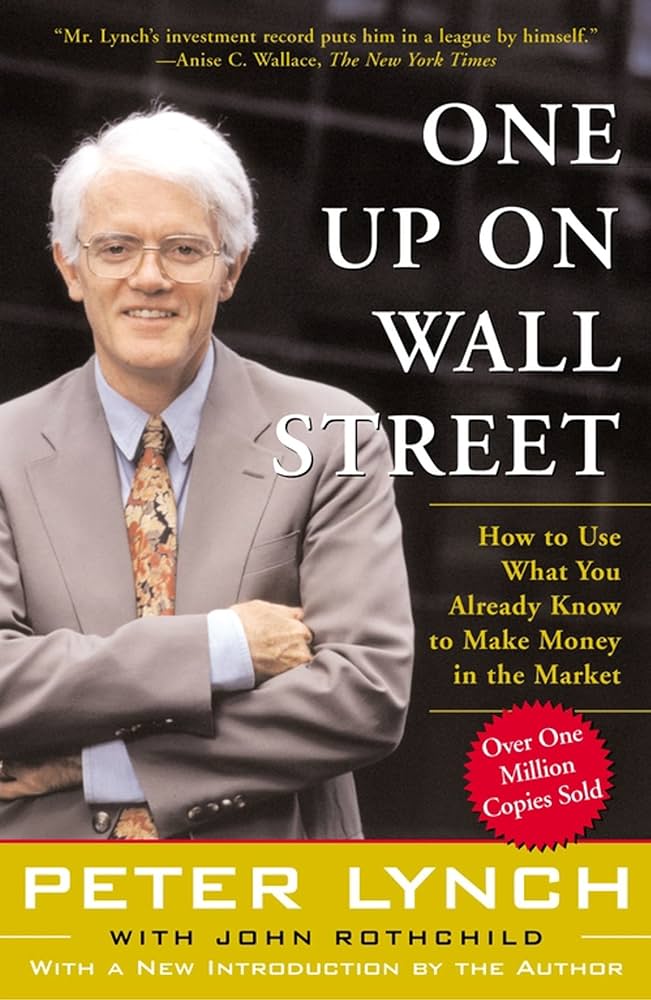
6. One Up on Wall Street
“One Up on Wall Street” by Peter Lynch is a timeless guide that allows individual investors to use their own experiences and knowledge from everyday life to find winning stocks before the professionals on Wall Street can. Lynch, known for his long tenure as manager of Fidelity’s Magellan Fund, had unsurpassed success, time and again beating the market through his practical, hands-on investment approach. The book lays out Lynch’s investment philosophy-what to do, what not to do. He discusses how one has to do one’s own research and invest in what one knows. He teaches how to value companies and when to buy, hold, and sell. Lynch’s approach focuses on common sense in identifying opportunities in everyday life and knowing companies inside and out.
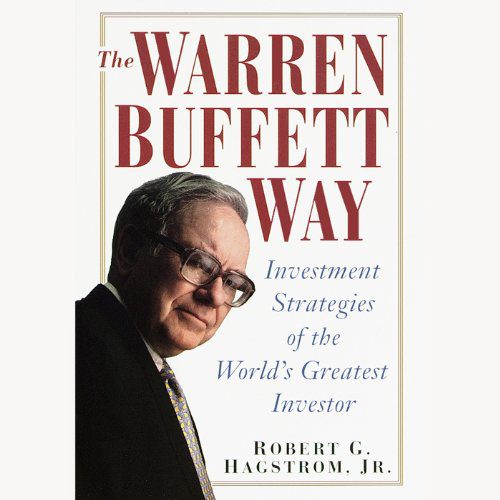
7. The Warren Buffett Way
“The Warren Buffett Way” by Robert G. Hagstrom gives an in-depth insight into the investment strategies and philosophies of Warren Buffett, one of the most successful investors in history. As an experienced portfolio manager and author, Hagstrom breaks down Buffett’s investment approach and makes it available to investors who want to model their investments after his proven track record. He enumerates Buffett’s principles on value investing: a comprehensive business analysis, evaluation of management, and breakdowns of financial statements. Furthermore, the author explains case studies that summarize Buffett’s major investments and shows how he applies those principles in practice. Patience, discipline, and exhaustive research are taught as key tenets to adhere to when making investment decisions.
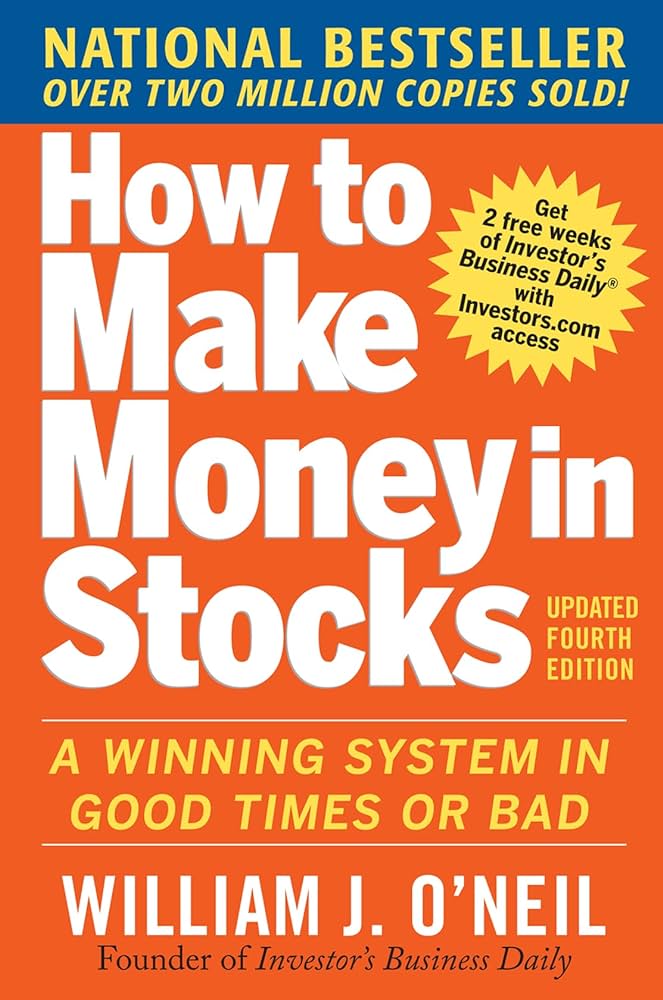
8. How to Make Money in Stocks
“How to Make Money in Stocks” by William J. O’Neil explains the CAN SLIM investment strategy, developed to help investors pick high-growth stocks and build a lucrative portfolio. The founder of Investor’s Business Daily, William J. O’Neil, is an investor and financial markets expert recognized for using data in his investment approach. The author explains how to implement the CAN SLIM strategy- a technical analysis-based method of stock selection centered on seven characteristics shared by winning stocks. Major themes discussed include chart reading, risk management, and timing. O’Neil stresses the importance of sticking with market trends and investing in stocks with huge earnings growth.
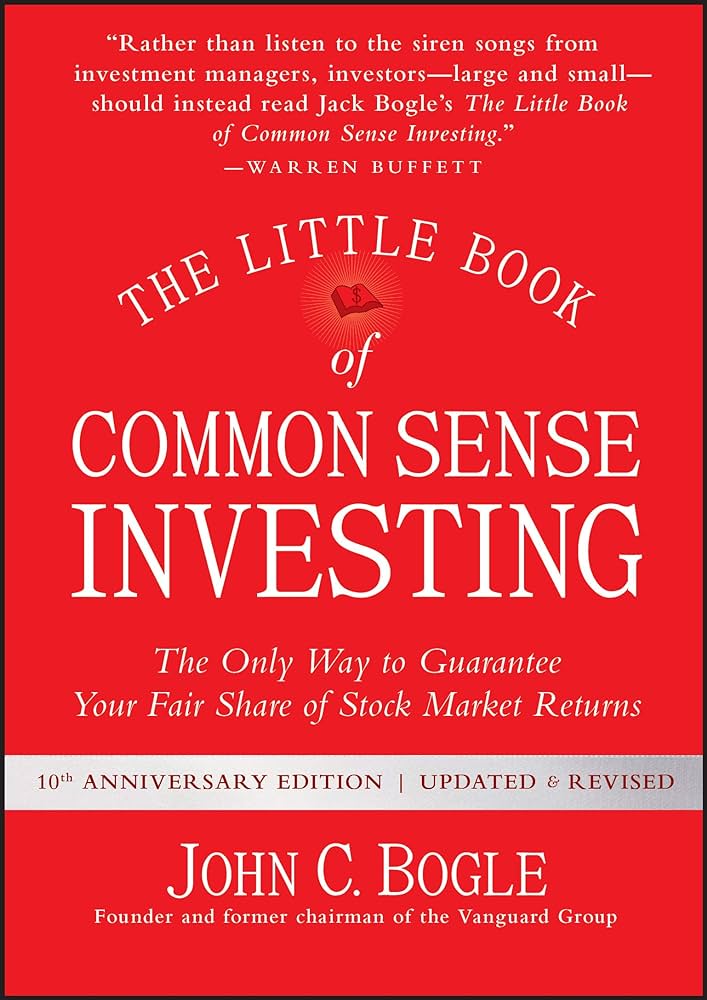
9. The Little Book of Common Sense Investing
“The Little Book of Common Sense Investing” by John C. Bogle is a straightforward guide that has generally argued for the lowest-cost index fund investing and has presented a simplified and uncomplicated way to implement a very effective long-term wealth-building strategy. This book contends that most actively managed funds cannot beat the market because of the high fees and turnover. Bogle shows that for the average investor, a low-cost index fund has the highest probability of success because such a fund represents the overall market. He stresses key concepts such as patience, low costs, and the magic of compounding for investing success.
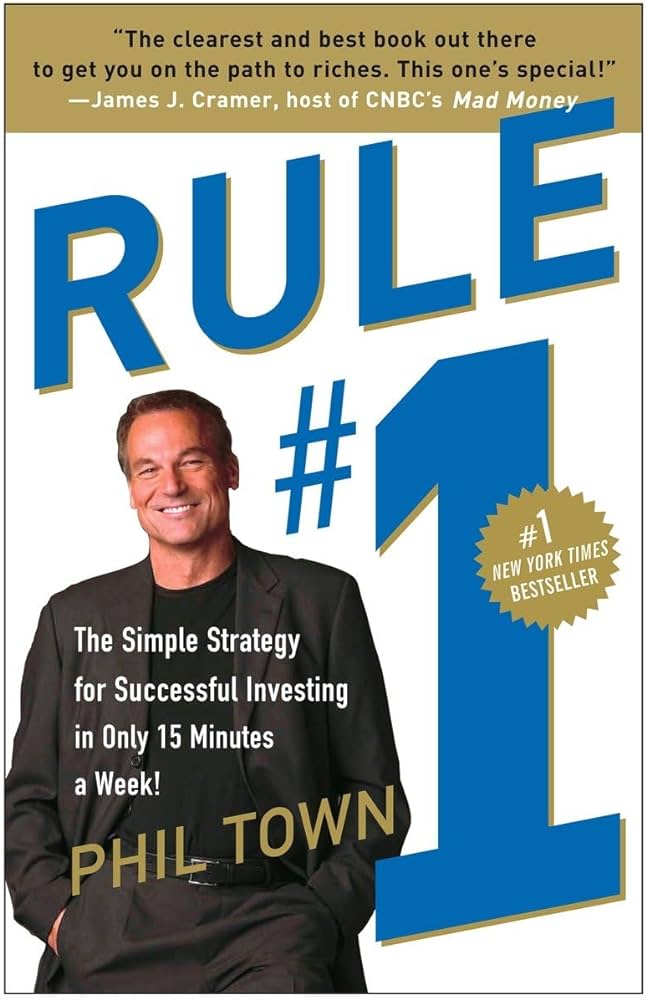
10. Rule #1
“Rule #1” by Phil Town provides an easy-to-follow guide to value investing as it demystifies the process of finding high-quality stocks with potentially substantial returns. An accomplished investor and author, Town shares his investment philosophy rooted in the principles of Warren Buffett while showing individual investors how to take action. The book shows Town’s “Rule #1” investment methodology, where much emphasis is placed on buying stocks at a significant discount to their intrinsic value. It explains how to assess companies through a simple framework and places considerable emphasis on financial analysis and disciplined investing. Readers learn how to identify undervalued stocks, manage risk, and construct a solid investment portfolio with a long-term outlook.
Read Also: Trading For Beginners: 5 Things Every Trader Should Know
Conclusion
To summarize, the 10 books mentioned above would be very helpful in teaching you essential concepts to start your trading and investment journey. Each book imparts knowledge and practical advice in ways that will help you develop a strong understanding of the market and investment skills. You will gain the ability and professional acumen required to make better investment decisions and achieve your financial goals. Enjoy reading these books, and all the best for your success in the world of investing.
Frequently Asked Questions (FAQs)
Do I need to read all these books to start investing?
No, it is not necessary to read them all. It’s sufficient to start with a few books that interest you the most and gradually move on to other books as your knowledge base expands.
How do you choose which book to start with among the 10 books mentioned above?
An individual should consider his/her level of knowledge and investment goals. “A Beginner’s Guide to the Stock Market” by Matthew R. Kratter is one of the best books for building a strong foundation.
How can I put into practice what I learn from these books?
Apply strategies and principles learned from these books by making small investments, analyzing companies, and building new techniques based on your investing style over time. However, it is advised to consult a financial advisor before investing.
Are these books available in digital formats?
Most of the above-mentioned books are available in digital formats, such as eBooks and audiobooks.
Will any of these books be useful in planning my retirement?
The principles and strategies discussed in these books can be used for retirement planning by building a diversified portfolio focusing on long-term growth.