Ever wondered how professional traders predict trend reversals with high accuracy? Most of them know numerous patterns. One such candlestick pattern is the Bearish Engulfing pattern. The Bearish Engulfing pattern is all about when the trend reverses from bullish to bearish and sellers take control.
In this blog, we will discuss the Bearish Engulfing candlestick pattern, its characteristics, trading setup, advantages, and disadvantages with an example.
What is the Bearish Engulfing Pattern?
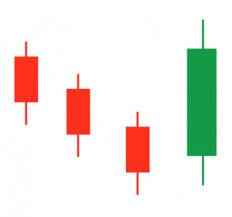
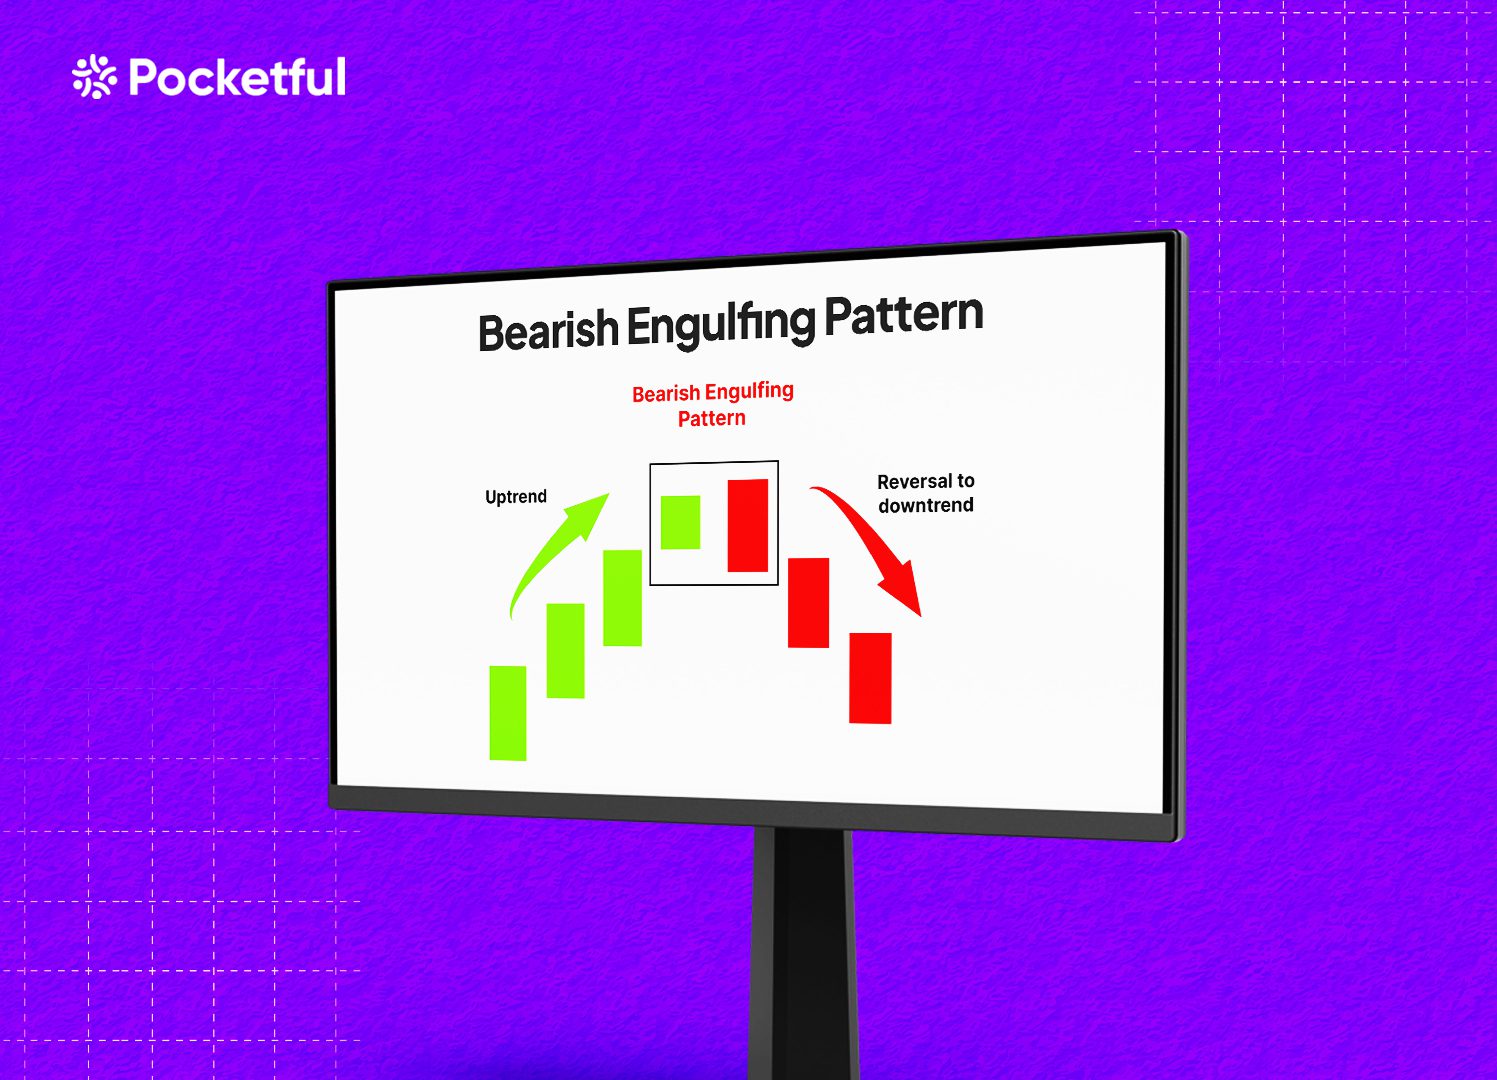
A Bearish Engulfing pattern is a bearish reversal pattern where sellers take charge and indicate a change of trend from bullish to bearish because it appears after an uptrend. The pattern consists of two candles, and the bullish candle is smaller than the following bearish candle. It is a key reversal pattern and can be observed in candlestick charts. Traders use this pattern to create short positions or exit long positions.
Read Also: Introduction to Bearish Candlesticks Patterns: Implications and Price Movement Prediction
Characteristics of the Bearish Engulfing Pattern
The Bearish Engulfing pattern is a candlestick pattern used to identify a potential reversal from an uptrend to a downtrend. It unfolds as per the following phases:
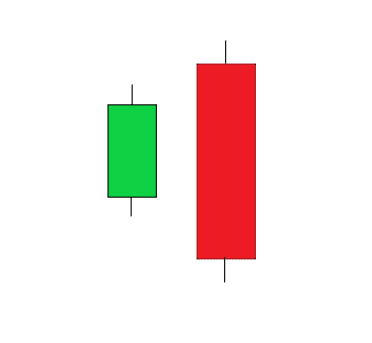
- Two Candle Pattern: This is a two-candle chart pattern in which the first candle is bullish, and the second candle is a big bearish candle. The bullish candle is smaller than the bearish candle.
- Engulfing: The second bearish candle completely engulfs the body of the first bullish candle.
- Formation: It generally forms after a long uptrend and indicates a possible trend reversal.
- Psychology: The large bearish candle shows that the sellers are in control now, and the trend will change.
- Other Considerations: Always wait for a further price decline after the bearish engulfing candle for better accuracy. Once the next candle gives a breakdown below the low of the engulfing candle with increased volume, it can be seen as a confirmation signal for trend reversal, and traders can create short positions.
This pattern helps traders recognize when a bullish trend may be coming to an end, offering opportunities to exit long positions or to enter short positions.
Trading Setup
The Bearish Engulfing pattern can be effectively used by following the below trading setup:
- Entry Point: Entry point should be when the price gives a breakdown below the low of the bearish engulfing candle. Look for the increase in volume to get a confirmation and then create a short position.
- Stop Loss: A stop loss should be placed just above the high of the engulfing candle to manage risks and reduce losses if the pattern gives a false breakdown.
- Target: The trader can determine target levels by using support levels, Fibonacci levels, or customized risk and reward ratios.
Advantages of Bearish Engulfing Pattern
The advantages of the Bearish Engulfing pattern are:
- It works in any market, such as equity, currency, or commodity markets.
- The pattern can be used on any time frame, but a bigger time frame suggests a strong trend reversal is expected.
- It is easy to identify.
- The pattern is a reliable reversal signal indicator.
- Traders can capture large moves using this pattern.
- The pattern provides a logical understanding of price action and a complete trading setup.
- The pattern can be combined with other indicators to get confirmation.
- This pattern gives quite accurate results if a breakdown below the low of the bearish engulfing candle occurs with strong volumes.
Limitations of Bearish Engulfing Pattern
The limitations of the Bearish Engulfing pattern are:
- The pattern can give false signals in a sideways market.
- The pattern interpretation can sometimes be subjective as there can be minor changes in candle size.
- The pattern is not effective in a very strong bullish trend.
- The pattern could give a false breakdown and fail like any other pattern, resulting in losses.
- This pattern could be affected by various market factors, such as volatility, news, policy change, political instability, etc.
- The pattern’s reversal signal requires confirmation from other indicators for better accuracy.
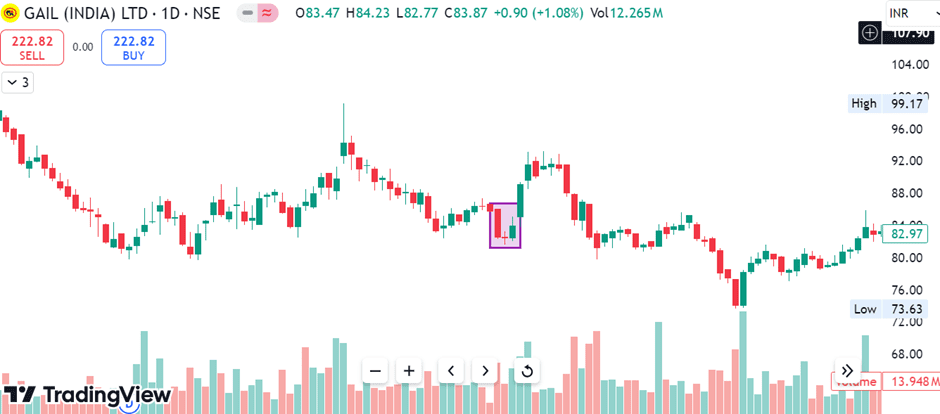
Example: Bearish Engulfing Pattern for Hindalco Industries
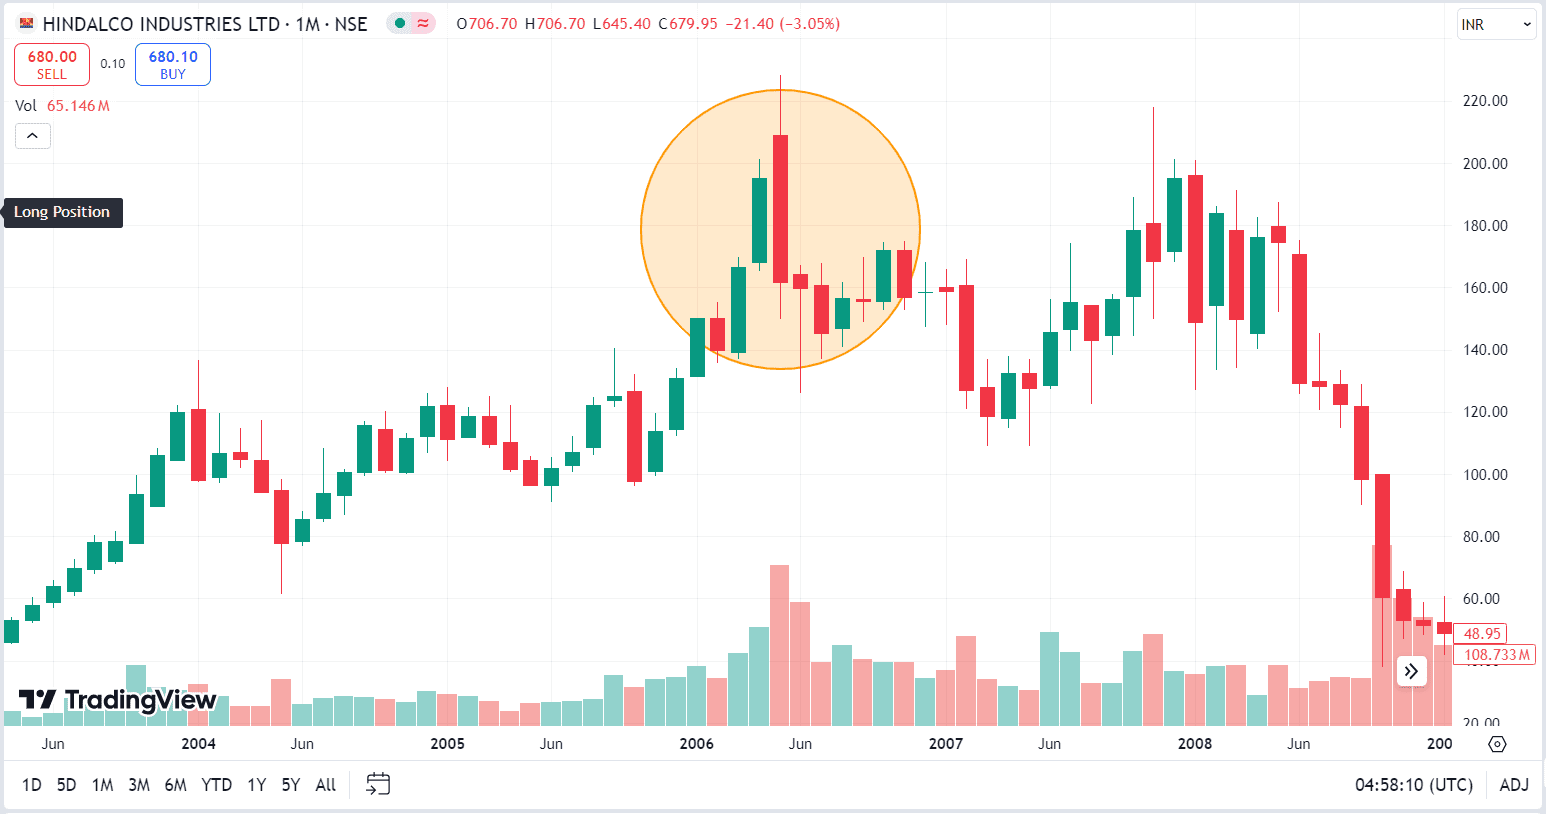
The above image shows the price chart of Hindalco Industries on a monthly time frame. In May 2006, the stock price made a Bearish Engulfing pattern as the bearish candle completely engulfed the previous month’s high and low. The stock price declined from INR 208 to INR 118 between May 2006 and March 2007. The target zone can be marked at the Fibonacci Levels or the nearest major support levels. Stop-loss can be placed just above the high of the bearish engulfing candlestick and trail stop-loss as the stock price declines.
Read Also: Bullish Engulfing Pattern
Conclusion
The Bearish Engulfing candlestick pattern is popular among both investors and traders due to its accuracy. It signals a potential trend reversal in the security’s price from bullish to bearish. Confirmations such as volume spikes can be used to identify strong breakdown signals. The pattern also has some limitations, such as false signals in sideways markets and ineffectiveness in short-term time frames. Hence, it is important to understand the pattern’s characteristics, trade setup, and risk management strategies before trading. It is advised to consult a financial advisor before investing.
Frequently Asked Questions (FAQs)
Can a Bearish Engulfing pattern occur in a downtrend?
A Bearish Engulfing pattern generally appears at the top of an uptrend but can also appear as a continuation pattern during a downtrend. However, the pattern has a greater significance when it occurs after a bullish trend.
Can the Bearish Engulfing pattern be used with other indicators?
Yes, it can be used with other indicators, and it is recommended to use the bearish engulfing pattern in conjunction with other technical indicators like the Relative Strength Index (RSI), MACD, or Fibonacci retracement for enhanced accuracy.
What are the key limitations of the Bearish Engulfing pattern?
The primary limitations of the Bearish Engulfing pattern are the risk of a false breakdown in the sideways market and ineffectiveness in a short time frame. It is a lagging indicator and often requires confirmation for reliability.
Is the Bearish Engulfing pattern effective in all market conditions?
The Bearish Engulfing pattern is most effective in trending markets and can generate false signals in sideways or range-bound markets. It’s also ineffective during strong bullish trends, where the market’s momentum is so strong that it might overpower the reversal signal of the chart pattern.
How many candles occur in the Bearish Engulfing pattern?
Two candles occur in the formation of the Bearish Engulfing pattern. The first candle is bullish, and the second candle is a big bearish candle.