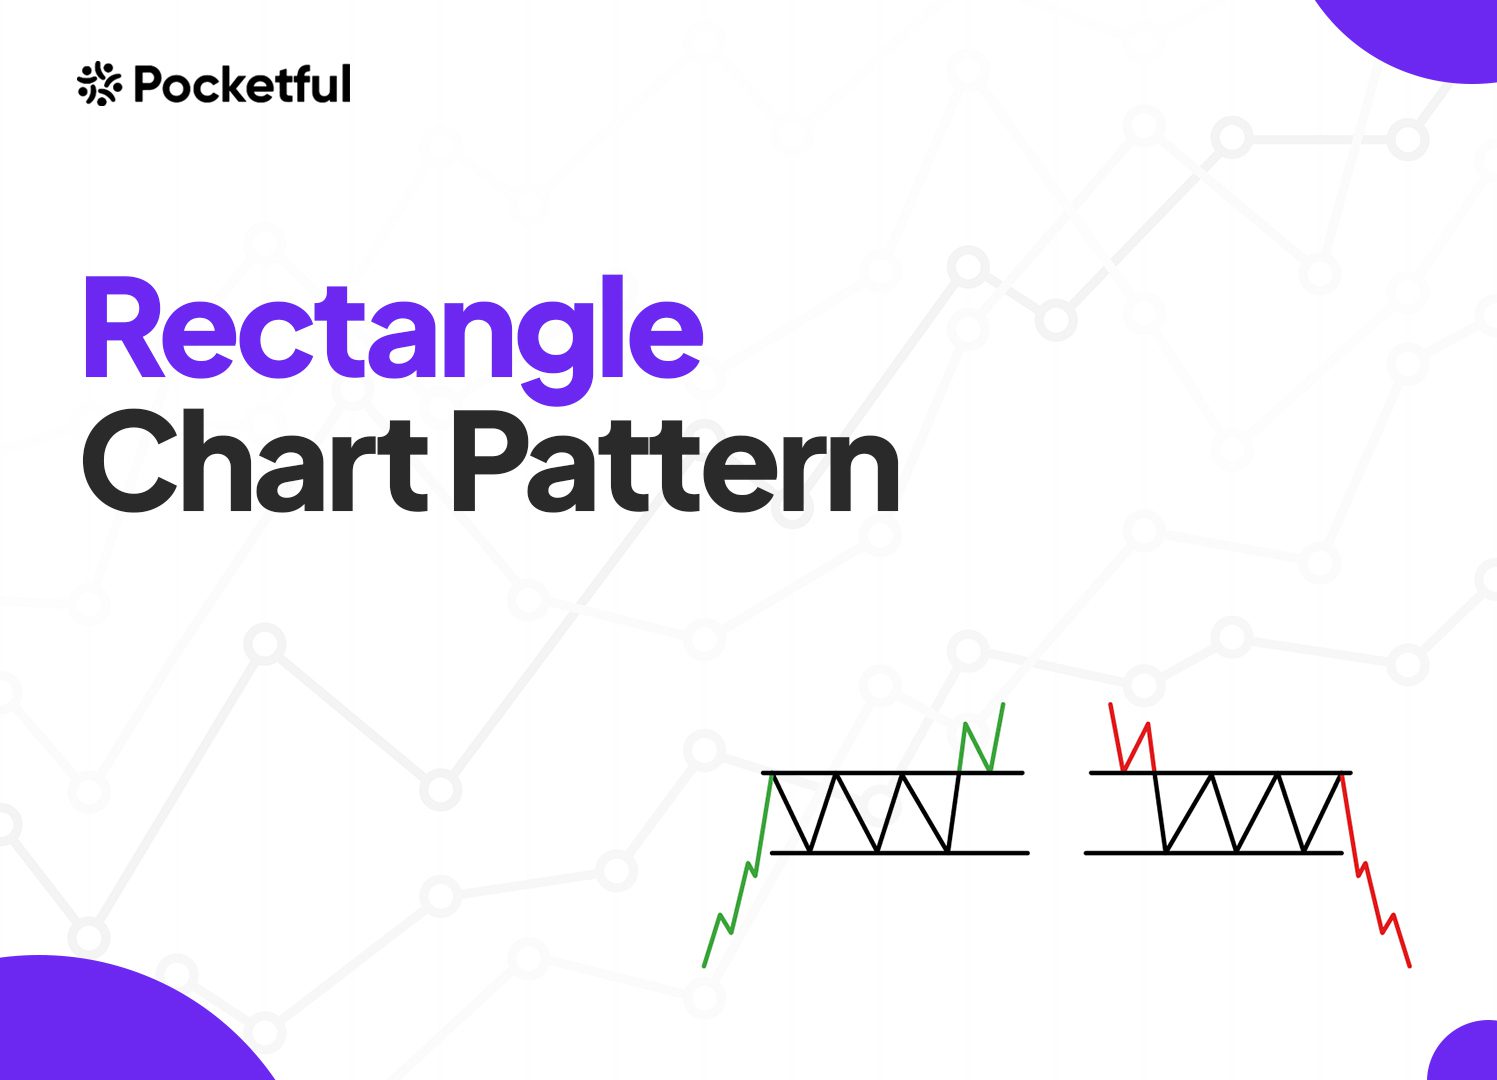
The Rectangle chart pattern is a technical analysis chart pattern used to identify potential price breakouts. This pattern appears when the price of a security moves within a range, creating a rectangular shape on a chart.
In this blog, we will explore the Rectangle chart pattern, its interpretation, trading setups, advantages, and limitations with the help of examples.
What is the Rectangle Pattern?
The Rectangle chart pattern is a technical analysis pattern in which the price of an asset moves within a defined horizontal range. In this pattern, the price moves in a range and consolidates for some time before breaking out of the range. The pattern typically consists of at least two distinct touch points at both the support and resistance levels. The range-bound movements indicate a balance of power between buyers and sellers.
Different types of Rectangle chart patterns are:
Bullish Rectangle:
- The asset price starts forming a rectangle pattern after an uptrend.
- The price consolidates within the rectangle, then breaks out above the resistance level, continuing the upward trend.
Bearish Rectangle:
- The asset price starts forming a rectangle pattern after a downtrend.
- The price consolidates within the rectangle, then moves below the support level, continuing the downward trend.
Rectangle Chart Pattern Interpretation
When interpreting the Rectangle chart pattern, the following key points must be considered:
- Consolidation Phase: The rectangle shows the indecisiveness of the market where buyers and sellers are balanced, leading to a horizontal trading range.
- Breakout: Once the breakout occurs, a significant price movement is likely to follow. The direction of the breakout indicates whether the asset will enter a bullish or bearish trend.
- Volume: During the formation of the rectangle, trading volume often decreases, reflecting the market’s indecision. A breakout typically occurs with a spike in volume, signaling a new trend.
- Target Price: The height of the rectangle, i.e., the distance between support and resistance, can be used to estimate the target price. Find the breakout price and add the height of the rectangle to get the target price.
Trading Setup
A trading setup consists of a precise plan for entry, stop-loss, and target levels, which are discussed as follows:
- Entry Point: The most common strategy is to enter the trade when the price breaks out of the rectangle pattern with strong volumes to confirm the pattern formation.
- Bullish Rectangle: Enter a long position when the price breaks above the resistance level, confirmed by strong volume.
- Bearish Rectangle: Enter a short position when the price breaks below the support level, also confirmed by strong volume.
- Stop-Loss: Place the stop-loss just near the boundary of the rectangle.
- Bullish Breakout: Set a stop-loss just below the upper trend line of the rectangle or former resistance level, which now acts as support.
- Bearish Breakout: Set a stop-loss just above the lower trend line of the rectangle or former support level, which now acts as resistance.
- Target: Measure the vertical distance between the support and resistance level. Find the breakout point where the price first breaks the resistance or support and add that distance to the breakout price.
- Bullish Target: Target = Resistance Level + Height of the Rectangle
- Bearish Target: Target = Support Level – Height of the Rectangle
Key points to remember while taking entry and setting stop-loss levels are:
- Buy/Sell on breakout: Buy the security when the price first breaks out above the resistance level or sell the security when the price gives a breakout below the support level.
- Buy/sell on pullback: If you are unable to enter the trade when a breakout occurs, wait for a pullback to enter the trade.
- Set stop-loss: Set a stop-loss below the breakout candle of the pattern to limit potential losses. We can also place stop-loss near the trend lines of the rectangle pattern.
Read Also: Measured Move – Bullish Chart Pattern
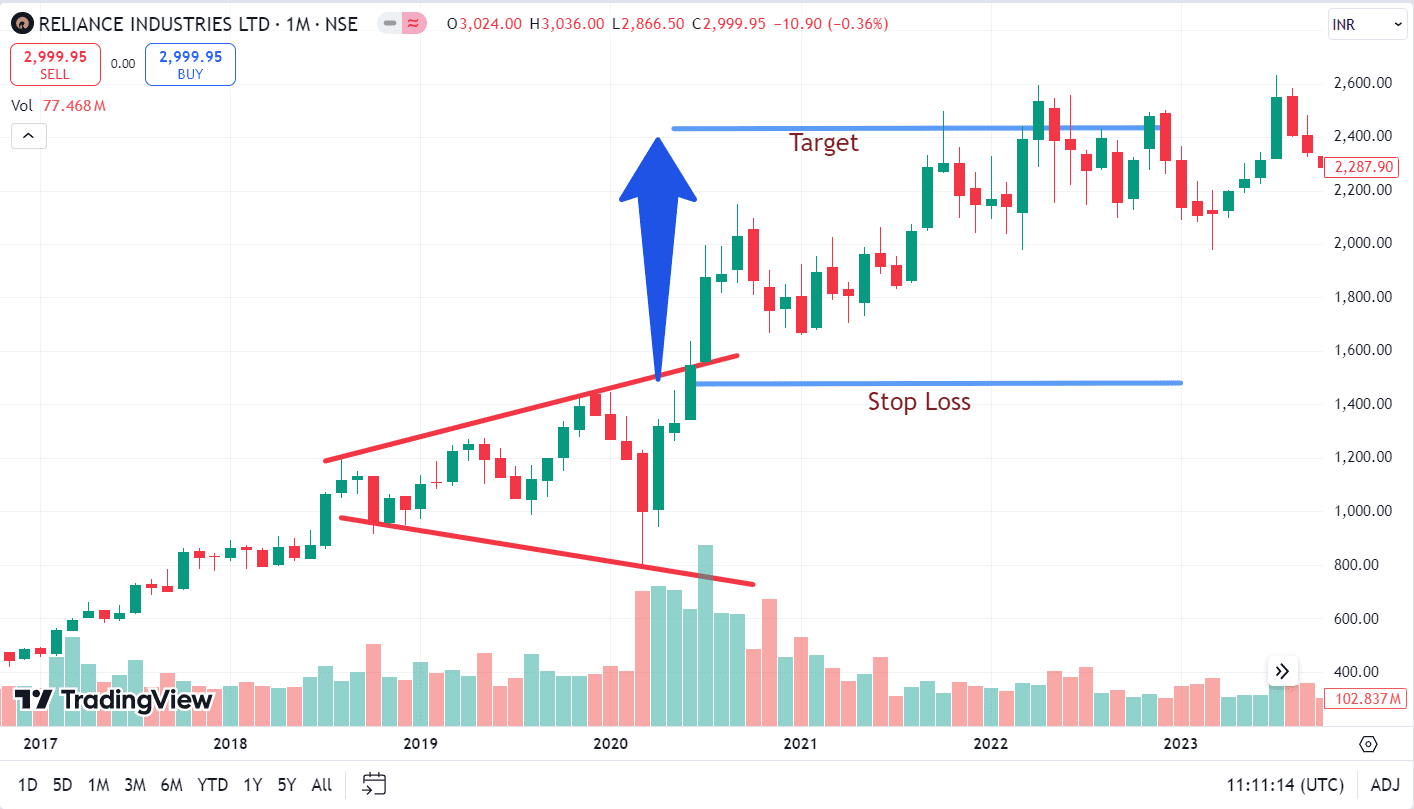
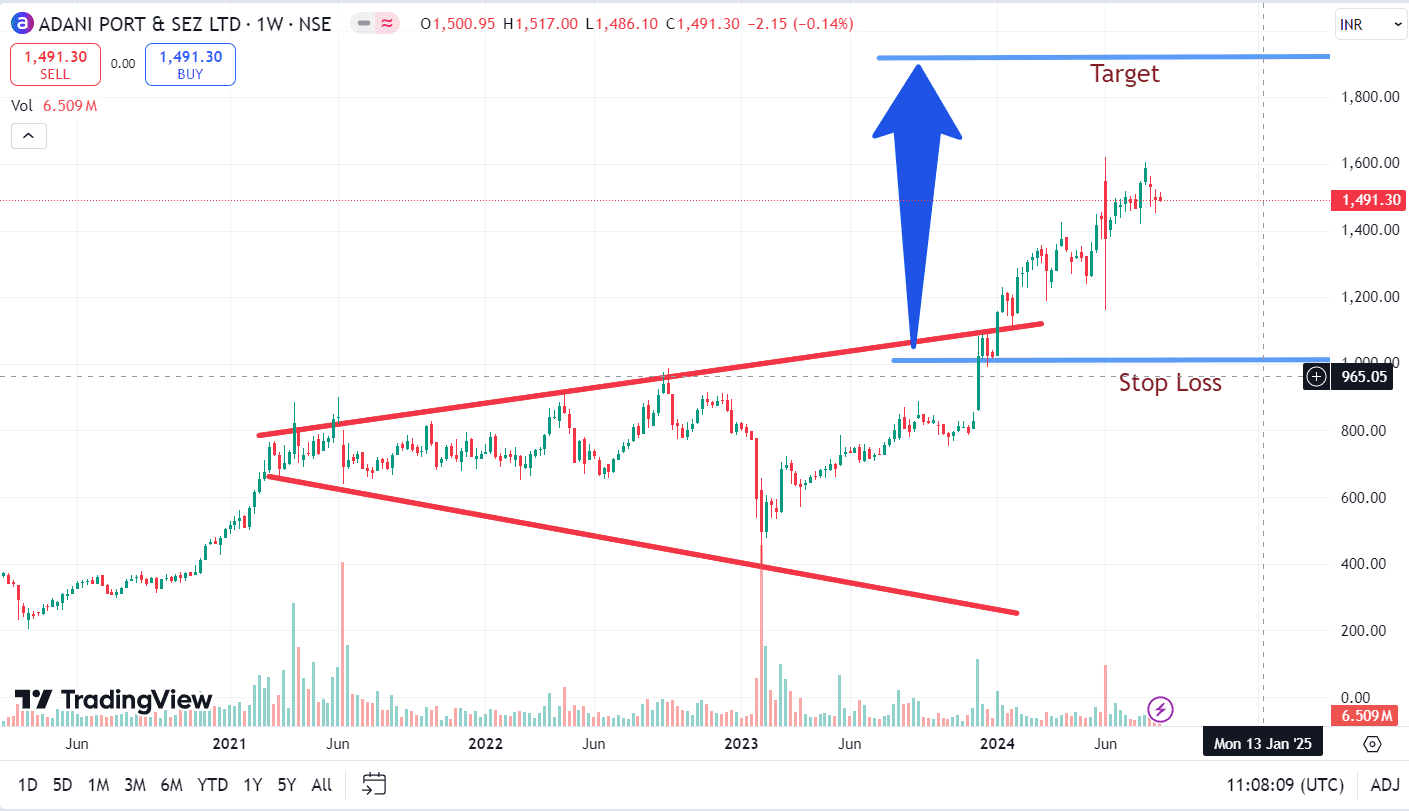
Example 1: Rectangle Pattern of Reliance Industries Ltd.
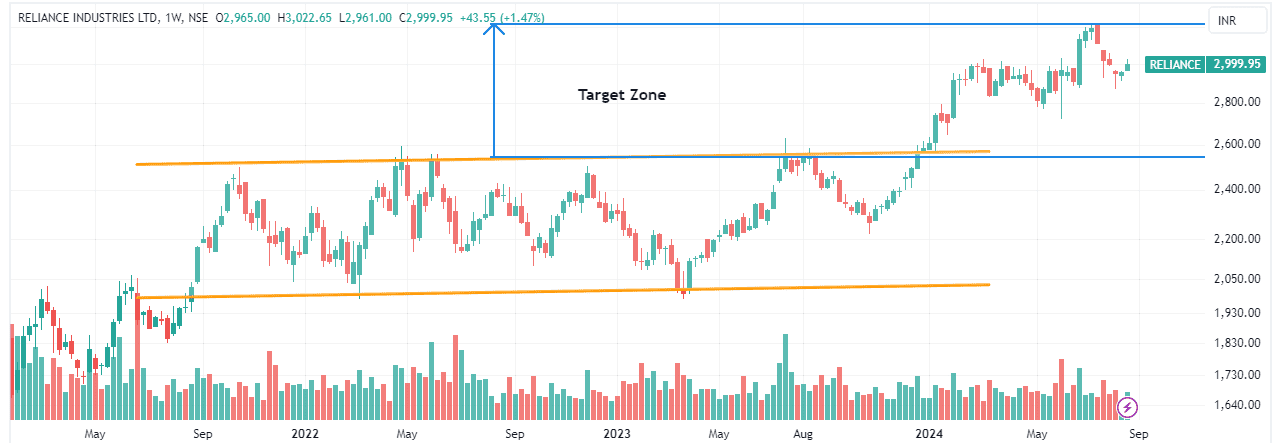
The above image shows the weekly chart of Reliance Industries. The stock has been in a consolidation phase for more than 2 years. The stock gave a breakout in January 2024 and resumed the last uptrend, and the stop-loss should be trailing in this case. Ideally, it should be below the low point of the breaking candle.
The target zone is marked as the height of the rectangle, measured as the vertical distance between the two trendlines of the rectangle pattern. The upper trendline or the resistance level is at 2600. The lower trendline or the support level is at 2000. The height of the rectangle is roughly 600 points. Adding 600 to the breakout point of 2637 gives us around 3237 or 3200 as a target level, which was achieved in July 2024.
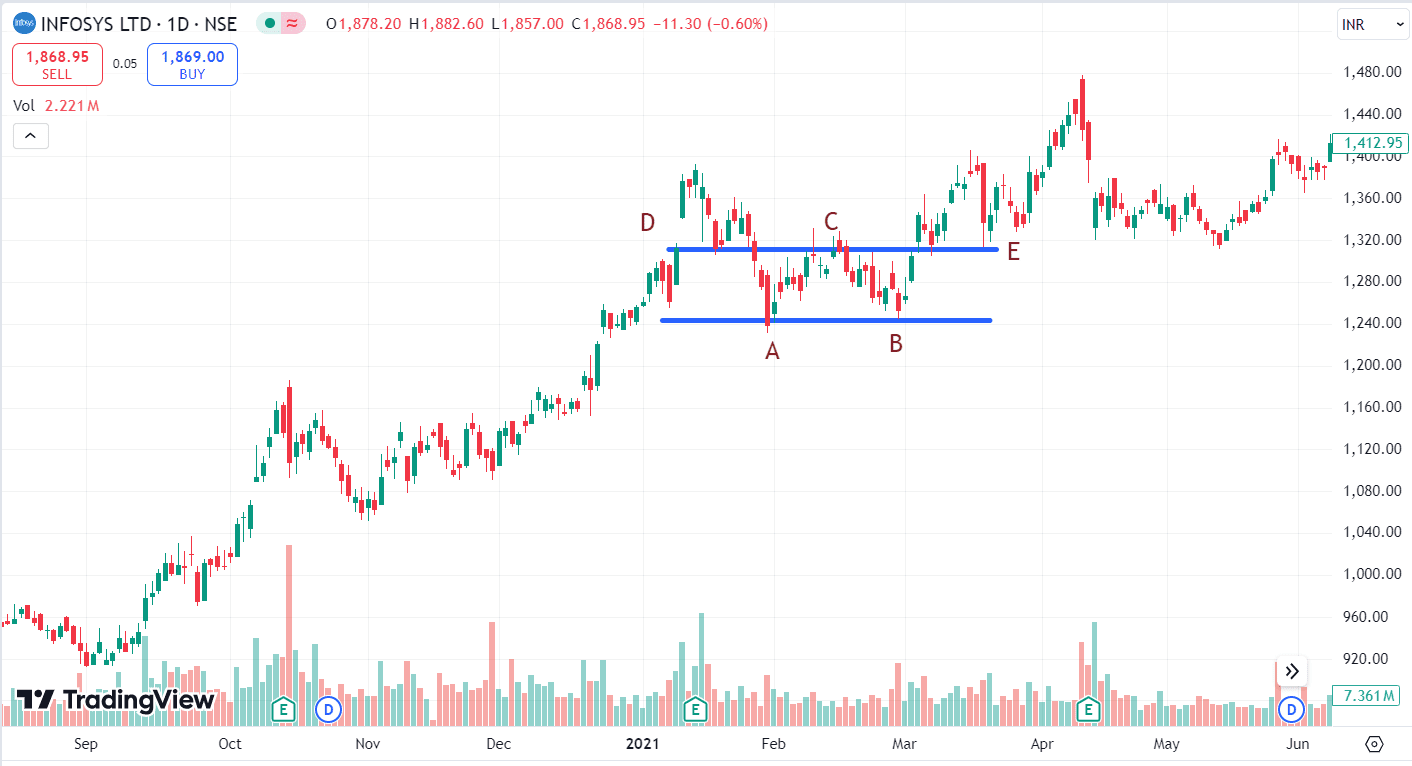
Example 2: Running Example of Rectangle Pattern of HDFC Bank
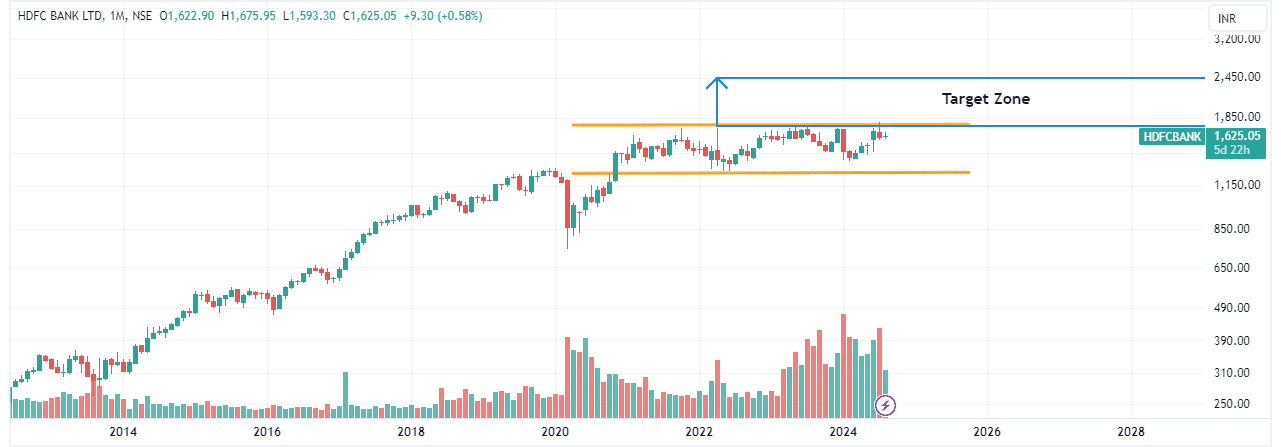
The above image shows the monthly chart of HDFC Bank. The stock has been in a consolidation phase since 2021 and is yet to give a breakout on either side. It would be interesting to watch how it will perform in the near future. Keep this stock on your watch list to check how this pattern works and achieves its targets.
Advantages of Rectangle Chart Pattern
The advantages of the Rectangle chart pattern are:
- It works in any market, e.g., equity, currency, or commodity.
- It works in any timeframe, but a bigger time frame means a strong trend is about to start.
- It gives a clear entry, exit, and stop-loss setup.
- The pattern allows effective risk management as it gives clear stop-loss levels.
- This pattern can give quite accurate results if the asset price breaks out with strong volumes.
Limitations of Rectangle Chart Pattern
The limitations of the Rectangle chart pattern are:
- The Rectangle chart pattern can take longer than expected to give a breakout.
- It requires patience and discipline as it is a sideways pattern.
- Prices can temporarily move beyond the support and resistance levels but then reverse, thus giving false breakouts.
- This pattern could be affected by various market factors like volatility, news, policy change, political instability, or other factors.
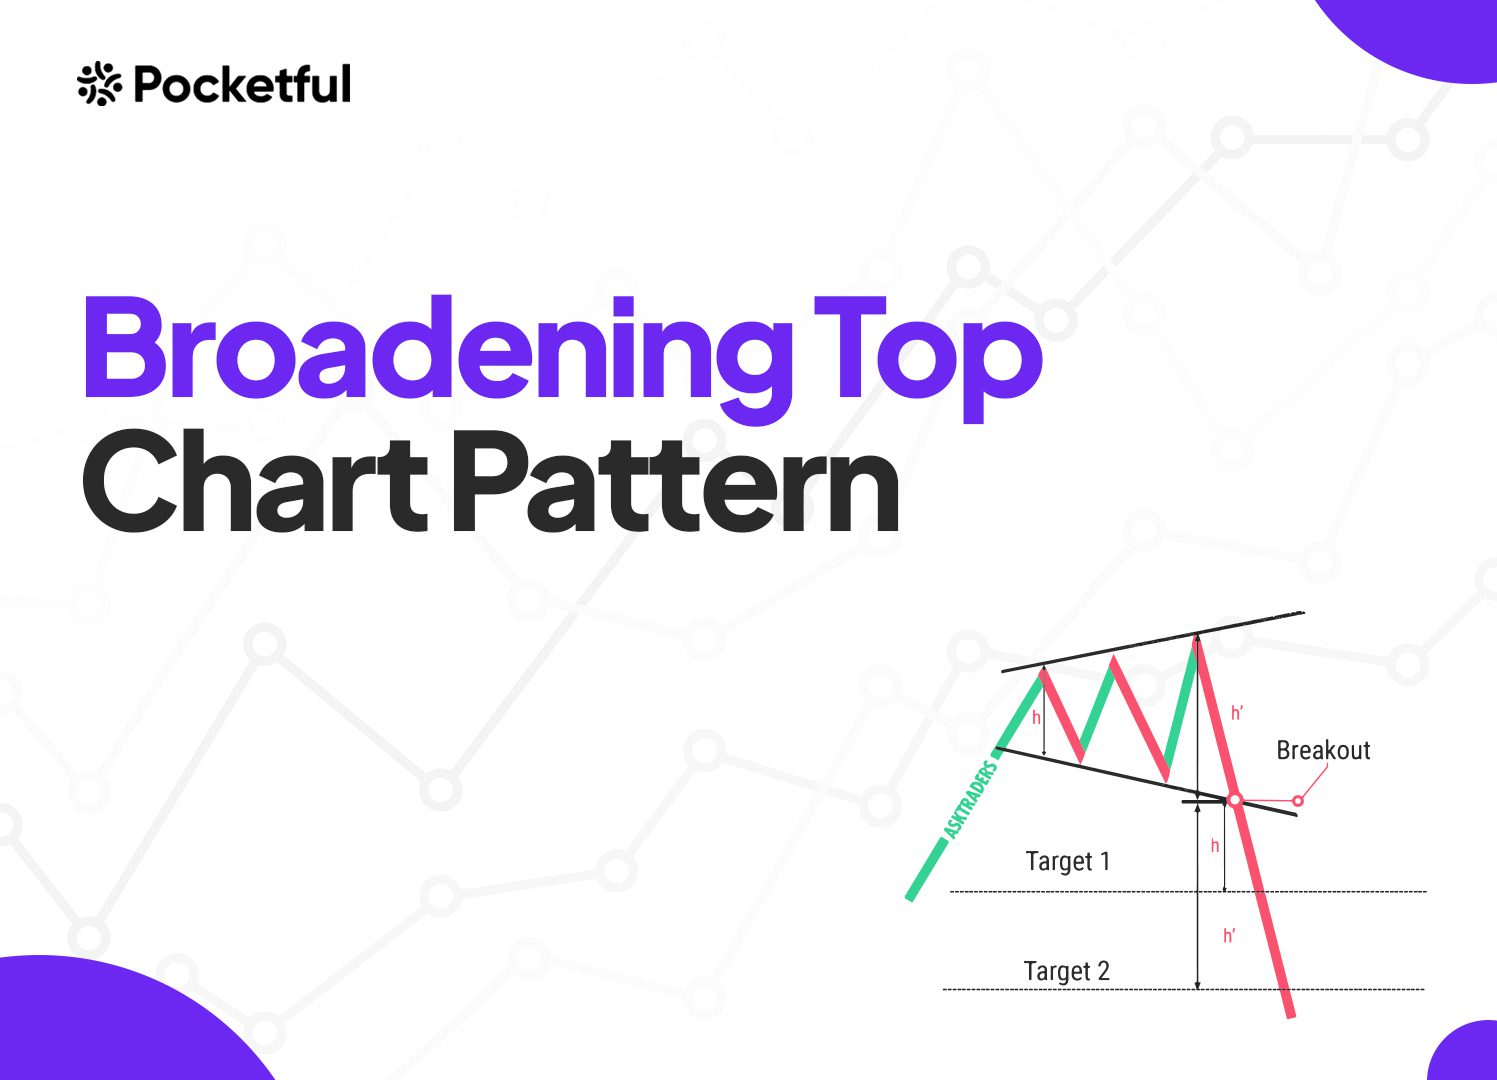
Read Also: Broadening Top Chart Pattern
Conclusion
In conclusion, the Rectangle chart pattern is a relatively straightforward one that helps traders sail through periods of consolidation (sideways movements) and prepares them for potential breakouts. When used with proper risk management, other technical analysis tools, and proper trade setups, it can significantly improve the chances of success in the markets. However, it is advised to consult a financial advisor before investing.
Frequently Asked Questions (FAQs)
What Does the Rectangle chart pattern indicate?
The Rectangle chart pattern indicates indecision in the market. Both buyers and sellers don’t have the strength to push the price beyond the support and resistance levels, leading to a period of consolidation.
What are the risks associated with the Rectangle chart pattern?
The risks while using the Rectangle chart pattern are prolonged consolidation phases, adverse market conditions, false breakouts, etc.
Is there a difference between a Rectangle pattern and a Flag pattern?
The Rectangle pattern moves in a horizontal channel, and the Flag Pattern moves between parallel lines that have a slope against the prevailing trend, signaling a brief pause before the trend resumes.
Is it easy to identify the Rectangle pattern?
Yes, it’s easy to identify. Generally, after a strong trend, the stock enters a consolidation phase and remains between support and resistance levels, forming a Rectangle pattern.
Is the Rectangle chart pattern more reliable as a continuation or reversal pattern?
It can give a breakout in any direction, but generally, it is seen as a continuation pattern.