Knowledge about Candlestick patterns is extremely important in today’s financial markets as they help market participants predict future price movements. It is important to realize profits before the downtrend begins. One of the most popular patterns traders use to predict a bearish trend is the Closing Black Marubozu pattern.
In this blog, we will give information about the Closing Black Marubozu candle pattern, its interpretation, and how traders can use it effectively in their trading strategies.
What is a Closing Black Marubozu Pattern?
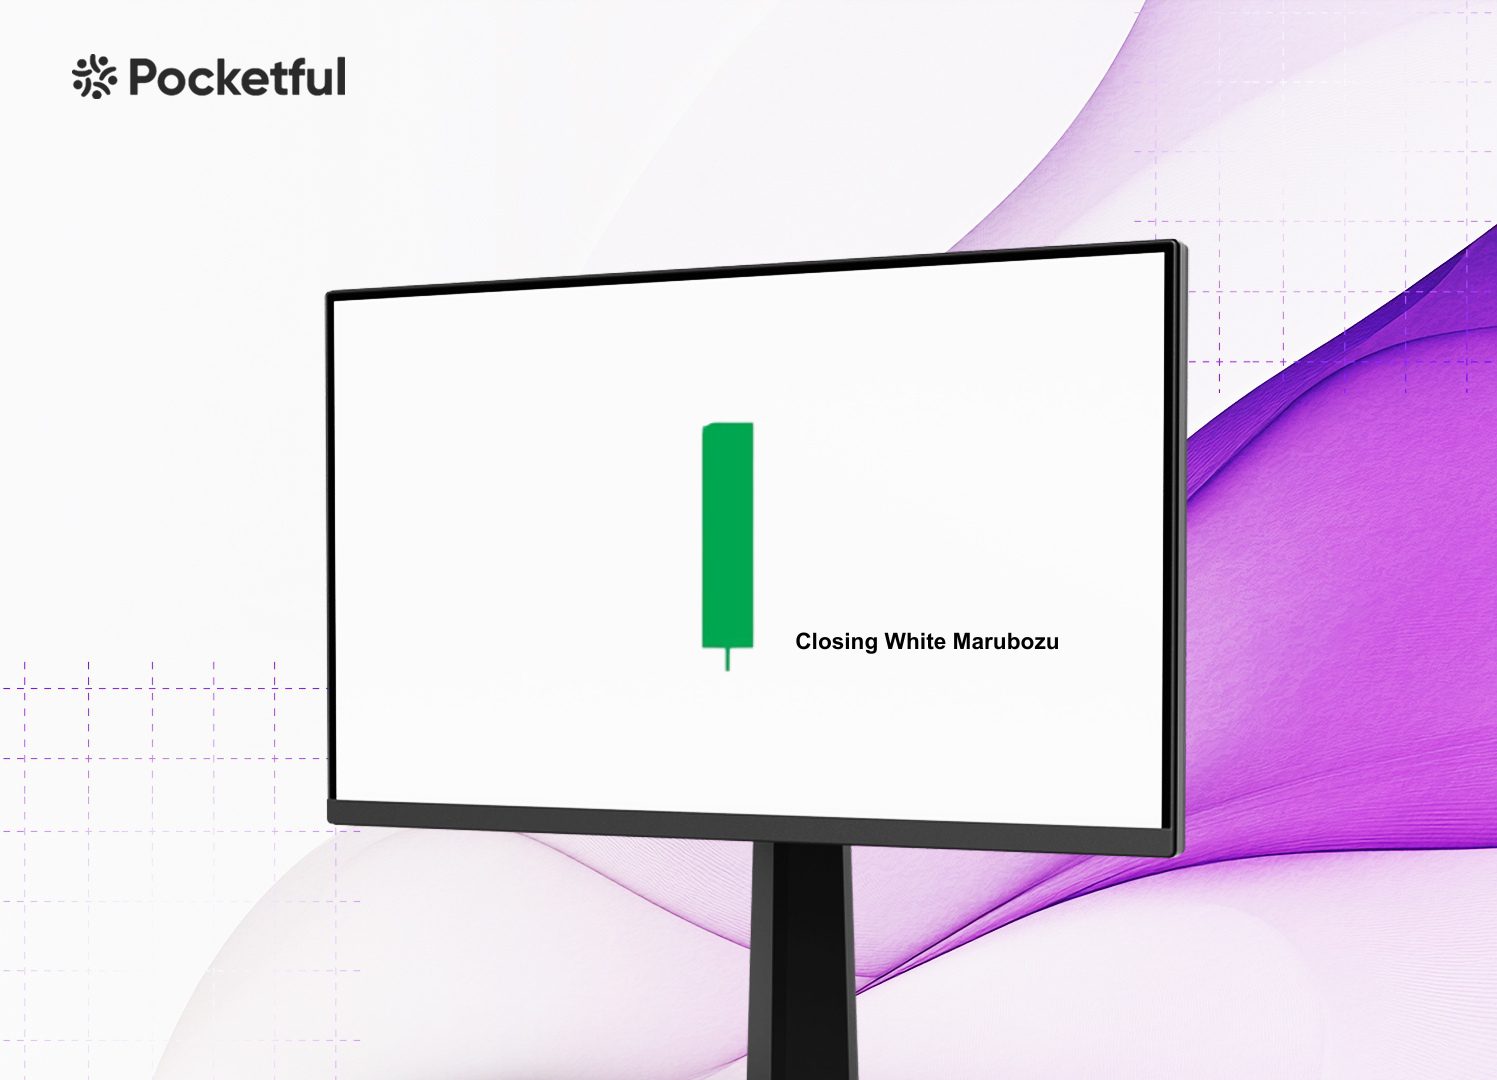
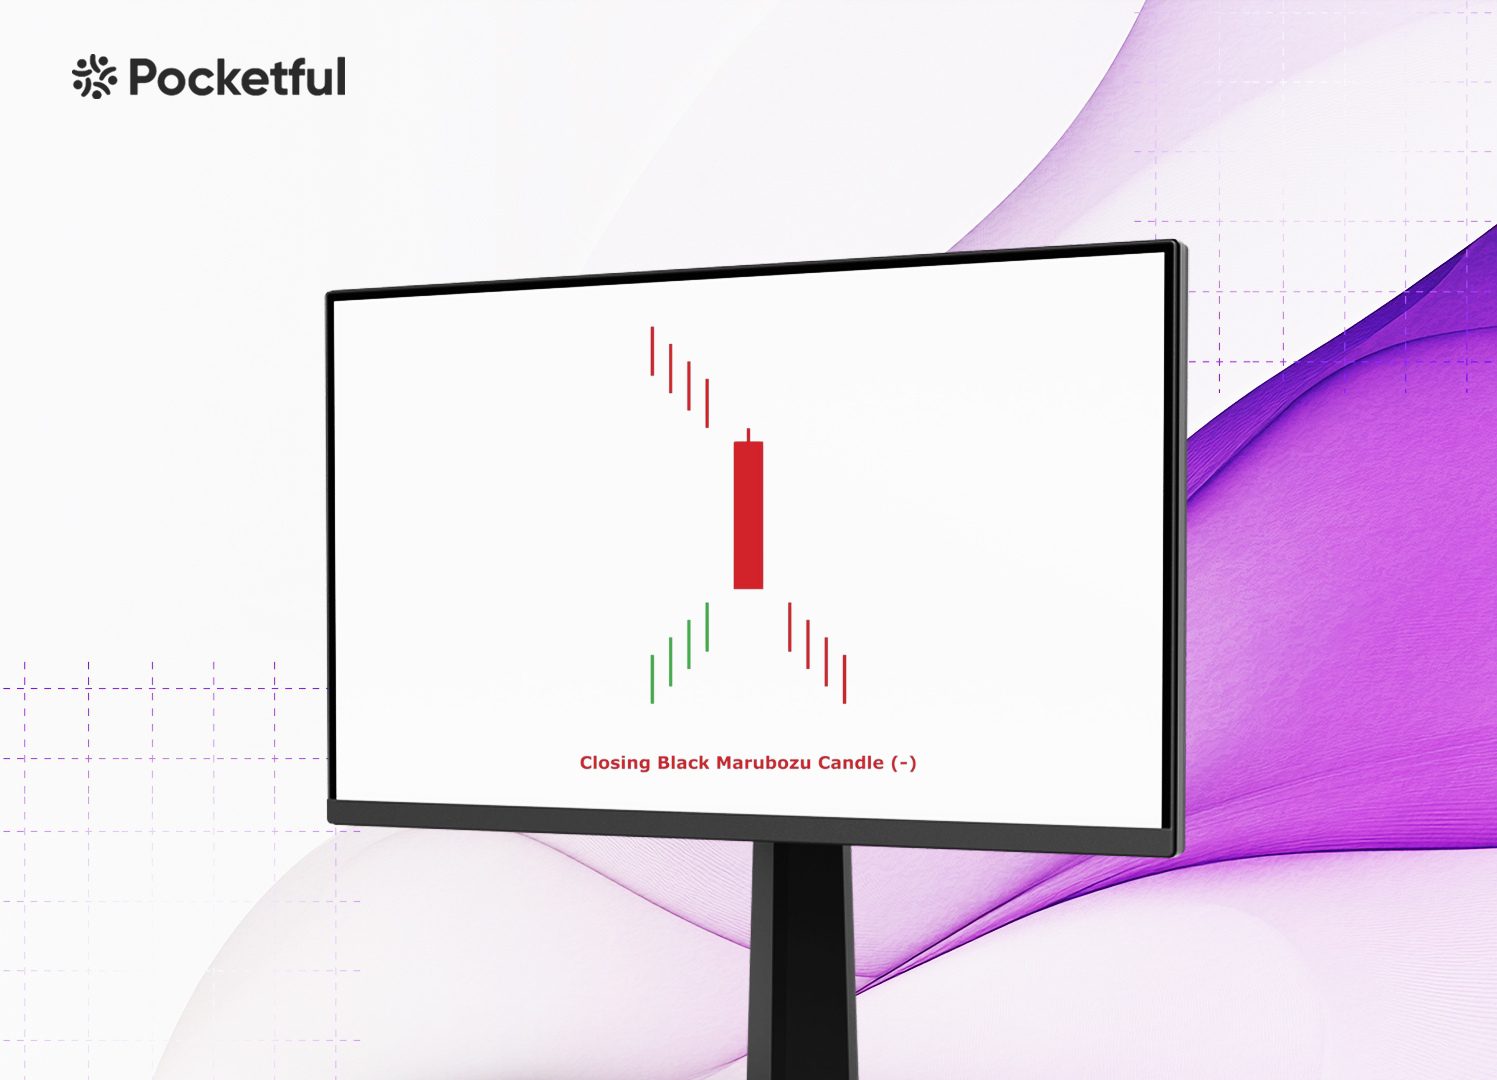
The Closing Black Marubozu is a bearish candlestick pattern and can either predict the continuation of an existing downtrend or the reversal of an existing uptrend. The key characteristics of a Closing Black Marubozu candle are:
- Candlestick: A Closing Black Marubozu candle has no lower wick and a small upper wick. The body of the candle is significantly longer than the upper wick.
As the pattern consists of a single candlestick, it is important to understand the market sentiment and other factors to use it effectively in trading strategies. Let’s look at the interpretation of the pattern.
Interpretation of the Candle
The key points to interpret from this pattern are:
- Strong Bearish Signal: The upper wick in the Closing Black Marubozu pattern indicates that buyers tried to push prices higher initially, but sellers were in complete control during the majority of the trading session.
- Possible Trend Reversal or Continuation: If the Closing Black Marubozu appears after an uptrend, it can signal a potential trend reversal. On the other hand, if it appears during a downtrend, it may indicate the strengthening of the bearish momentum, suggesting trend continuation.
How to Set Stop-Loss, Target, and Entry Point
When trading based on the Closing Black Marubozu pattern, it is extremely important to have a well-defined trading setup. Here’s how to set a stop-loss, target, and entry point:
- Entry: You can create a short position after the formation of the Closing Black Marubozu pattern. Some traders prefer to wait for a small pullback to enter, while others wait for a breakdown below the low of the pattern to confirm the bearish signal.
- Stop-Loss: A stop loss can be set above the high of the Closing Black Marubozu candle or a significant resistance level above the pattern.
- Target: The target for this trade can be set based on key support levels or by using a risk-to-reward ratio.
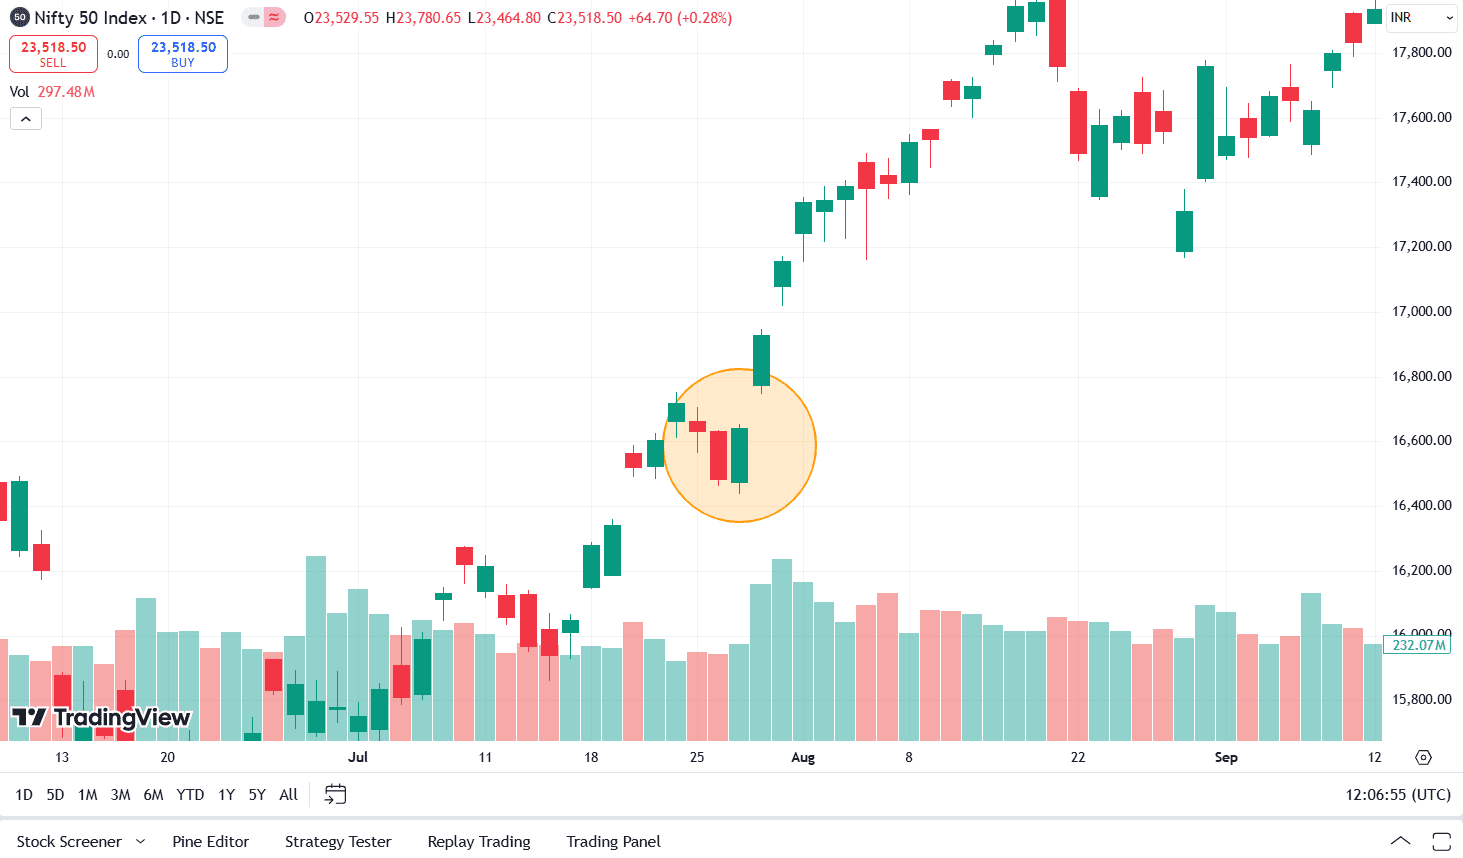
Closing Black Marubozu Pattern Example
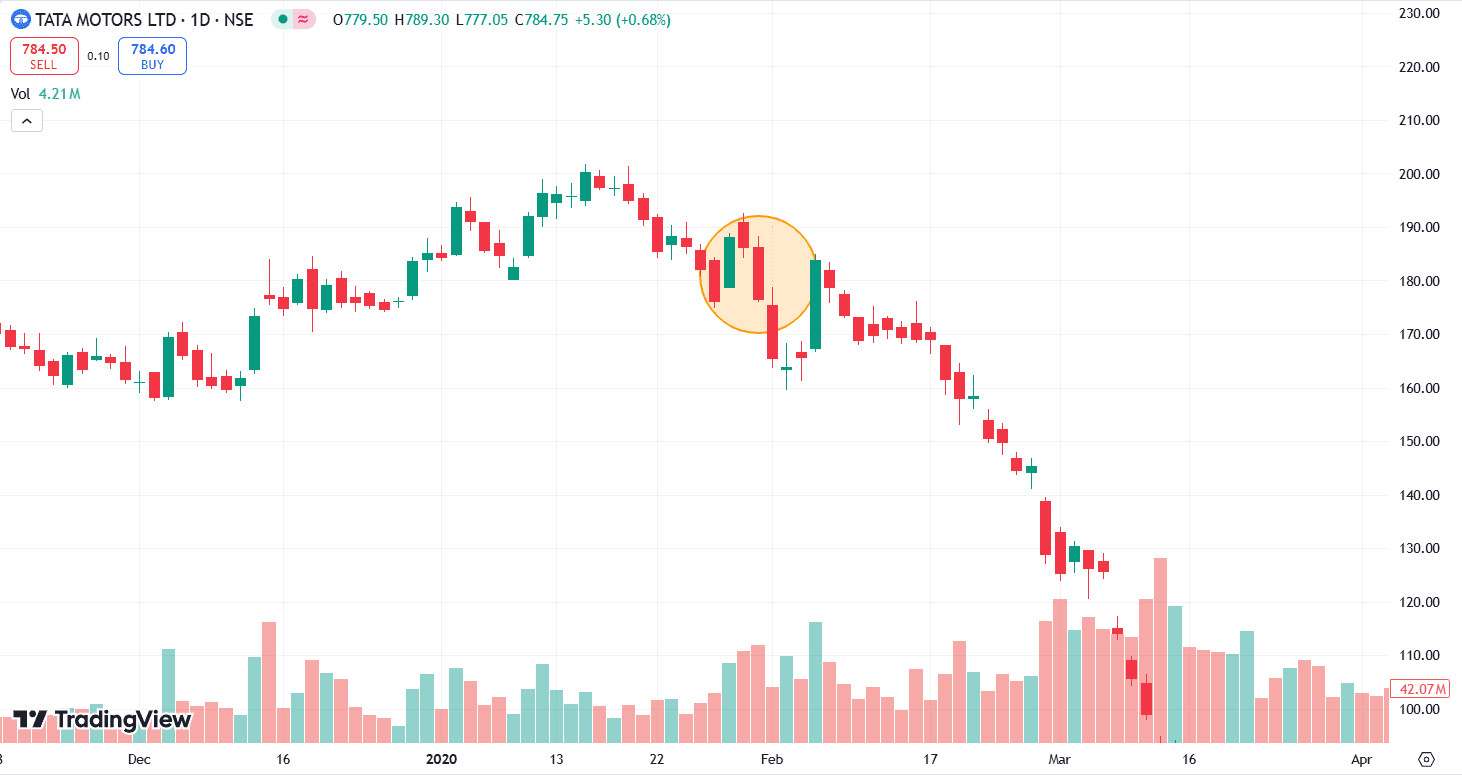
The above image shows the price chart of Tata Motors on a daily timeframe. The stock was in a downtrend and declined from INR 200 on 15 January 2020 to INR 175 on 28 January 2020. The formation of the Closing Black Marubozu pattern on 31 January 2020 confirms the continuation of the downtrend. The pattern closed at INR 176. Traders can create a short position at INR 165, i.e. the closing price of 1 February 2020, which acts as a confirmation candle to the pattern and place a stop loss near the high of the pattern, i.e. INR 188. There was a small pullback, and then the stock price started to decrease consistently. The stock price declined from INR 165 to INR 128 by 28 February 2020.
Read Also: Black Marubozu Candlestick Pattern
Advantages of the Closing Black Marubozu Pattern
The Closing Black Marubozu offers several advantages to traders:
- Clear Bearish Signal: The absence of a lower wick indicates that the sellers were in complete control near the end of the trading session.
- Can be used in different timeframes: The Closing Black Marubozu pattern can be used to trade in any timeframe, such as minute charts, daily charts, etc.
- Can be used with other Indicators: Traders often combine the pattern signal with other studies, such as volume analysis, RSI, MACD, etc., for more accurate bearish signals.
Disadvantages of the Closing Black Marubozu Pattern
Despite its advantages, the Closing Black Marubozu pattern does have its limitations:
- Unreliable in Sideways Markets: In volatile or sideways markets, the pattern may not result in the expected downward movement. Instead, stop losses can be triggered, resulting in losses.
- Lagging Indicator: The Closing Black Marubozu pattern consists of a significantly long bearish candle, which means a significant amount of bearish trend can be over before the trader creates a short position. Waiting for the pattern to completely form or a confirmation candle after the pattern could lead to late entries and lower profit potential.
- Ineffective in Strong Uptends: The pattern’s bearish signal can be useless if the other market factors indicate a bullish movement. The bullish trend could be due to a macroeconomic event or stock-specific news,
Read Also: Marubozu Candlestick Pattern: Means, History & Benefits
Conclusion
The Closing Black Marubozu is a powerful candlestick pattern that can be used to reliably predict bearish price movements. Its reliability increases when the pattern signal is combined with other indicators. However, like any trading pattern, it can generate false signals, which makes confirmation from other technical indicators crucial when trading this chart pattern. It is advised to consult a financial advisor before making trading decisions.
Frequently Asked Questions (FAQs)
What is the difference between a Black Marubozu pattern and a Closing Black Marubozu pattern?
A Black Marubozu pattern has no upper or lower wicks, while a Closing Black Marubozu pattern consists of a small upper wick.
Can I use the Closing Black Marubozu pattern in different market conditions?
The Closing Black Marubozu pattern generates reliable trading signals in trending markets, especially when combined with other technical analysis tools, but its reliability may decrease in choppy or sideways markets.
How to trade based on the Closing Black Marubozu pattern?
Individuals can use Closing Black to create a short position once the asset price gives a breakdown below the low of the pattern.
How can I determine a stop-loss in the Closing Black Marubozu pattern?
You can put a stop-loss near the high of the pattern.
What is the benefit of using a stop-loss?
Traders should have a stop-loss to minimize losses if the price reverses after creating a short position.