If you’ve looked at stock technical charts for a while, you’ve probably noticed how patterns in prices tell stories. These narratives, which are presented in candlestick language, assist traders in making educated guesses about potential future events. One of those tales is the Harami Candlestick Pattern, a straightforward two-candle arrangement that frequently suggests a trend reversal. Let’s explain this pattern’s meaning, how to spot it, and how traders apply it in actual markets in plain English.
What is the Harami Candlestick Pattern
“Harami” is a Japanese word that means pregnant. The Harami looks like a “mother” candle with a “baby” candle inside it. It is made up of two candles:
- The first candle is big and shows strong momentum in one direction.
- The second candle is small and sits entirely within the first candle’s body.
This small candle signals a pause. When this happens after a strong uptrend or downtrend, it could mean a reversal is expected in the near future.
How to Identify a Harami Pattern?
Spotting a Harami isn’t difficult once you understand the pattern.
Here is what to look out for while identifying;
- Find a trend – an uptrend or downtrend, and not a sideways market.
- Look for a large candle that moves strongly in the direction of the trend.
- The next day, see if you can see a smaller candle inside the first one’s body.
- The second candle shows doubt; traders are not sure, and the previous momentum is fading.
Read Also: Bullish Harami Candlestick Pattern
Types of Harami Pattern
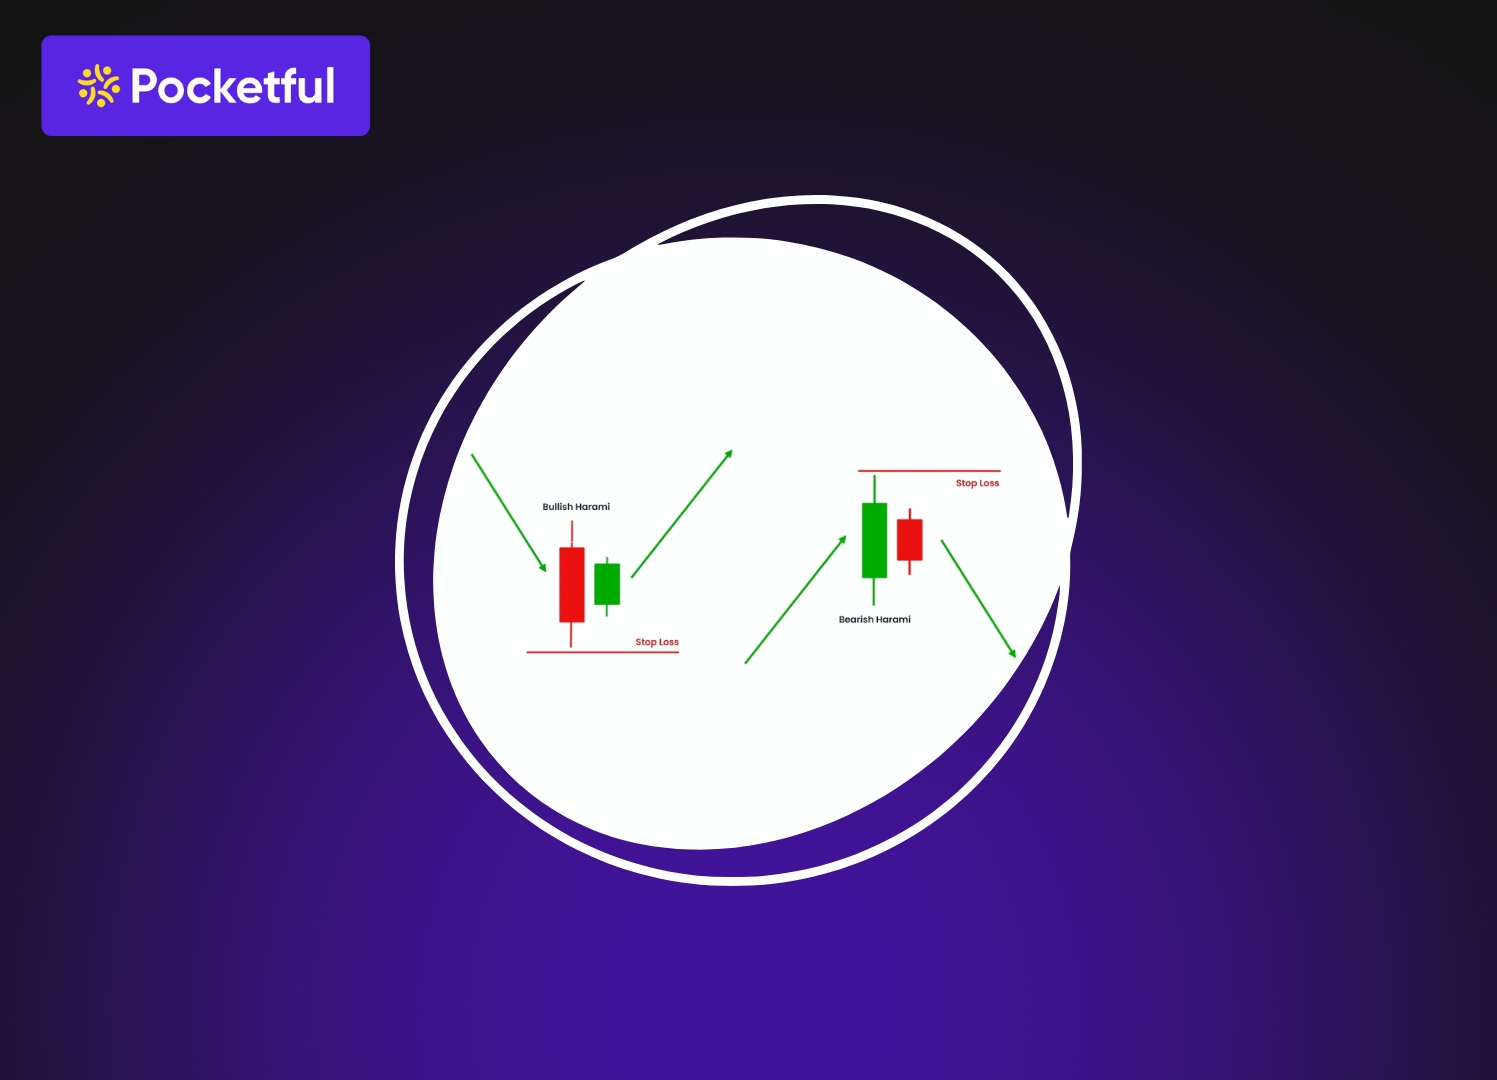
1. BULLISH HARAMI ( a digital image can be put)
This appears during a downtrend and suggests prices might turn upward soon.
- The first candle is bearish (red or black) with a long body, indicating that sellers are clearly in control.
- The second candle is bullish (green or white) and small, fully contained within the previous candle.
This pattern hints that selling pressure is fading away and buyers are stepping in.
Example – A stock has been falling for a week. One day, there is a long red candle, followed by a small green candle inside it. The next day, if prices go above that green candle’s high, that is confirmation that the reversal is likely real.
Entry, Stop Loss & Target
- Entry – After you see a Bullish Harami, wait for the next candle to close above the high of the smaller candle. This confirms the reversal.
- Stop Loss – Put your stop loss just below the low of the first bearish candle that is bigger. If the price falls below that, it usually means the downtrend is not yet over.
- Target – The next resistance level or a recent swing high can be your first target. You can also try for a 1:2 risk-reward ratio, which means you risk ₹1 to make ₹2.
2. BEARISH HARAMI (a digital image can be put)
This one forms during an uptrend and signals a possible move downward.
- The first candle is bullish with a large green body.
- The second is bearish and smaller, sitting inside the first green candle body.
This shows that buying strength is fading; sellers may be taking control.
Example – After several days of price gains, you find a big green candle followed by a small red candle inside it. If the next candle falls below the red one’s low, that is your sign of a possible weak trend.
3. Entry, Stop Loss & Target
- Entry – After a Bearish Harami forms, wait for the next candle to close below the low of the smaller candle to make sure there is selling pressure.
- Stop Loss – Place your stop loss just above the high of the first bullish candle. The trend may continue to rise if prices exceed it.
- Target – Your first target should be the next support level or the most recent swing low. Again, a risk-reward ratio of 1:2 or better is good for safer trades.
Read Also: Introduction to Bearish Candlesticks Patterns
Example
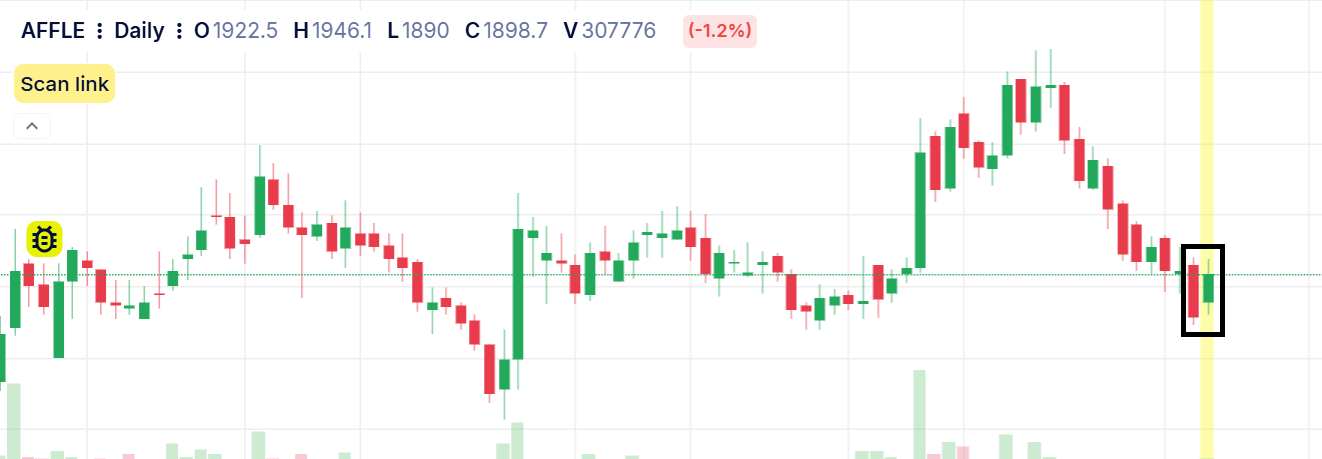
1. The example below shows the chart of AFFLE LIMITED on a daily timeframe. You can visibly see the formation of a Bullish Harami Pattern.
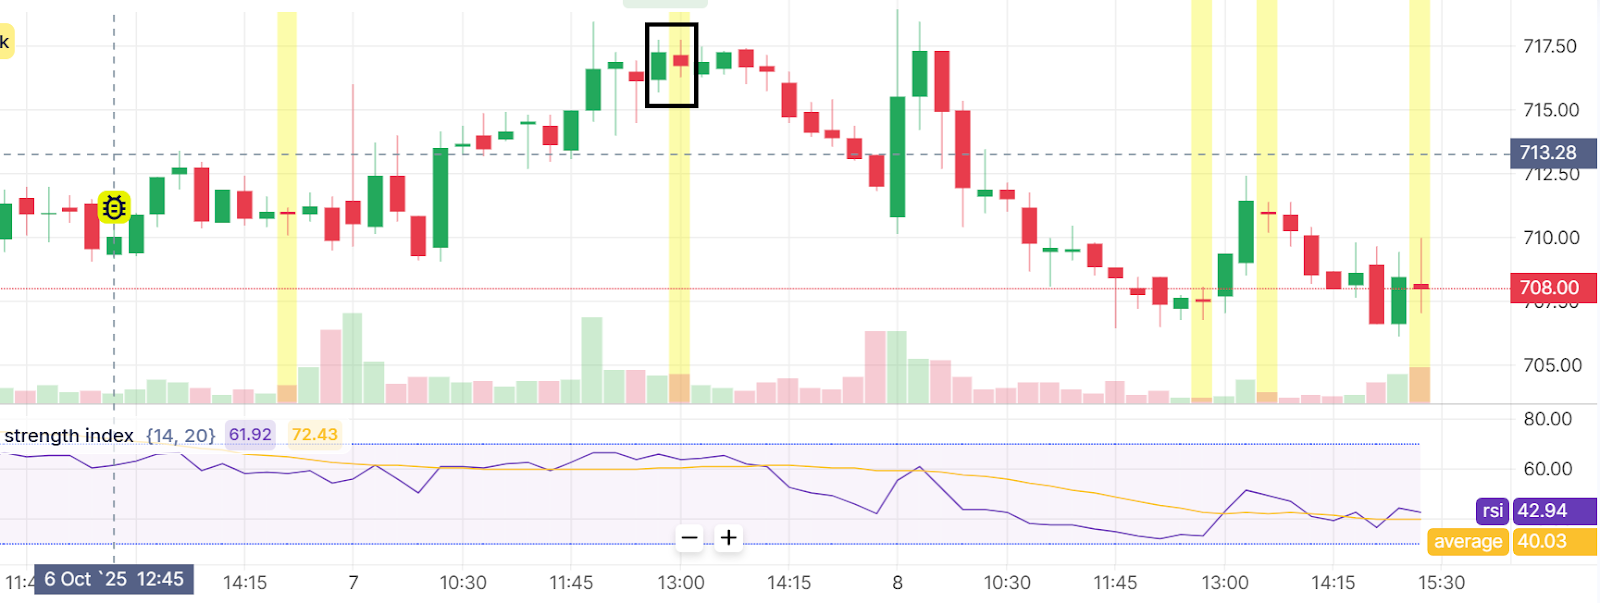
2. Below is the chart of TATA TECHNOLOGIES on a 15-minute timeframe where you can visibly the formation of a bearish harami pattern used in combination with RSI, which is also further followed by a downtrend.
Advantages
- Super Easy to Spot – You do not need to be an expert to recognise this candle pattern. It is made up of two candles, one big and one small, almost inside it.
- Works on Any Market or Timeframe – Whether you are into stocks or commodities, the Harami pattern forms across all kinds of charts. It also works on daily, weekly, or even hourly timeframes, which makes it flexible.
- Early Reversal Signal – The pattern often appears before a big move happens. It is like a hint that the current trend might be slowing down, giving you a chance to prepare for a possible change in direction.
Limitations
- Needs Confirmation – The Harami alone is not a “go” signal. You should always wait for a confirming candle or another indicator before entering a trade. Jumping in too early can land you in the wrong execution of trades.
- Not Great in Choppy Markets – If prices are moving sideways without a proper trend, you will probably see so many Harami-like patterns, most of which will not mean much.
- Can Give False Signals – In highly volatile markets, candles often overlap in ways that look like a Harami candle but do not indicate a reversal. That is why confirmation is so important.
Read Also: Blending Candlestick Patterns
Conclusion
The Harami Candlestick Pattern is simple to comprehend and can provide valuable insights into the inner workings of the market. For traders, this two-candle pattern can be a useful warning. But no candlestick pattern works like magic. Always use it in conjunction with other indicators, such as RSI or moving averages for double-checking, volume monitoring, or waiting for the next candle. When used properly, the Harami pattern can assist you in effectively managing risk and making better trading decisions.
| S.NO. | Check Out These Interesting Posts You Might Enjoy! |
|---|---|
| 1 | Three-Line Patterns |
| 2 | Bearish Engulfing Pattern |
| 3 | Rising Window Candlestick Pattern |
| 4 | Black Candle Pattern |
| 5 | High-Wave Candlestick Chart Pattern |
| 6 | What is a Stop Loss and How to Use While Trading? |
| 7 | Two-Candle Shooting Star |
| 8 | What are Candlestick Patterns? |
Frequently Asked Questions (FAQs)
How reliable is the Harami Pattern?
It is moderately reliable and is not something you should use to trade blindly. When used in combination with other technical indicators, it can be helpful.
Can I use the Harami pattern for intra-day trading?
Yes, you can spot it on the charts of any time frame. However, you need to be careful with short timeframes like 5-minute or 15-minute charts, as false signals can pop up more often.
Can this pattern appear in a sideways or range-bound market?
Yes, they can, but they are less reliable in a sideways market because there is no clear trend to reverse.
What is the difference between Harami and an Engulfing pattern?
They are almost opposites. In an engulfing pattern, the second candle completely covers up or engulfs the first one, suggesting a strong shift in momentum.
Does the size of candles matter in Harami Pattern?
It does! A bigger first candle and a noticeably smaller second candle show that people are less sure of what they want to do.