Larsen & Toubro Ltd. (L&T) is an Indian multinational company handling different business segments like engineering, construction, manufacturing, technology, and financial services.
Want to know how Larsen & Toubro is growing in the market? Today’s blog will cover all the essential aspects of the company’s business segment, financials, and SWOT Analysis.
Overview of Larsen & Toubro Ltd
Larsen & Toubro Ltd. holds a strong name in the Indian market. This company operates in the construction industry, specially civil infrastructure, transportation infrastructure, power transmission, and manufacturing defense & aerospace machinery.
The company was established by two Danish engineers, Henning Holck Larsen and Soren Kristian Toubro, in 1938 in Mumbai, Maharashtra. Currently, Larsen & Toubro Ltd operates in more than 50 countries across the Middle East, North Africa, South East Asia, and Europe.
In FY23, the company generated 62% of its revenue from India and the rest 38% from other countries. As of 31st March 2023, the L&T Group comprises 5 associates, 97 subsidiaries, and 15 joint ventures.
Here are some quick stats of the company
| Company Type | Public |
| Industry | Conglomerate |
| Founded | 1938 |
| Founders | Henning Holck-LarsenSoren Kristian Toubro |
| Headquarters | Mumbai, Maharashtra, India |
| Area served | Worldwide |
Major Subsidiaries
Some of the company’s subsidiaries are mentioned below:
Construction
- L&T Constructions
- L&T Realty
- L&T Metro Rail Hyderabad
EPC Projects
- L&T Power
- L&T Energy Hydrocarbon
Technology
- L&T Technology Services
Information Technology
- LTIMindtree
Manufacturing
- L&T Shipbuilding
- L&T Defence
Awards & Recognition
- 2020 – Company of the Year Award
- 2021 – Ranked 4th in the LinkedIn Top Companies list, India.
- 2022 – Ranked 2nd in the Top 25 EPC Contractors in the Middle East by Oil & Gas Middle East.
Business Model of Larsen & Toubro Ltd
The Larsen and Toubro business model focuses on diverse sectors including engineering, construction, manufacturing, and technology services for global markets.
L&T’s revenue has been structured into five broad categories:
- Construction – This segment covers a lot of construction-related projects around Buildings & Factories, Civil Infrastructure, Transportation Infrastructure, and Power Transmission & Distribution.
- Manufacturing – This segment covers Defence Equipment & Systems, Construction, Mining & Industrial Machinery, Heavy Engineering, Industrial Valves and Electrical & Automation Systems
- EPC Projects – This segment covers Hydrocarbon Engineering, Power, and Power Development.
- Services – L&T also provides expertise in IT solutions, data management, smart city infrastructure, and financial advisory services.
- Others – This segment caters to projects that do not lie in any other segment such as Hyderabad Metro, Infrastructure Development Projects, and corporate functions

Strategies
L&T is known for incorporating multiple strategies to retain and increase market share in the long run. Some of these strategies are:
- Activities: Larsen & Toubro Ltd. encompasses manufacturing, designing, and developing its products, as well as offering services to clients.
- Customer Relationships: The company provides extensive support via email and customer care numbers. It believes in building strong, familiar relationships with customers.
- Channels: One of the primary channels of the company is its business development and sales team. The company promotes its offerings through social media pages, advertising, websites, and conference participation.
- Value Proposition: The company creates accessibility by offering its clients a wide variety of options. It focuses on providing high-quality and robust solutions and services to its clients and customers in manufacturing and financial services.
Read Also: LTIMindtree Case Study: Products, Services, Financials, KPIs, and SWOT Analysis
Market Data of Larsen & Toubro Ltd
Some of the company’s market data is given below:
| Market Cap | ₹ 529,488 Cr. |
| TTM P/E | 41.86 |
| ROCE | 12.98 % |
| Book Value | ₹ 635.41 |
| ROE | 14.78 % |
| 52 Week High / Low | ₹ 3,860 / 2,168 |
| Dividend Yield | 0.64 % |
| Face Value | ₹ 2.00 |
Financial Highlights of Larsen & Toubro Ltd
Income Statement
| Particulars | Mar-23 | Mar-22 | Mar-21 | Mar-20 |
|---|---|---|---|---|
| Operating Revenue | 1,83,340.70 | 1,56,521.23 | 1,35,979.03 | 1,45,452.36 |
| Total Income | 1,89,162.20 | 1,63,493.02 | 1,42,107.15 | 1,50,398.09 |
| Total Expenditure | 1,58,936.85 | 1,36,594.88 | 1,14,907.47 | 1,23,235.42 |
| Profit before Tax | 17,109.03 | 14,494.97 | 8,679.78 | 13,430.95 |
| Profit after Tax | 12,624.87 | 10,291.05 | 4,668.96 | 10,167.75 |
| Consolidated Profit | 10,470.72 | 8,669.33 | 11,582.93 | 9,549.03 |
The company’s income statement shows a growing trend as the company’s revenue and profit increased by 17% and 20.7%, respectively in FY23
Balance Sheet
| Particulars | Mar-23 | Mar-22 | Mar-21 | Mar-20 |
|---|---|---|---|---|
| Current Liabilities | 1,62,065.99 | 1,59,360.85 | 1,37,404.81 | 1,42,745.04 |
| Non-Current Liabilities | 60,734.31 | 62,412.83 | 83,248.64 | 83,320.29 |
| Current Assets | 2,21,215.52 | 2,07,372.30 | 1,94,960.59 | 1,78,322.68 |
| Non-Current Assets | 1,04,163.20 | 1,09,024.06 | 1,13,609.88 | 1,21,603.66 |
The company’s balance sheet showcases a growing trend in current assets, which is fueled majorly by current liabilities. This approach limits debt growth in the long run.
Cash Flow Statement
| Particulars | Mar-23 | Mar-22 | Mar-21 | Mar-20 |
|---|---|---|---|---|
| Cash From Operating Activities | 22,776.96 | 19,163.58 | 23,073.82 | 6,693.88 |
| Cash Flow from Investing Activities | -8,311.70 | -3,667.68 | -5,658.52 | -8,256.27 |
| Cash from Financing Activities | -11,572.49 | -15,181.48 | -15,274.38 | 6,371.55 |
| Net Cash Inflow / Outflow | 2,892.77 | 314.42 | 2,140.92 | 4,809.16 |
The graph and table reveals a lot of turbulence in the company’s operations as it is diverting a significant amount of funds to pay-off debt and invest in new ventures.
Profitability Ratios
| Particulars | Mar-23 | Mar-22 | Mar-21 | Mar-20 |
|---|---|---|---|---|
| ROCE (%) | 12.98 | 11.61 | 9.97 | 12.49 |
| ROE (%) | 14.78 | 13.07 | 6.58 | 15.84 |
| ROA (%) | 3.92 | 3.29 | 1.52 | 3.51 |
| EBIT Margin (%) | 11.40 | 10.85 | 13.36 | 13.58 |
| Net Margin (%) | 6.67 | 6.29 | 3.29 | 6.76 |
| Cash Profit Margin (%) | 8.80 | 8.46 | 5.57 | 8.68 |
The company’s margin trend shows an uptrend, thus revealing a growth in the profitability. This growth is also reflected in ROCE and ROE.
Future Outlook
- The company expects EBITDA margin to be in the range of 8.5%-9% in FY24 from the earlier guidance of ~9%.
- Larsen & Toubro (L&T) aims to double revenue and order inflow by 2025-26 through a five-year strategic plan called Lakshya’26 that aims at exiting non-core operations and expanding the services business.
SWOT Analysis of Larsen & Toubro Ltd
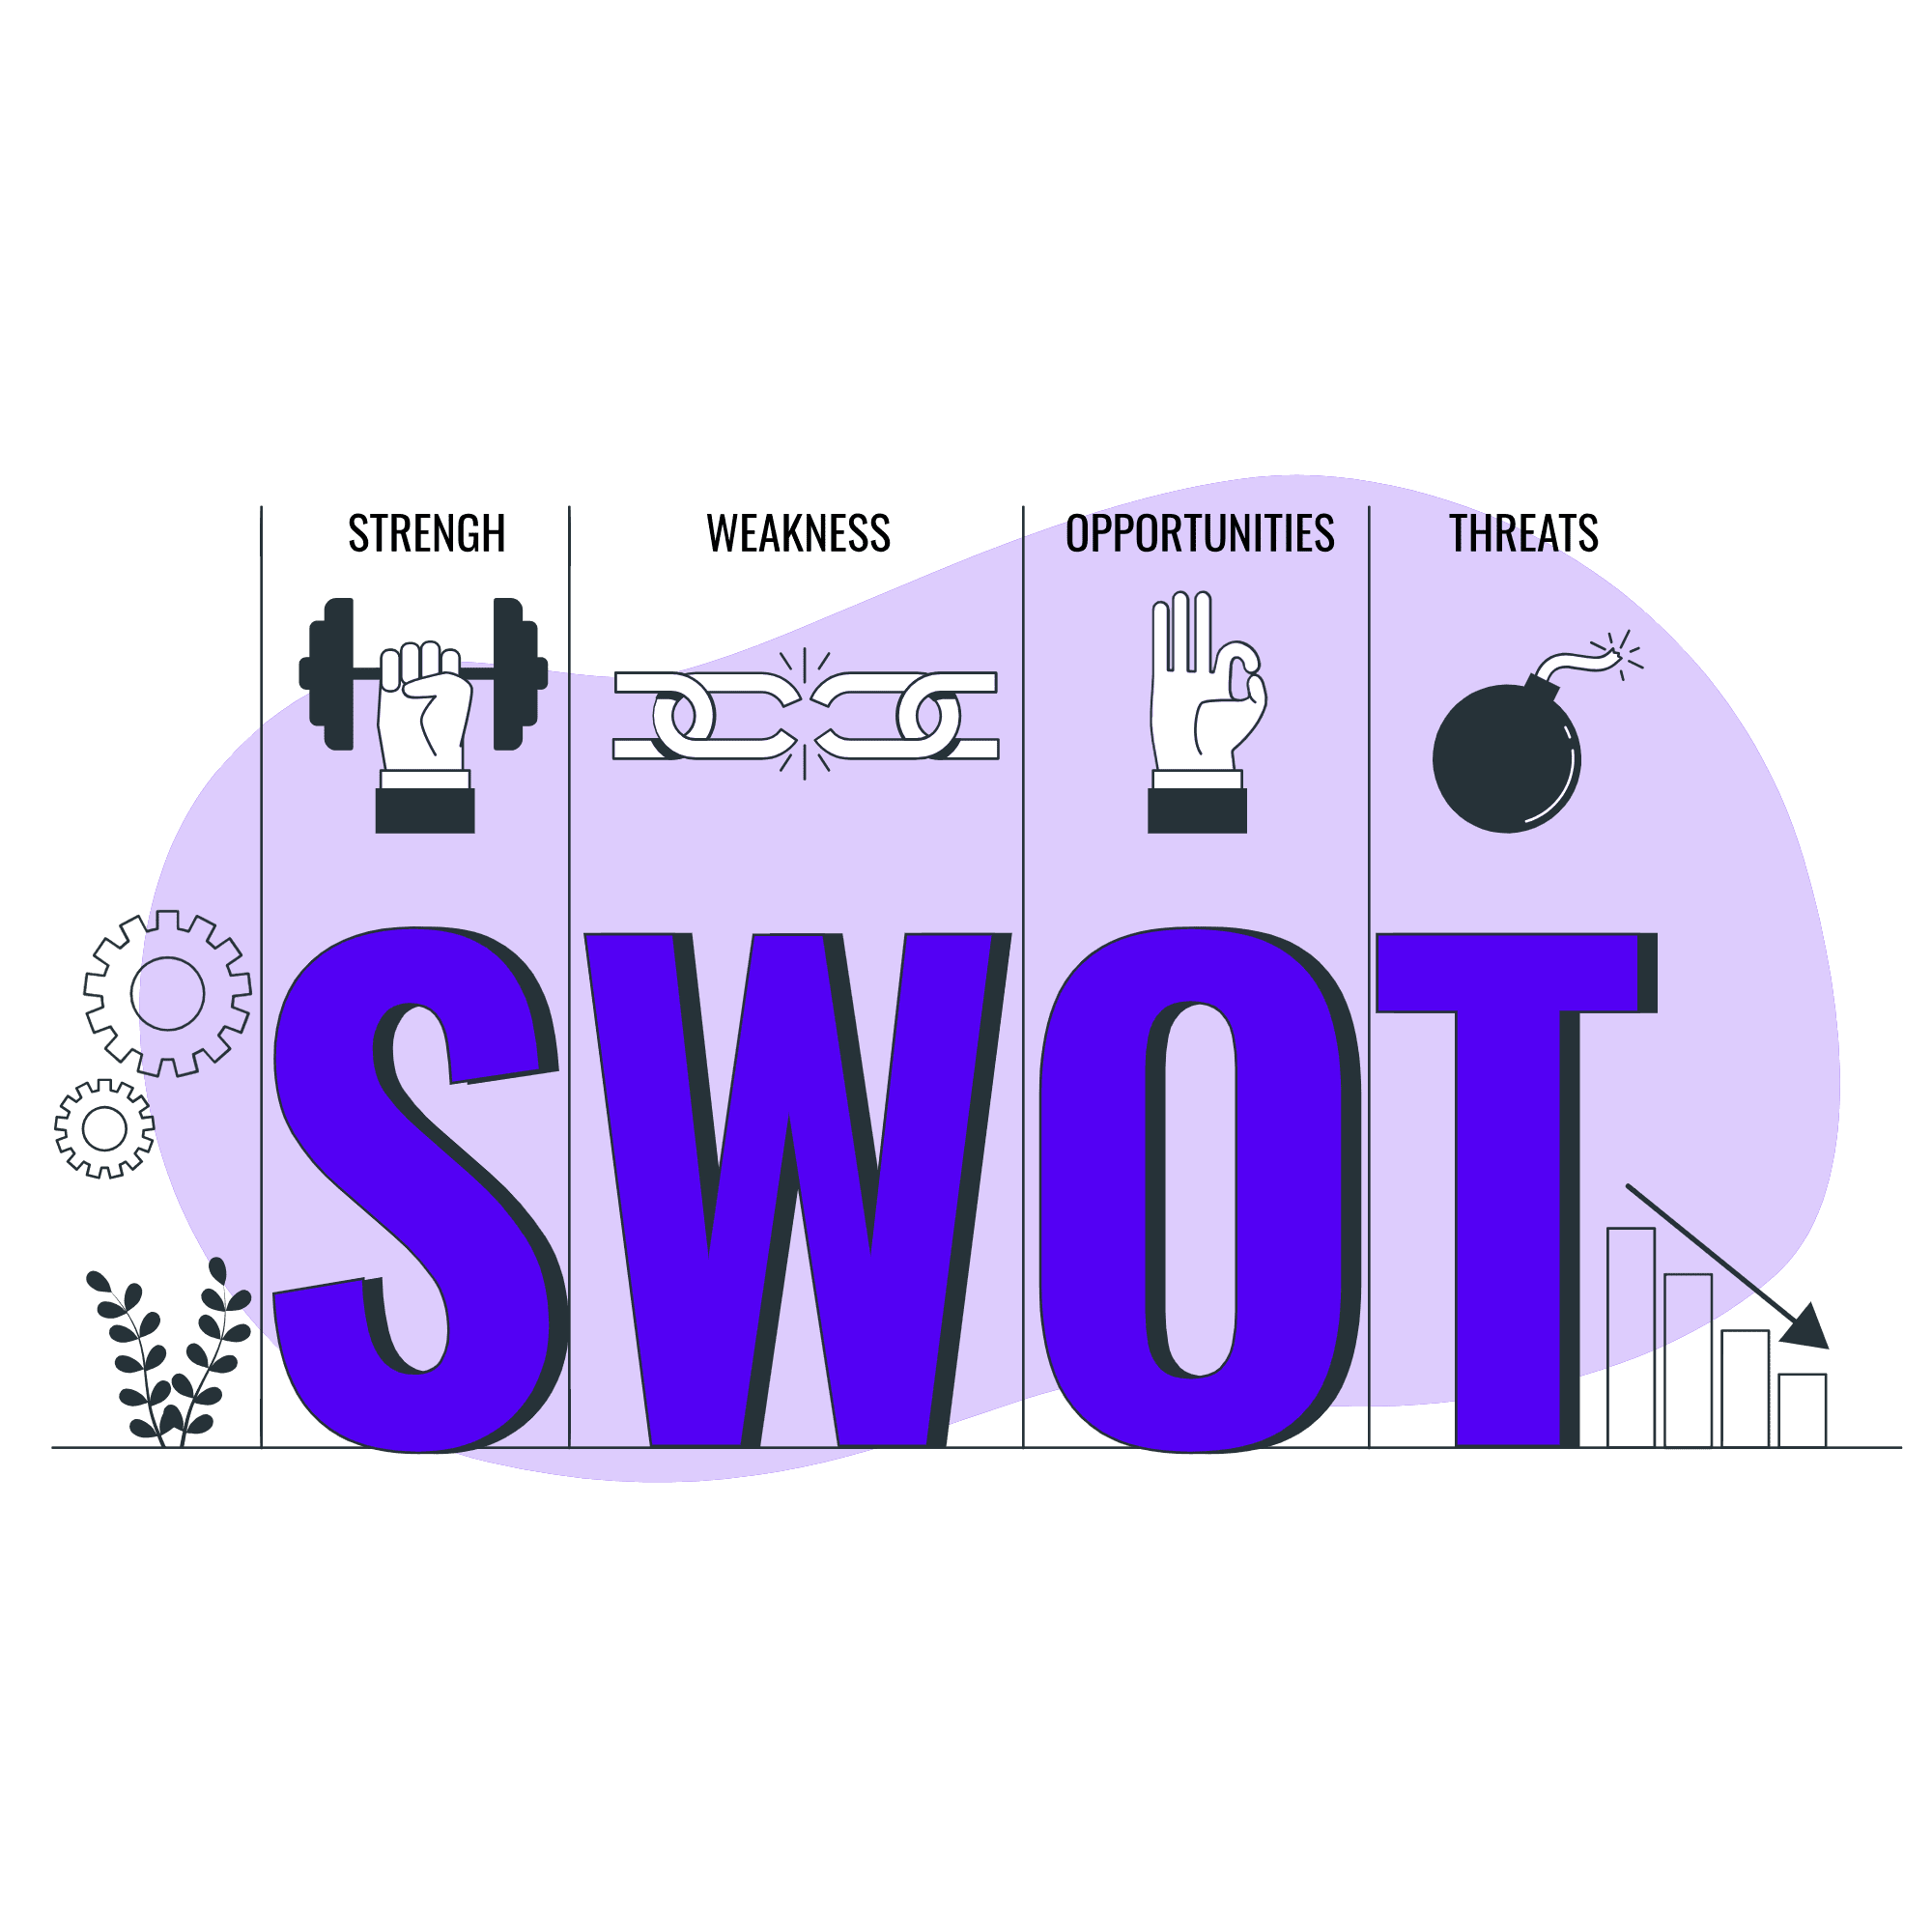
The SWOT Analysis of L&T highlights its strengths, weaknesses, opportunities, and threats, showcasing its market position and growth potential.

Strengths
- L&T Ltd. enjoys the benefits of brand identity and brand value in the construction and manufacturing segment, thus helping to increase trust in its clients.
- The company has a diverse business portfolio, which gives it an advantage in navigating different market conditions and capitalizing on opportunities in multiple industries, such as construction, engineering, and manufacturing.
- The company has a robust financial performance and also observed impressive revenue growth over the years.
Weaknesses
- L&T has been battling high debt, which can challenge the company’s financial stability and growth prospects.
- The company heavily depends on the domestic market for revenue; slight fluctuation in the market will also affect the company.
Opportunities
- The company must ensure that each acquisition aligns with its long-term goals and strengthens its core competencies.
- They must explore opportunities in international markets, particularly in some places experiencing rapid infrastructure development.
Threats
- L&T operates in a highly competitive atmosphere, facing competition from domestic players and global companies entering the Indian market.
- The company operates in an industry that has a history of exploiting environmental bodies
Read Also: Coal India Case Study: Products, Subsidiaries, Financials, KPIs, and SWOT Analysis
Conclusion
Larsen & Toubro Ltd has a strong presence in the global market. It has a diverse portfolio and has achieved impressive financial performance. The company aims to double its revenue and order inflow by 2025-26 through a strategic plan called Lakshya’26.
While the majority of the indicators point towards the company’s prosperous future, it is advised that you perform your analysis before investing your hard-earned money.
| S.NO. | Check Out These Interesting Posts You Might Enjoy! |
|---|---|
| 1 | Hindustan Unilever Case Study |
| 2 | Case Study on Apple Marketing Strategy |
| 3 | Reliance Power Case Study |
| 4 | Burger King Case Study |
| 5 | D Mart Case Study |
Frequently Asked Questions (FAQs)
Who was the founder of Larsen & Toubro Ltd?
Henning Holck-Larsen and Soren Kristian Toubro are the founders of L&T.
What are the services L&T provides?
The main services of the company are manufacturing, technology engineering, construction, information technology, military, and financial services.
Where was L&T founded?
L&T started its operation in Mumbai, Maharashtra, in 1938.
What is the plan of L&T in 2026?
L&T Financial Services aims to complete its transformation into a digitally enabled retail powerhouse by the end of the Lakshya 2026 strategic plan.
What is the market cap of L&T?
As of 10th April 24, the market cap of L&T is ₹ 529,488 Cr.

