Have you ever thought about how traders predict market movements using price action? It’s because of the patterns formed by the candlesticks. Understanding candlestick patterns is like having a secret tool for getting good at trading.
In this blog, we will learn about the Marubozu candlestick pattern. Market participants use many patterns, but the Marubozu candlestick is one of the best at showing strong upward or downward movements.
Overview
Before we begin, a thorough understanding of Candlesticks is important. We have written a blog on the same; you can read it here: What are Candlesticks Charts?
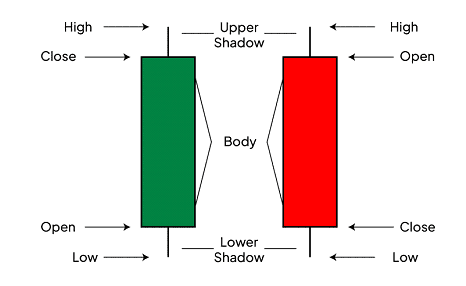
Have a look at the green and red candlestick below:
Coming to the Marubozu candlestick pattern, it is an important indicator in technical analysis. It offers valuable insights into market sentiment and price action. We will explore the significance of Marubozu candlestick pattern, its implication in both bullish and bearish scenarios, and how traders can analyze it to make informed choices.
What Is Marubozu Candlestick Pattern?
A Marubozu candlestick is a type of candlestick with no shadow or wicks. This pattern is named after the Japanese word “Marubozu,” which means “bald” or “shaven,” which indicates the absence of shadows on the candlestick. It consists of a single, long body and signifies a powerful and definitive price movement throughout a trading period. When there is no upper or lower shadow, it suggests that the opening and closing prices were high or low in the session, which signifies the amount of buying and selling pressure.
History of Marubozu
Munehisa Homma developed the Marubozu Candlestick pattern back in the 18th century. He was a successful rice trader who predicted market trends using historical price data. The word “Marubozu” means “shaven head” indicating a candlestick with no shadow and showing strong buying or selling power. A bullish Marubozu, which closes at the period’s high and has no shadow, indicates strong buying. A bearish Marubozu that closes at a period’s low with no shadow indicates strong selling pressure.
In 1991, the Marubozu patterns became popular in the world through Steve Nison’s book “Japanese Candlestick Charting Techniques,” and are now widely used to identify market trends and potential reversals.
Read Also: Closing Black Marubozu Candle
Characteristics of a Marubozu Candlestick
- No shadow: In the Marubozu candlestick pattern, there is an absence of lower and upper shadows.
- Long body: The body of a candle stick is long, reflecting significant price movement during the trading session.
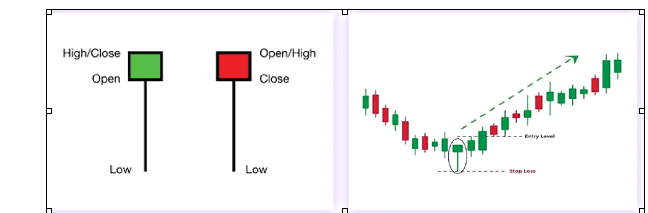
- Bullish and Bearish Marubozu: When the price opens at a low and closes at a high of the session, it is Bullish Marubozu. However, when the price opens at a high and closes at a low of the session, it is bearish Marubozu.
Bullish Marubozu
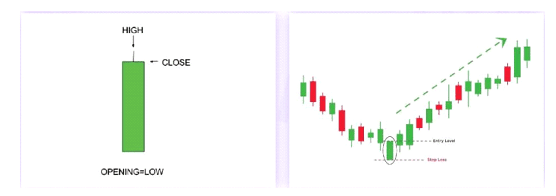
When the opening price is the same as the low and the closing price is the same as the high for a certain trading session, it signifies a bullish Marubozu pattern. Buyers were in charge of the whole session in this trend.
Implications of Bullish Marubozu
- Strong buying pressure: When a shadow is absent, it means that the buyers have dominated the session, continuously driving the price higher.
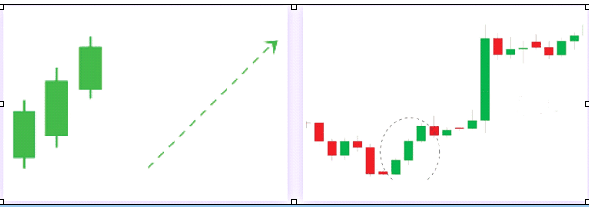
- Continuation of Uptrend: A bullish Marubozu, in an uptrend, shows that the trend is likely to continue as buyers maintain their momentum.
- Potential Reversal: A bullish Marubozu, in a downtrend or a consolidation phase, can indicate that the market sentiment is shifting from bearish to bullish.
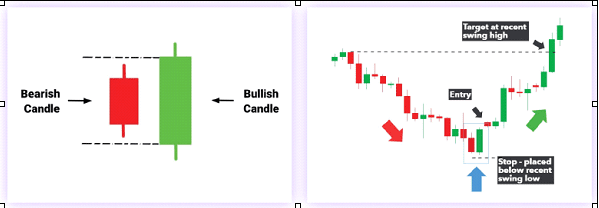
Bearish Marubozu
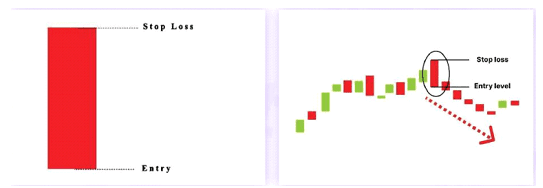
If the beginning and closing prices for a certain trade session match the high and the low, this signifies a bearish Marubozu pattern. The price closed to the day’s low with no lower wick, indicating significant selling pressure during the trading session.
Implications of Bearish Marubozu
- Strong selling pressure: When a shadow is absent, it means that sellers have dominated the session, continuously driving the price lower.
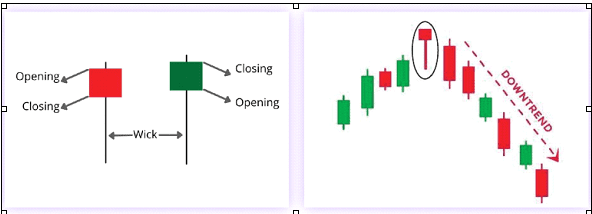
- Continuation of a downtrend: A bearish Marubozu, in a downtrend, shows that the trend is likely to continue as sellers maintain their momentum.
- Potential Reversal: A bearish Marubozu, in an uptrend or a consolidation phase, can signal a potential reversal, indicating that the market sentiment is shifting from bullish to bearish.
Benefits of the Marubozu Pattern
- Clear and decisive signals: The good thing about Marubozu patterns is that they are easily understandable. When there is no shadow, it means there is no room for confusion. This gives traders clear and decisive signals about the market direction.
- Strong emotions of the market: Whether bullish or bearish, the sentiments of the market can be seen in Marubozu formations. This helps traders determine market sentiments and execute trades that fit the mood.
- Flexibility in different periods: From minute charts to weekly charts or even monthly charts, the Marubozu patterns can be used at different time frames. As they can be used in multiple time frames, they are useful for all kinds of traders, from day traders to long-term investors.
- Universal Application: Traders can make use of Marubozu patterns across all asset classes, such as equities, currencies, commodities, etc.
Risks and Limitations of Marubozu Candlestick Pattern

- False signals: Marubozu patterns generally create strong signals, but don’t always work. When markets are sideways (not moving much), the possibility of false signs will increase. Further, the shorter the time frame, the higher the chances of getting false signals.
- Dependence on other factors: Sometimes traders make bad trading decisions because they rely solely on the Marubozu patterns and do not consider other technical indicators and analysis. Therefore, other technical indicators and research tools such as RSI, moving averages, volume analysis, etc., should always be used as a backup.
Read Also: White Marubozu Pattern
Conclusion
In summation, if you’re a newcomer or an experienced trader, the Marubozu candlestick pattern is useful as it clearly indicates the sentiment of underlying. Traders can make use of Bullish and Bearish Marubozu patterns to improve their trading methods and make informed decisions.
However, for a strong confirmation and to avoid false signals, it is advisable to use Marubozu patterns along with other technical indicators and tools such as volume analysis, support and resistance levels, overall sentiments, macro indicators, etc.
Frequently Asked Questions (FAQs)
How can the Marubozu pattern be used?
Marubozu patterns are used to identify strong market trends and potential reversal points, and can often be combined with other technical indicators for confirmation.
Why are there no shadows on a Marubozu candlestick?
It is because in Marubozu, the price opens at one extreme (high or low) and closes at the other extreme, showing consistent movement in one direction.
Can a Marubozu pattern appear in any time frame?
Yes, it can appear at any time frame, from minutes to months, making it a convenient tool for different trading styles.
Should the Marubozu pattern be used alone for trading decisions?
Well, it is suggested to use the Marubozu pattern with other technical indicators to increase the reliability.
What is the difference between a Marubozu and other candlestick patterns?
Other candlestick patterns may have shadows, but Marubozu candlesticks have no shadows, indicating strong unidirectional market sentiments.