Are you aware that leading FMCG Companies in India produce the products you use daily, such as body wash, toothpaste, and fruit juice? As an FMCG company, HUL and ITC are the names with which almost every household is familiar.
In this blog, we will compare Hindustan Unilever Ltd. (HUL) and India Tobacco Company Ltd. (ITC).
ITC Ltd. Overview
ITC Ltd. was established in 1910 and was then known as the Imperial Tobacco Company of India Limited. The business changed its name thrice: first as Indian Tobacco Company in 1970, then as I.T.C. Limited in 1974, and was finally renamed as ITC Limited in 2001. The company’s headquarters are in Kolkata.
Over the last 10 years, the firm has developed a wide range of over twenty-five premium Indian brands. Their “Nation First: Sab Saath Badhein” ideology aims to create a prosperous and globally competitive enterprise. ITC Limited has been using renewable sources of energy to meet nearly 50% of its energy needs. The company began operating in the hospitality industry in 1975, opening its first hotel in Chennai. In 2001, the company entered the branded packaged foods industry, selling items such as biscuits, noodles, and confectionery. Today, the company has been active in six different sectors, including FMCG, hotels, Agri Business, paperboards & specialty papers, information technology, and packaging.
The history of Hindustan Unilever dates back to 1888 when the individuals at the Kolkata harbor noticed crates of Sunlight soap bars. Sunlight soap was the first product that the Lever brothers, founded by William Hesketh Lever and James Darcy Lever, introduced in the Indian market. However, the soap had the label “Made in England by Lever Brothers” on it. In 1895, Lifebuoy and other famous brands like Pears, Lux, and Vim were launched soon after.
Hindustan Vanaspati Manufacturing Company, Unilever’s Indian subsidiary, was established in 1931. Soon, the Lever Brothers India Limited and United Traders Limited were established in 1933 and 1935, respectively. These businesses came together to form Hindustan Lever Ltd. in 1956. The company renamed itself Hindustan Unilever Limited later in 2007. The company’s headquarters is in Mumbai. In June 2023, Rohit Jawa replaced Sanjiv Mehta as CEO of Hindustan Unilever Limited.
In 2020, the firm bought GlaxoSmithKline Consumer Healthcare Limited, which helped them increase their market share and diversify their product line to include brands like Boost and Horlicks. HUL’s diverse product line includes personal care, beverages, packaged foods, water purifiers, and others.
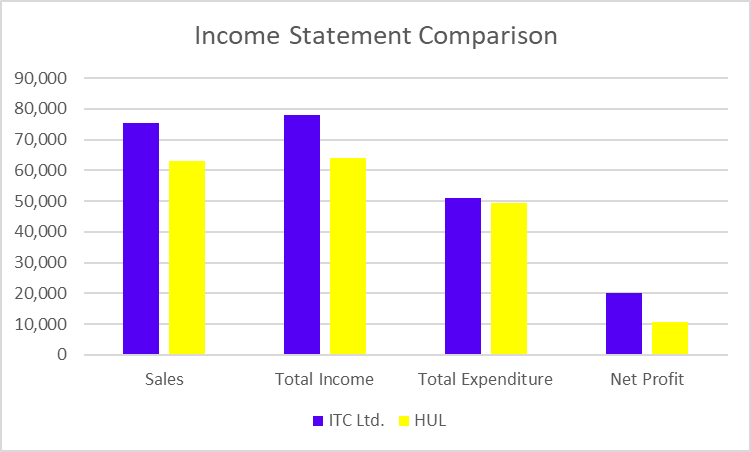
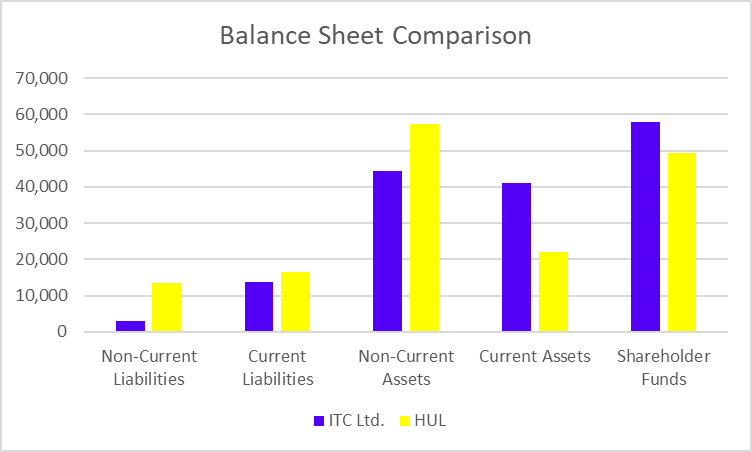
(The figures mentioned are in INR crores unless stated otherwise)
Balance Sheet Comparison (FY 2025)
Particular
ITC Ltd.
HUL
Non-Current Liabilities
2,987
13,488
Current Liabilities
13,690
16,537
Non-Current Assets
44,253
57,414
Current Assets
41,065
22,051
Shareholder Funds
57,950
49,402
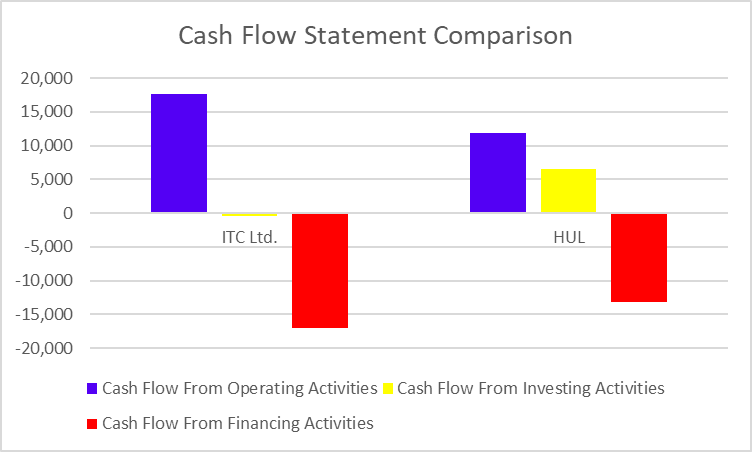
(The figures mentioned are in INR crores unless stated otherwise)
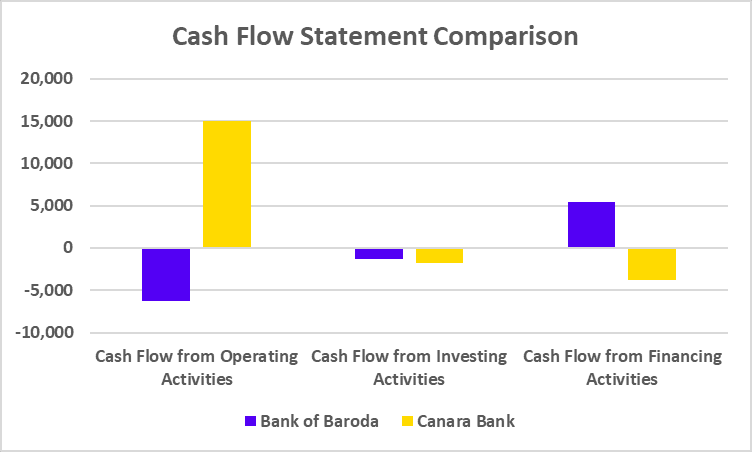
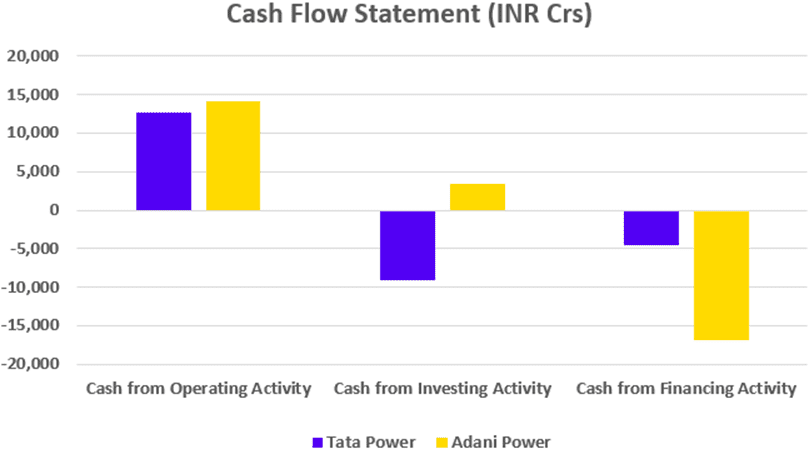
Cash Flow Statement Comparison (FY 2025)
Particular
ITC Ltd.
HUL
Cash Flow From Operating Activities
17,627
11,886
Cash Flow From Investing Activities
-395
6,473
Cash Flow From Financing Activities
-17,037
-13,101
(The figures mentioned are in INR crores unless stated otherwise)
Key Performance Indicators
Particular
ITC Ltd.
HUL
Net Profit Margin (%)
46.38
16.91
ROE (%)
49.61
21.55
ROCE (%)
36.41
22.91
Current Ratio
3.06
1.33
Debt to Equity Ratio
0
0
(All the above data is of the year ended March 2025)
Conclusion
To sum up, ITC and HUL are well-known FMCG companies with a diverse range of products. To expand their market share, both companies have bought several local competitors. The demand and earnings for fast-moving consumer goods (FMCG) remain stable and will rise in tandem with population growth and an increase in disposable income. Before making any investing decisions, it is advised to consult a financial advisor.
S.NO.
Check Out These Interesting Posts You Might Enjoy!
Among HUL and ITC Ltd., which company has the larger market capitalization?
HUL has a higher market capitalization than ITC Ltd.
What is the full form of HUL and ITC Limited?
The full form of HUL is Hindustan Unilever Limited, and ITC Limited refers to the Indian Tobacco Company.
Which company is more profitable: HUL or ITC Limited?
HUL has posted a net profit of 10,649 crores, whereas ITC Limited has reported a profit of 35,196 crores for the FY 2025, indicating that ITC Limited is more profitable.
Does ITC Ltd. have hotels?
ITC Ltd. operates more than 140 hotels at more than 90+ destinations.
Where is the headquarters of Hindustan Unilever located?
The headquarters of Hindustan Unilever is located in Mumbai, India.
In today’s world, it can be a challenging task to select the best bank to keep your excess funds and invest in. Numerous public and private-sector banks offer individuals a wide variety of products and services to choose from.
In today’s blog article, we will compare the State Bank of India and the Bank of Baroda.
Bank of Baroda Overview
Maharaja Sayajirao Gaekwad, the king of Baroda, founded the bank in 1908 to support the local economy. The bank and other commercial banks were nationalized by the Indian government later in 1969. Between 1970 and 1990, the bank witnessed a period of expansion. The bank established branches in the United States and a few other locations, including London, Dubai, Hong Kong, and New York. Bank of Baroda is India’s third-largest public sector bank after merging with Dena Bank and Vijaya Bank in 2019. With more than 11,000 ATMs and 8200 branches nationwide, the company is active in more than 17 countries. In addition to providing essential banking services, the bank offers loans to nearly every sector of the economy. The bank’s main office is in Vadodara, Gujarat.
SBI Overview
SBI is India’s most significant public sector bank and a giant of the country’s banking industry, with an extensive history of over 200 years. The headquarters of SBI is in Mumbai.
The Bank of Calcutta, the first joint stock company in British India, was established in 1806, marking the beginning of SBI. In British India, three distinct presidential banks—the Bank of Bengal, the Bank of Bombay, and the Bank of Madras—emerged. In 1921, the three presidential banks united to establish the Imperial Bank of India.
The Imperial Bank of India was nationalized by the Indian government in 1955 and was renamed the State Bank of India. Later, SBI bought several commercial and state-affiliated banks.
In 2017, the State Bank of India merged with its five affiliated banks—State Bank of Bikaner and Jaipur, State Bank of Hyderabad, State Bank of Mysore, State Bank of Patiala, and State Bank of Travancore. This merger increased the banks’ efficiency and demonstrated the significant contribution SBI has made in the expansion of banking services into rural areas. SBI currently has a robust distribution network with 65,627 ATMs and 22,405 branches.
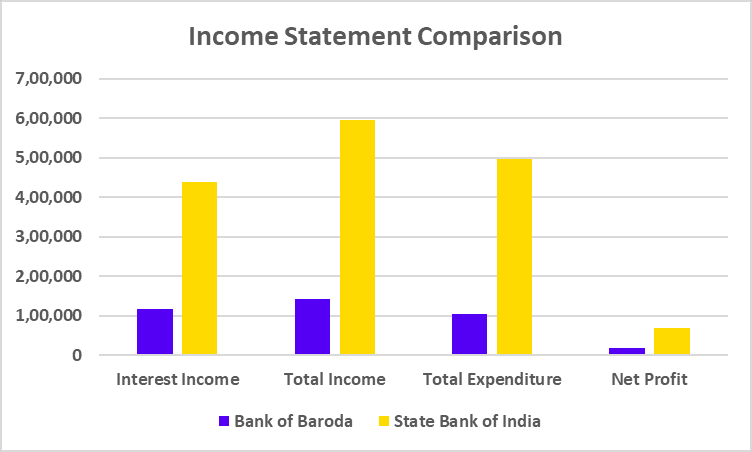
In conclusion, major players in the banking industry, such as the State Bank of India and Bank of Baroda, provide several services to customers. From the data above, we can see that SBI has a higher net profit than Bank of Baroda, but Bank of Baroda has a slightly higher net interest margin. Before making any financial decisions, you should take your risk tolerance into account, even if SBI has a greater number of branches around the nation.
S.NO.
Check Out These Interesting Posts You Might Enjoy!
Which bank, State Bank of India or Bank of Baroda, has a larger market capitalization?
Compared to the Bank of Baroda, the State Bank of India has a larger market capitalization.
Where is the State Bank of India’s headquarters located?
The State Bank of India’s headquarters is situated in Mumbai.
Which bank is more profitable: Bank of Baroda or SBI?
SBI is more profitable than Bank of Baroda, as SBI reported a net profit of 68,224 crores as compared to a net profit of 18,471 crores for Bank of Baroda for FY 2024.
Which bank has the most branches: Bank of Baroda or SBI?
SBI has 22,405 branches, which is more than Bank of Baroda’s 8,200 branches.
Who is the chairman of the State Bank of India?
As of 30 August 2024, Mr. Challa Sreenivasulu Setty has been serving as the chairman of the State Bank of India.
The Indian auto industry is a powerhouse driven by a thriving tyre sector that keeps its wheels turning. The Indian tyre industry showcases a diverse range of companies, each with its unique strengths and specialities.
In today’s blog, we will compare MRF and Apollo Tyres.
MRF Overview
MRF is an Indian multinational tyre manufacturing company with its headquarters in Chennai, Tamil Nadu. Founded in 1946 by K.M. Mammen Mappillai, it started as a toy balloon manufacturing unit and has grown into a tyre giant. The company manufactures a wide range of products, including tyres for two-wheelers, cars, trucks, and even airplanes. It also manufactures tyres, treads, tubes, conveyor belts, paints, and toys.
MRF is the largest tyre manufacturer in India and ranks among the top 20 globally. They are well-recognized for their high-quality tyres and extensive reach across the country.
It was incorporated as a private company, Madras Rubber Factory Limited, and began tyre production in partnership with an American company, Mansfield Tire & Rubber Factory.
MRF has a wide distribution network in India, serving retail stores, dealerships, and car manufacturers. The company sells tyres directly to manufacturers (B2B) for factory use and also has a strong presence in the replacement tyre market for individual consumers (B2C).
They achieve this reach through an extensive network of franchised stores and dealers. The company focuses on offering excellent customer service through initiatives like roadside assistance programs and informative resources on its website.
Apollo Tyres Overview
Apollo Tyres Limited is an Indian multinational tyre manufacturing company headquartered in Gurgaon, Haryana. The company was established in 1972 by Onkar Kanwar, and since then, it has grown from a domestic Indian company to a global tyre manufacturer with a presence in over 100 countries. Apollo caters to a wide range of segments, including passenger vehicles, two-wheelers, trucks, buses, and light trucks.
In the 1990s, Apollo Tyres expanded globally with an ambitious strategy. The company acquired manufacturing facilities in the Netherlands in 2009 to better serve the European market.
The company employs a multifaceted business model, successfully integrating manufacturing, branding, and a customer-centric approach. This strategic blend enables the company to effectively compete in the highly competitive global tyre market.
(The figures mentioned above are in INR crores unless stated otherwise)
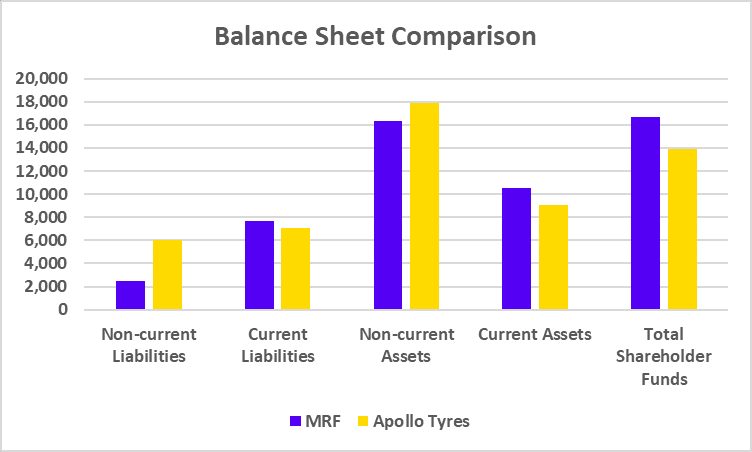
Balance Sheet Comparison (FY 2024)
Particular
MRF
Apollo Tyres
Non-current Liabilities
2,436
6,011
Current Liabilities
7,710
7,043
Non-current Assets
16,300
17,930
Current Assets
10,550
9,028
Total Shareholder Funds
16,703
13,902
(The figures mentioned above are in INR crores unless stated otherwise)
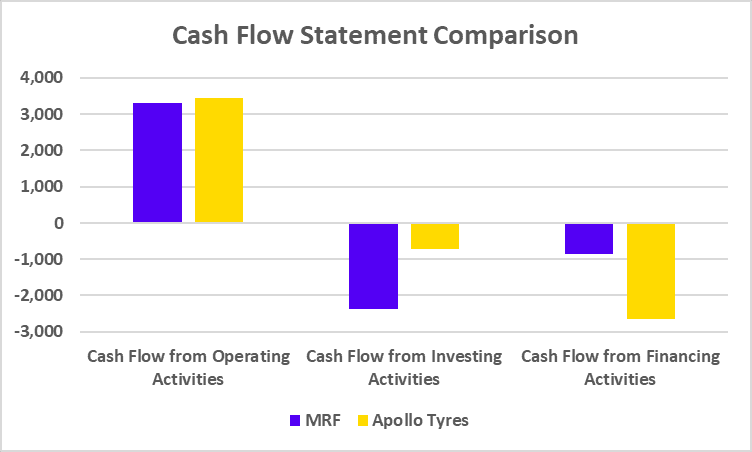
Cash Flow Statement Comparison (FY 2024)
Particular
MRF
Apollo Tyres
Cash Flow from Operating Activities
3,300
3,439
Cash Flow from Investing Activities
-2,379
-710
Cash Flow from Financing Activities
-868
-2,659
(The figures mentioned above are in INR crores unless stated otherwise)
Key Performance Indicators
Particular
MRF
Apollo Tyres
Net Profit Margin (%)
8.26
6.78
ROE (%)
12.46
12.38
ROCE (%)
16.40
15.68
Current Ratio
1.37
1.28
Debt to Equity Ratio
0.12
0.28
(all the above data is of the year ended March 2024)
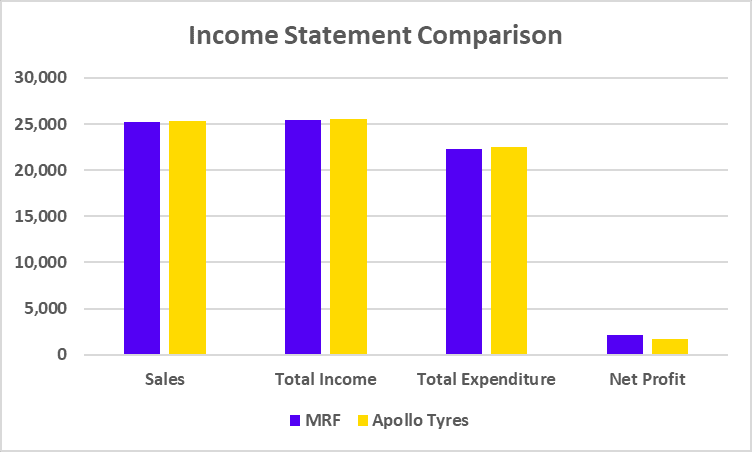
Conclusion
The comparison between MRF and Apollo Tyres presented above leads us to conclude that while both MRF and Apollo Tyres have comparable sales, MRF posts higher net profit margins. Moreover, MRF has a slightly higher ROE and ROCE metric as compared to the metrics of Apollo Tyres. However, it is advised to speak with an investment expert before making investment decisions.
S.NO.
Check Out These Interesting Posts You Might Enjoy!
Choosing between the shares of PNB and Bank of Baroda (BoB) has been a tough call for many investors. While PNB boasts a wider network and customer base, BoB is a potent player across borders due to its innovative use of modern technology.
In this blog, we will discuss their financial health, growth potential, and risk factors to aid investors in choosing which stock better fits their goals amid evolving market dynamics and economic conditions.
Punjab National Bank Overview
Punjab National Bank is one of the oldest and largest public sector banks in India, set up in 1894. The bank, established in Lahore by the great national leader, Lala Lajpat Rai, has spread over a vast area with a substantial all-India network of over 10,000 branches and 13,000 plus ATMs and serves over 180 million customers. Its legacy includes surviving the partition of India in 1947 and several mergers, the most notable being those with Oriental Bank of Commerce and United Bank of India in the year 2020, which put it on its way to becoming the second-largest public sector bank in the country.
At PNB, the business model focuses on universal banking, which comprises a wide range of products and services encompassing retail, corporate, international, and treasury segments. Other retail banking services include savings and current accounts, fixed deposits, home and auto loans, and credit cards. Term loans, cash management, trade finance, and other services are also available to corporate customers.
Punjab National Bank has substantial assets and is focusing on aggressively enhancing its digital channels through mobile banking, internet banking, and payment wallets. The bank has an international footprint through branches in countries like the UK, Hong Kong, and Dubai, mainly for trade finance and remittances.
Bank Of Baroda Overview
Bank of Baroda, set up on 20th July 1908 by the Maharaja Sayajirao Gaekwad III in Vadodara, Gujarat, is among the biggest PSBs in India. BoB has over 115 years of legacy and has grown to serve more than 153 million customers globally through a huge network of more than 8,200 domestic branches and more than 11,600 ATMs, with 96 overseas offices in more than 17 countries. It finally merged with Vijaya Bank and Dena Bank in 2019 to further consolidate its market position and emerge as the third-largest bank in India in terms of assets.
BoB is working on the universal banking model with a complete range of products and services across retail, corporate, international, treasury, and rural banking. It offers retail customers various services, including savings and current accounts, fixed deposits, home and personal loans, credit cards, and insurance. For corporate clients, BoB offers working capital loans, project finance, cash management, and trade finance.
With its substantial assets, BoB is increasingly working to achieve digital transformation and improve mobile banking, internet banking, and other miscellaneous digital payment solutions. BoB is a big player in the Indian banking industry, having a huge footprint across the globe with diversified service offerings and a strong focus on expanding digital and international banking services.
From the comparison between Punjab National Bank and Bank of Baroda, it is found that both banks have an extensive network and strong market presence. However, the Bank of Baroda has a slightly higher net interest margin and significantly higher dividend yield than Punjab National Bank. However, both banks are facing asset quality problems and regulatory issues. Investors are always advised to consult a financial advisor prior to making any investment in the stock market.
S.NO.
Check Out These Interesting Posts You Might Enjoy!
How does PNB differ from BoB from a digital banking perspective?
Both banks are investing heavily in digital banking; however, BoB is well underway in its digital transformation journey with comprehensive mobile and internet banking solutions as compared to PNB.
How do PNB and BoB differ in terms of international operations?
BoB has a much larger international presence than PNB, with 96 overseas offices in 17 countries, while the latter has only two international branches.
Bank of Baroda or PNB, which bank is more digitally active?
Bank of Baroda is more digitally active and aggressively expanding its presence in digital banking channels and solutions than PNB.
How about their branch networks?
The domestic branch network of PNB is over 10,000 branches, whereas BoB operates more than 8,200 branches across India.
India’s healthcare sector is experiencing rapid growth, fueled by factors like rising disposable incomes, increasing healthcare costs, and a growing elderly population. Healthcare is crucial to human society for preventing diseases, diagnosing illnesses, treating conditions, and managing injuries.
In this blog, we will compare Apollo Hospitals and Fortis Healthcare.
Apollo Hospitals Enterprises Overview
Apollo Hospitals is India’s largest private healthcare provider and a global leader in integrated healthcare services. Dr. Prathap C. Reddy founded it in 1983, and it has led India’s healthcare revolution. The group provides a comprehensive range of services through a network of 73 hospitals across India and abroad, Apollo Pharmacy chains, primary care and diagnostic clinics, remote healthcare consultations, etc.
They introduced several groundbreaking medical procedures in India, such as coronary artery bypass surgery, organ transplantation, and telemedicine.
Fortis Healthcare Overview
Fortis Healthcare is one of the top healthcare services providers in India. It has many hospitals, clinics, and diagnostic centers in the country and abroad. The company is well-known for its wide range of medical services, advanced technology, and commitment to patient care. It was established in 1996 with the opening of the first Fortis Hospital in Mohali, Punjab. The acquisition of the healthcare division of the Escorts Group was a pivotal moment in Fortis’s growth. This move expanded its presence and strengthened its position in the healthcare market in India. The healthcare brand also has a presence in countries like UAE, Nepal, and Sri Lanka. Fortis offers various medical services like cardiology, oncology, orthopedics, neurosciences etc.
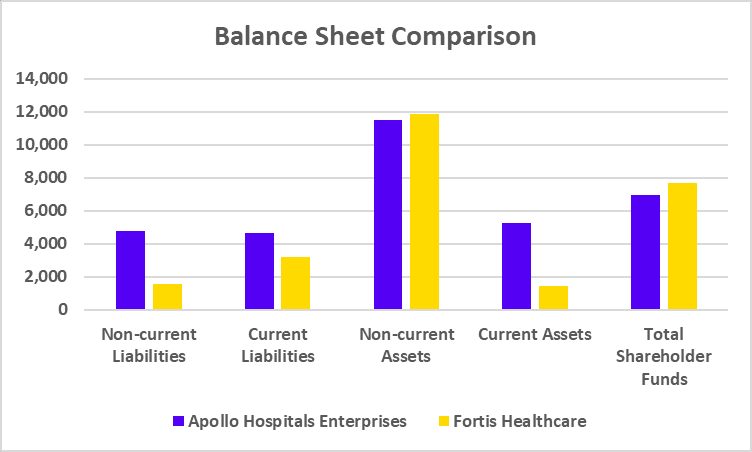
(The figures mentioned above are in INR crores unless stated otherwise)
Balance Sheet Comparison (FY 2024)
Particular
Apollo Hospitals Enterprises
Fortis Healthcare
Non-current Liabilities
4,768
1,562
Current Liabilities
4,665
3,170
Non-current Assets
11,473
11,868
Current Assets
5,280
1,421
Total Shareholder Funds
6,935
7,663
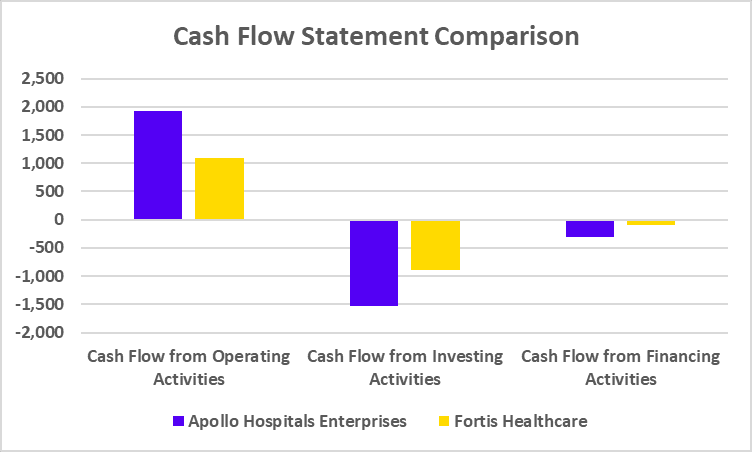
(The figures mentioned above are in INR crores unless stated otherwise)
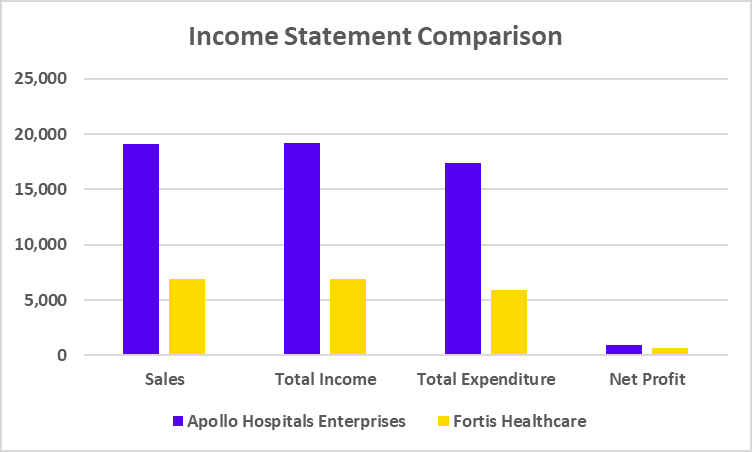
Cash Flow Statement Comparison (FY 2024)
Particular
Apollo Hospitals Enterprises
Fortis Healthcare
Cash Flow from Operating Activities
1,920
1,100
Cash Flow from Investing Activities
-1,537
-886
Cash Flow from Financing Activities
-311
-86
(The figures mentioned above are in INR crores unless stated otherwise)
Key Performance Indicators
Particular
Apollo Hospitals Enterprises
Fortis Healthcare
Net Profit Margin (%)
4.81
9.22
ROE (%)
12.95
7.81
ROCE (%)
14.97
9.52
Current Ratio
1.13
0.45
Debt to Equity Ratio
0.46
0.11
(all the above data is of the year ended March 2024)
Conclusion
The comparison between Apollo Hospitals and Fortis Healthcare presented above leads us to conclude that while Apollo Hospitals has higher net profit, Fortis Healthcare posts higher net profit margins. Moreover, Apollo Hospitals has a higher ROE and ROCE metric than Fortis Healthcare. However, it is advised to speak with an investment expert before making investment decisions.
S.NO.
Check Out These Interesting Posts You Might Enjoy!
Every new investor entering the market has two questions, one related to the cheapest stocks to invest in and the other one about which companies have the most expensive stock in India. Some companies in India have such a high market price that may surprise you. Interested in knowing about these companies? Read on.
In this blog, we will discuss the top 10 most expensive stocks in India.
Overview of the Top 10 Most Expensive Stocks in India
The overview of India’s top 10 most expensive stocks is mentioned below-
1. Elcid Investments Ltd
Elcid Investments is a holding company registered with the Reserve Bank of India (RBI) under the category of Investment Company. The company is promoted by the Vakil Family. Arvind Vakil, head of the family, was one of the 4 partners who started Asian Paints in 1942.It also has 2 wholly owned subsidiaries viz. Murahar Investments & Trading Co Ltd and Suptaswar Investments & Trading Co Ltd which holds 0.60% and 0.68% in Asian Paints respectively.It holds ~4.2% stake in the company which has a total value of ~9,996cr crores as on December 2022.
2. MRF Ltd.
K.M. Mammen Mappillai established the Madras Rubber Factory (MRF) in 1946. Before manufacturing tyres, the company began its journey as a toy balloon manufacturing unit. The company ventured into tread rubber manufacturing in 1952 and became a market leader in just four years. In 1961, the business partnered with USA’s Mansfield Tire & Rubber Company and opened its first manufacturing facility in Chennai. The company went public on the Indian Stock Exchange in 1961. The company manufactures a wide range of products, including tyres for two-wheelers, cars, trucks, and even airplanes. The company’s headquarters is in Chennai.
3. Honeywell Automation India Ltd.
Honeywell Automation India Ltd. was established in 1984 as a joint venture between the Tata Group and Honeywell International. The business was initially known as Tata Process Control Pvt. Ltd. In 1988, the company was listed on the Indian stock exchange and was renamed Tata Honeywell Ltd. In 2004, the company was again renamed Honeywell Automation India Ltd. when Honeywell International Asia Pacific Inc. purchased the stake of the Tata Group. The company operates in many sectors, such as aerospace, energy, healthcare, IT, life sciences, utilities, etc., and provides automation and control systems for commercial, residential, and industrial use. The company’s headquarters is in Pune.
4. Page Industries Ltd.
Sunder Genomal and his family established the business in 1994. The business signed an exclusive agreement with Jockey International Incorporation for the manufacture, distribution, and sale of Jockey goods in India, Sri Lanka, Bangladesh, Nepal, UAE, Oman, and Qatar. In 2005, the company went public on the Indian Stock Exchange. The business has increased its product range by obtaining an exclusive license from Speedo International Ltd. to manufacture, market, and distribute its products in India. The company’s headquarters is in Bangalore.
5. 3M India Ltd.
In 1987, 3M India Limited was established as a subsidiary of 3M Company, an American multinational corporation. The company provides specialist products for automotive, electrical, healthcare, and other sectors. The company was publicly listed in 1991. 3M India owns popular brands such as Scotch Brite, Nexcare, and Littman. With several production facilities dispersed throughout the nation, it efficiently meets the needs of both B2B and B2C markets. The organization’s headquarters is in Bangalore.
6. Bosch Ltd.
The company was established in 1886 by Robert Bosch in Germany. By 1897, the company became a market leader in ignition systems and became a major supplier to the automotive industry. The company set up a sales office in India in 1922 and operated only through imports for the next 30 years. Motor Industries Company Limited was founded in 1951, and Bosch instantly bought 49% of its stock. Both fuel injectors and spark plugs were produced there. The business opened its first manufacturing facility in Bengaluru, and over time, it established R&D facilities in Pune, Hyderabad, and Coimbatore, as well as another manufacturing facility in Nashik. In 1993, the company was listed on the Indian Stock Exchange. In 2008, MICO was renamed as Bosch Limited. In 2014, the company launched an eye-care solution in India and has since developed equipment for affordable eye care. The company’s headquarters is in Bangalore.
7. Abbott India Ltd.
Abbott India was established in 1910 and started operations as a marketing affiliate. It was founded as a subsidiary of Abbott Laboratories. The business provides more than 400 branded generic medicines in India, and its products are available at approximately 5,00,000 pharmacies nationwide. The company also provides diagnostic solutions, medical devices, and other nutritional products. The business purchased Piramal Healthcare Solutions in 2010 to strengthen its market position in the Indian pharmaceutical sector. The company’s headquarters is in Mumbai.
8. Shree Cement Ltd.
Shree Cements Ltd. was established by Benu Gopal Bangur in 1979. The company’s first manufacturing facility was set up in Rajasthan. To meet the needs of the Indian infrastructure sector, the company increased its cement manufacturing capacity and is currently India’s third-largest cement producer. In 2012, the company established a thermal power plant with a capacity of 300 MegaWatt. The company acquired Union Cement in 2018 to further expand its manufacturing capacity. Its main office is in Kolkata.
9. Procter & Gamble Hygiene and Healthcare Ltd.
The business was established in 1964 to manufacture and market Vicks range of products in India. The company was initially known as Richardson Hindustan Limited. The company began diversifying its product line in the 1980s and introduced Whisper and other feminine hygiene products. Ariel detergent was also launched in 1991 and is a well-known brand today. The organization’s headquarters is in Mumbai.
10. LMW Ltd.
Dr. G.K. Devarajulu established the business in 1962, and its primary business was manufacturing textile machinery. Subsequently, the business installed a state-of-the-art facility to generate superior castings for both domestic and international clients. In 2010, the company established an Advanced Technology Centre (ATC) to manufacture components for the aerospace and defense sector. The company’s headquarters is in Coimbatore.
In conclusion, the majority of India’s most expensive stocks have solid fundamentals. These firms’ stock prices are so high because the majority of them have not declared a stock split or bonus share. Because these equities typically have smaller volumes than other stocks, as an investor, make sure you speak with your investment advisor before investing in such a stock.
S.NO.
Check Out These Interesting Posts You Might Enjoy!
Elcid Investments ltd is the most expensive stock in India.
What are the top 5 expensive stocks in India?
Elcid Investments ,MRF, Honeywell Automation Limited, Page Industries Limited and 3M India Limited are the top 5 most expensive stocks in India.
What is the full form of MRF Limited?
The full form of MRF is Madras Rubber Factory.
Why is the stock price of MRF so expensive?
The stock price of MRF is high because the corporation has never declared a stock split, and a bonus issue was declared way back in 1975.
Is it safe to invest in expensive stocks?
Because most expensive stocks have good fundamentals, including financial performance, they are regarded as secure investment options. However, because expensive stocks often have low liquidity, it is advisable to consult a financial advisor before investing.
Selection Methodology and Important Disclaimer
The stocks included in this list are selected primarily on the basis of their market capitalisation, which represents the total market value of a company’s outstanding shares. The companies are arranged in descending order of market capitalisation, with larger companies appearing first, followed by relatively smaller companies. This methodology is intended to provide a structured approach for identifying companies based on their market size and overall presence within a sector.
However, market capitalisation should not be considered the sole factor while evaluating investment opportunities, as it does not guarantee future performance, profitability, or returns. Investors should also assess other important factors such as financial health, business fundamentals, management quality, valuation metrics, industry outlook, and market conditions before making investment decisions.
The information provided is for educational and informational purposes only and should not be construed as investment advice, recommendation, solicitation, or an offer to buy or sell any securities by Pocketful Fintech Capital Private Limited.
Two well-known banks with a long history of innovation and tradition stand out in India’s banking landscape: Canara Bank and Bank of Baroda. These financial institutions have survived economic shifts, political challenges, and societal changes for a long time.
Today’s blog explores the origins of these two banks, how they differ financially, and their rise to prominence.
Bank of Baroda – An Overview
The Bank of Baroda is a prominent Indian public sector bank with its headquarters in Vadodara, Gujarat. It is one of the largest banks in India and has a significant presence in both domestic and international markets.
BOB was established on 20 July 1908 in Baroda, with the support of Maharaja Sayajirao Gaekwad III of Baroda. It started its operations with INR 10 lakh and 28 staff members. In 1969, the Bank of Baroda underwent nationalization along with 13 other prominent banks in India, which was a crucial step by the government to exert control over the banking sector.
In 2018, the Bank of Baroda was merged with Vijaya Bank and Dena Bank, forming one of the largest public sector banks in India, with branches and subsidiaries spread across numerous countries, such as the UK, the US, the Middle East, and Africa.
Canara Bank – An Overview
Canara Bank is a major Indian public sector bank with its headquarters in Bangalore, Karnataka. The bank was founded in 1906 by Shri Ammembal Subba Rao Pai, a great visionary and philanthropist, making it one of India’s oldest banks.
It was initially established as a Canara Hindu Permanent Fund in Mangalore. In 1961, the bank acquired the Bank of Kerala and Seasia Midland Bank. Canara Bank was nationalized along with 13 other major banks in India as part of the government’s efforts to control the banking sector.
The bank has 13 subsidiaries or sponsored institutions in India and abroad. As of June 2024, Canara Bank services over 11.42 crore customers through a network of 9,627 branches and 12,256 ATMs/Recycler spread across all Indian states and Union Territories.
The Bank of Baroda and Canara Bank have a rich legacy and significant presence in the financial sector. Despite sharing similar characteristics, BOB and Canara Bank differ in terms of financial performance and range of services. Additionally, it is important to consider factors such as branch accessibility, digital banking capabilities, past financial performance, and the overall reputation of each bank before making an investment decision. However, it is advised to consult a financial advisor before investing.
S.NO.
Check Out These Interesting Posts You Might Enjoy!
What were the key changes experienced by banks after nationalization?
The banks experienced rapid growth, expanded their branch networks, and diversified their services.
Do the Bank of Baroda and Canara Bank have a digital presence?
Both banks have strong digital banking platforms, offering internet banking, mobile banking, etc.
Which bank is better for personal banking?
An individual needs to select a bank based on his/her specific needs and preferences. Further, it is suggested that both banks be compared on every metric before making any decision.
Has Canara Bank been involved in any mergers and acquisitions?
In 1961, Canara Bank acquired the Bank of Kerala and Seasia Midland Bank and recently underwent a merger with the Syndicate Bank in 2020.
Do the Bank of Baroda and Canara Bank have international operations?
Both banks have a global presence as they have subsidiaries, offices, and branches in various countries.
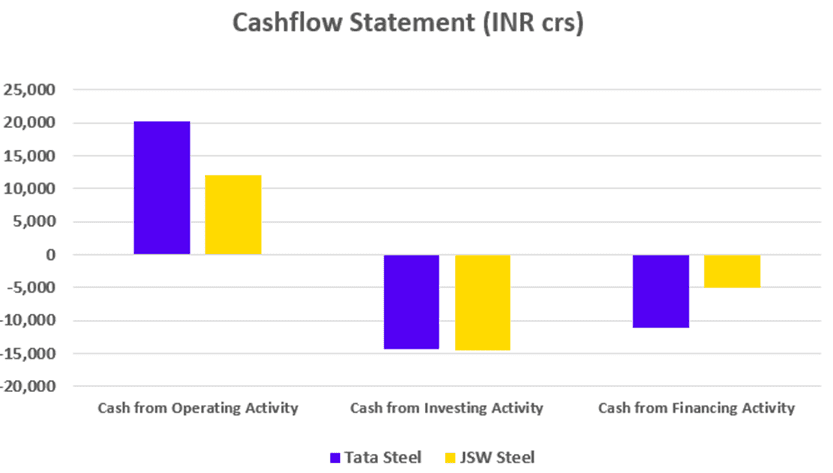
The steel industry in India is a critical sector that powers the country’s infrastructure and manufacturing capabilities. There are multiple players in this sector, however, two of the biggest players in this industry are Tata Steel and JSW Steel.
In this blog, we will compare these steel giants in detail, including their financial performance, key performance indicators, etc.
Tata Steel Overview
Tata Steel, a flagship company of the Tata Group, was established in 1907 and is one of the oldest steel companies in India. Headquartered in Mumbai, Tata Steel operates in over 26 countries and has a significant presence in Europe and Southeast Asia. The company is known for its integrated steel plants, cutting-edge technology, and sustainable practices.
The Indian product portfolio of Tata Steel is divided into multiple segments – Automotive and Special Products, Industrial Products, Projects and Exports, Branded Products, Retail, etc. The Company supplies hot-rolled, cold-rolled, galvanised, branded solution offerings and more.
As of March 2024, the company has an annual crude steel capacity of 35 million tonnes (MnTPA) and it is one of the world’s most geographically diversified steel producers. It is one of a few steel players that are fully integrated – from mining to the manufacturing and marketing of finished products. The company’s focus on innovation, quality, and sustainability has positioned it as a leader in the global steel market.
Did You Know? In 1907, Tata Steel was established in India as Asia’s first integrated private steel company.
JSW Steel Overview
JSW Steel, is the flagship business of the diversified US$ 24 billion JSW Group. The group has a presence in various sectors including Steel, Energy, Infrastructure, Cement, Paints, Venture Capital, Sports, etc. The group also boasts a diverse workforce across India, USA, Europe, etc. and directly employs nearly 40,000 people.
Coming to JSW Steel, it was founded in 1982 and has rapidly grown to become one of India’s leading steel manufacturers. It has a diverse range of steel products that serve industries such as automotive, infrastructure, and energy.
The company’s strategic focus on expanding capacity and improving operational efficiencies has allowed it to scale its production to over 28 million tons per annum. Not only that, it has consistently led in research and innovation, maintaining a strategic collaboration with the global leaders such as JFE Steel of Japan.
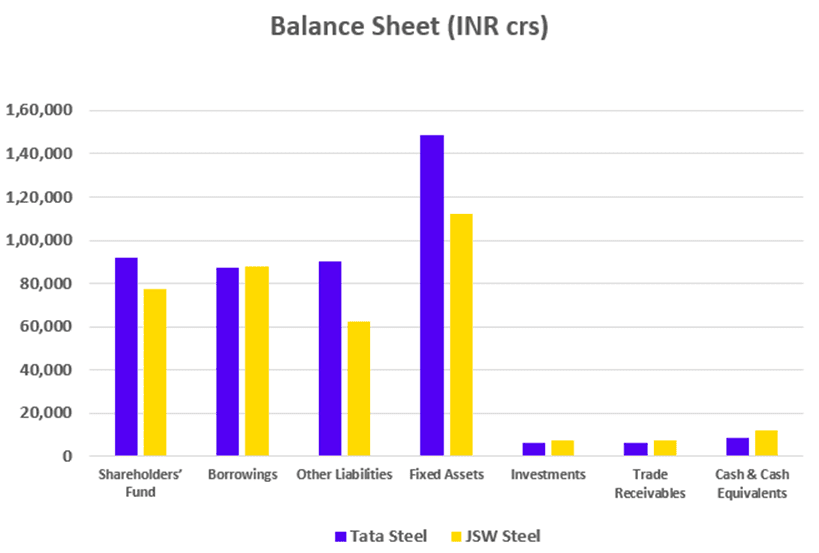
In summation, the comparison between Tata Steel and JSW Steel highlights the strengths and market positions of both companies in the Indian steel industry. While Tata Steel enjoys a legacy of over a century, JSW Steel’s aggressive growth strategies have made it a formidable competitor.
Investors can find value in both companies based on their preferences and risk tolerance. It’s advisable to consult with a financial advisor before making any investment decision.
S.NO.
Check Out These Interesting Posts You Might Enjoy!
Which company has a larger market capitalization: Tata Steel or JSW Steel?
As of August 2024, Tata Steel has a market capitalization of INR 1.92 lakh crore and JSW Steel has a market capitalization of INR 2.32 lakh crore.
What are the main products offered by Tata Steel and JSW Steel?
Tata Steel offers a wide range of products including flat and long steel products, automotive steel, and other specialty products. JSW Steel offers hot rolled coils, cold rolled coils, galvanised products, TMT bars, etc.
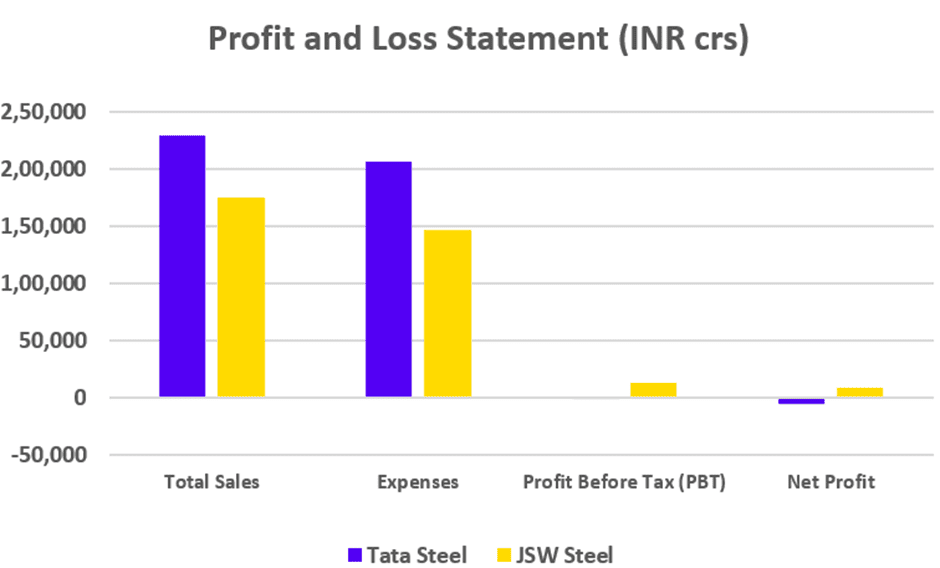
Which company is more profitable: Tata Steel or JSW Steel?
As of March 2024, Tata Steel reported a net loss of INR 4,910 crore, however, JSW steel reported a net profit of INR 8,973 crore.
Which company has a stronger international presence?
Tata Steel has a stronger international presence with significant operations in Europe and Southeast Asia, whereas JSW Steel is primarily focused on the Indian market and has some presence in the US and Europe.
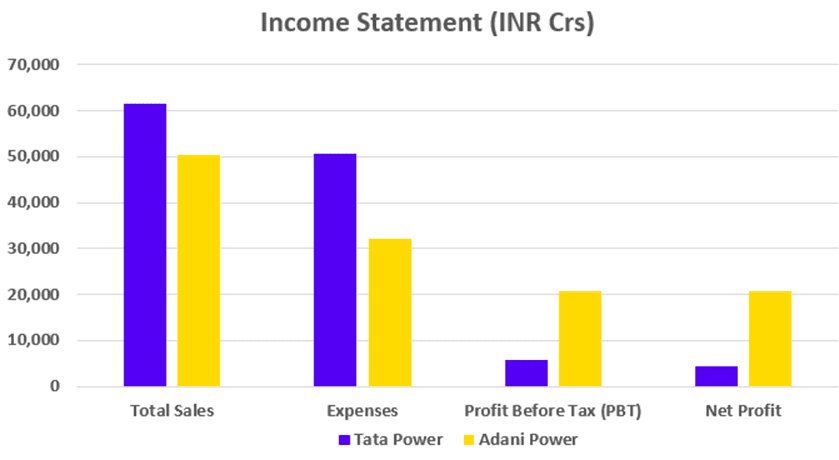
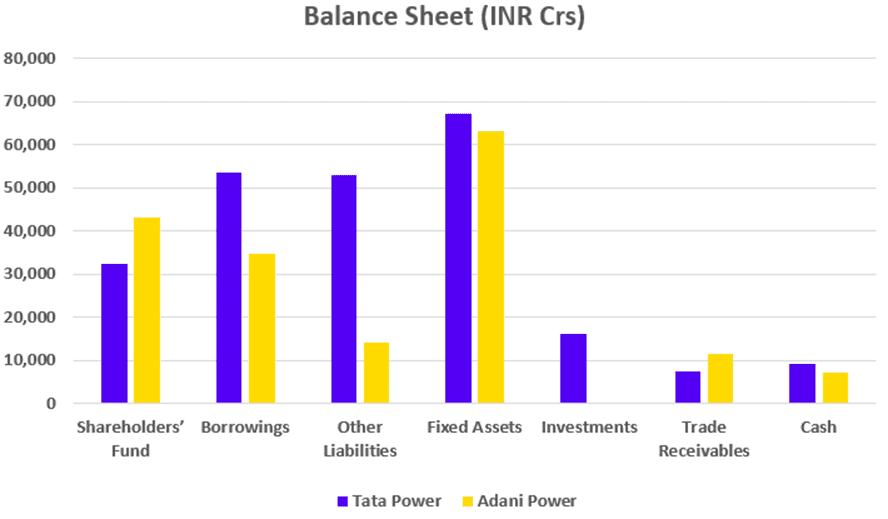
Did you know that the energy sector plays a crucial role in supporting not just the India’s industrial growth but also the overall economy? If we put aside two PSUs, i.e., NTPC and Power Grid, two major players leading in this sector are Tata Power and Adani Power.
In this blog, we will delve into a detailed comparison of these energy giants, their financial performance, and key performance indicators.
Tata Power Overview
Tata Power Limited, a flagship company of the Tata Group, was established in 1915 and has been a pioneer in the Indian power sector. It is headquartered in Mumbai and operates across the entire power value chain – generation, transmission, distribution, and renewable energy. It also offers next-generation solutions including solar rooftop and EV charging stations.
As of August 2024, the company has a diversified portfolio of 14,707 MW, spanning across renewable and conventional energy generation. The company is known for its focus on clean and sustainable energy solutions, boasting one of the largest portfolios of renewable energy in India.
Tata Power’s operations span across various segments including thermal power, hydroelectric power, solar power, and wind power. Further, Tata Power has also committed to achieve carbon neutrality before 2045.
Did You Know?
Tata Power established Mumbai’s electric vehicle charging stations. And it is now present in Delhi and Hyderabad as well.
Adani Power Overview
Adani Power Limited is a part of the diversified Adani Group. It was founded in 1996 and has rapidly grown to become one of the largest private sector power producers in India. The company operates in both thermal and renewable energy segments and is recognized for its large-scale power projects.
As of August 2024, the company has a power generation capacity of 15,250 MW and has thermal power plants in Gujarat, Maharashtra, Karnataka, Rajasthan, Chhattisgarh, Madhya Pradesh, and Jharkhand.
The company is known for its aggressive expansion strategies and its commitment to contributing to India’s energy security.
Did You Know?
Adani Power Limited is the largest private thermal power producer in India.
In summation, the comparison between Tata Power and Adani Power highlights the strengths and market positions of both companies in the Indian energy sector. While Tata Power enjoys a legacy of over a century with a strong focus on sustainability, Adani Power’s aggressive growth strategies have made it a formidable competitor in the industry.
Investors can find value in both companies based on their preferences and risk tolerance. It’s advisable to consult with a financial advisor before making any investment decision.
S.NO.
Check Out These Interesting Posts You Might Enjoy!
Tata Power was founded in 1915 and is one of the oldest power companies in India.
Which company has a larger market capitalization: Tata Power or Adani Power?
As of August 2024, Adani Power has a larger market capitalization of INR 2.46 lakh crore, compared to Tata Power’s INR 1.38 lakh crore.
What are the main areas of operation for Tata Power and Adani Power?
Tata Power operates across the entire power value chain, including generation, transmission, distribution, and renewable energy. On the other hand, Adani Power primarily focuses on large-scale thermal power projects but also has a significant presence in renewable energy.
Which company is more profitable: Tata Power or Adani Power?
As of FY 2024, Tata Power reported a net profit of INR 4,280 crore, while Adani Power reported a net profit of INR 20,829 crore.
What is Tata Power’s PE Ratio compared to Adani Power’s?
As of August 2024, Tata Power’s PE Ratio is 37.5, while Adani Power’s PE Ratio is higher at 15.4.
You put in a lot of effort, earned money, and decided to invest it in a public sector bank. However, you aren’t sure which bank to choose—the State Bank of India or Punjab National Bank.
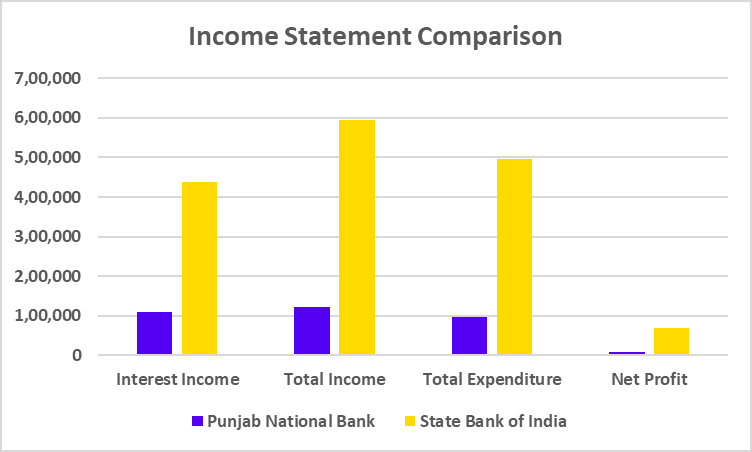
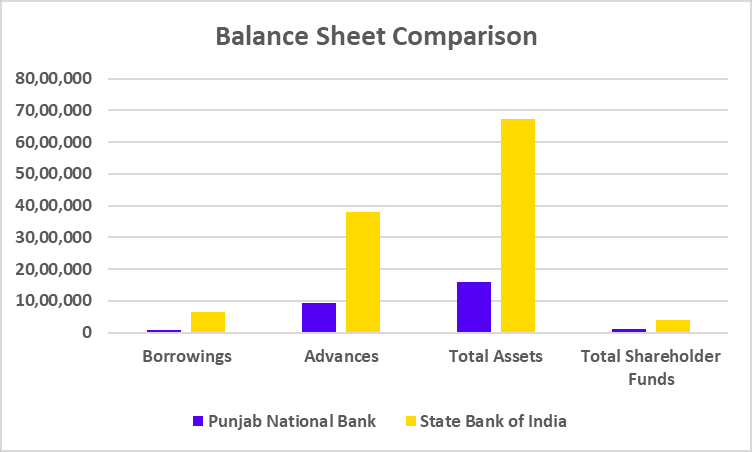
In today’s blog post, we will compare the Punjab National Bank and the State Bank of India.
Punjab National Bank Overview
Lala Lajpat Rai and Dyal Singh Majithia, leaders of the Swadeshi Movement, established the bank in Lahore, Pakistan, in 1894. The bank relocated its headquarters to New Delhi after India’s independence, and it was nationalized along with thirteen other banks later in 1969. It bought Nedungadi Bank in 2003 and merged with the United Bank of India and Oriental Bank of Commerce in 2020 to become India’s second-biggest public sector bank. The bank has 12,645 ATMs, 10,092 branches in India, and two international branches as of September 2023. The Punjab National Bank offers a wide range of services, including credit cards, insurance, mutual funds, fixed deposits, home loans, personal loans, etc. The company caters to the needs of MSMEs, retail investors, and big corporations.
SBI Bank Overview
SBI is India’s largest public sector bank and a titan of the nation’s banking sector, with the largest market share. SBI is a large financial institution with almost 200 years of history. Its main office is in Mumbai. SBI was established when the Bank of Calcutta, the first joint stock bank in British India, was established in 1806. Three separate presidential banks (the Bank of Bengal, the Bank of Bombay, and the Bank of Madras) arose throughout British India. In 1921, the three presidential banks merged to form the Imperial Bank of India. The Imperial Bank of India was nationalized by the Indian government in 1955 and was renamed the State Bank of India. Later, SBI bought several commercial and state-affiliated banks. To improve efficiency, the State Bank of India merged with its five affiliated banks—State Bank of Bikaner and Jaipur, State Bank of Hyderabad, State Bank of Mysore, State Bank of Patiala, and State Bank of Travancore in 2017. Rural communities now have access to banking services due to SBI. SBI currently has a robust distribution network with 65,627 ATMs and 22,405 branches.
To sum up, the State Bank of India and Punjab National Bank are regarded as major players in the Indian banking sector. An investor can choose the ideal investment opportunity by being aware of the differences between the two. However, one should evaluate their risk tolerance and speak with an investment advisor before making any financial decisions.
S.NO.
Check Out These Interesting Posts You Might Enjoy!
Which bank, the State Bank of India or Punjab National Bank, has a higher market capitalization?
Compared to Punjab National Bank, the State Bank of India has a larger market capitalization.
Where is the headquarters of Punjab National Bank located?
The headquarters of Punjab National Bank is located in New Delhi.
Which bank, SBI or Punjab National Bank, is more profitable?
In FY 2024, SBI reported a profit of 68,224 crores, whereas Punjab National Bank reported a profit of 8,329 crores. This shows that SBI is the more profitable of the two.
How many branches does Punjab National Bank have?
Punjab National Bank has 10,092 branches throughout the country.Q5. Who is the chairman of the
State Bank of India?
As of 31 August 2024, Mr. Challa Sreenivasulu Setty is the chairman of the State Bank of India.
Open Free Demat Account
Join Pocketful Now
You have successfully subscribed to the newsletter
There was an error while trying to send your request. Please try again.