The IT sector in India is a global powerhouse, driven by a competitive landscape of companies that are leaders in technology and innovation.
In this blog, we will compare two of India’s largest IT companies, Tata Consultancy Services (TCS) and Wipro, and discuss key insights, their financial performance, etc.
TCS Overview
Tata Consultancy Services (TCS), established in 1968, is a global IT services, consulting, and business solutions provider headquartered in Mumbai, India. The company is a division of Tata Group which is the largest multinational group in India. As of March 2024, the company employs more than 6 lakh employees, and 35% of the workforce is women.
The company offers a wide range of services, including software development, IT infrastructure services, cloud solutions, and enterprise applications. And it serves various industries, including banking, financial services, retail, telecommunications, healthcare, etc. Further, the company is known for its strong client relationships and robust service delivery models.
As of August 2024, TCS is the largest IT services company in India by market capitalization and revenue. Further, it consistently ranked among the top IT service providers globally. The company’s focus on innovation, quality, and customer satisfaction has earned it a stellar reputation in the IT industry.
Did You Know?
In 2004, TCS listed at the National Stock Exchange (NSE) and Bombay Stock Exchange with the largest IPO by a private sector company, raising an impressive USD 1 billion.
Wipro Overview
Wipro Limited, founded in 1945, is another major player in the Indian IT industry, headquartered in Bangalore, Karnataka. The company was established as a vegetable oil manufacturer and has transformed itself into a global IT services and consulting company.
It entered the IT sector in 1981 and has since diversified its offerings across various technology domains. It has a presence in over 66 countries and employs more than 2,50,000 people. Further, the company is known for its commitment to corporate social responsibility and ethical business practices.
The company provides IT services, including software development, business process outsourcing (BPO), cloud computing, digital transformation and much more. The company provide services to multiple industries such as banking, healthcare, energy, consumer goods, etc. Wipro’s global delivery model and emphasis on sustainability and innovation have positioned it as a key competitor in the global IT market.
Did You Know?
In 2000, Wipro grew to a one billion dollar company and was listed on the New York Stock Exchange.
In summation, the comparison between TCS and Wipro highlights that both companies are giants in the IT services industry, however, TCS has a clear edge in terms of profitability because of larger market capitalization.
However, Wipro is not lagging behind and remains a strong competitor with its global presence and focus on innovation. Investors can find value in both companies based on their preferences and risk tolerance. It’s advisable to consult with a financial advisor before making any investment decision.
S.NO.
Check Out These Interesting Posts You Might Enjoy!
Tata Consultancy Services (TCS) was founded in 1968.
What is the full form of TCS?
TCS stands for Tata Consultancy Services.
Who is the current CEO of Wipro?
Srini Pallia is the current CEO of Wipro. He joined the company in 1992 and previously held many leadership positions at the company, including President of Wipro’s Consumer Business Unit and Global head of Business Application Services.
Which company is more profitable: TCS or Wipro?
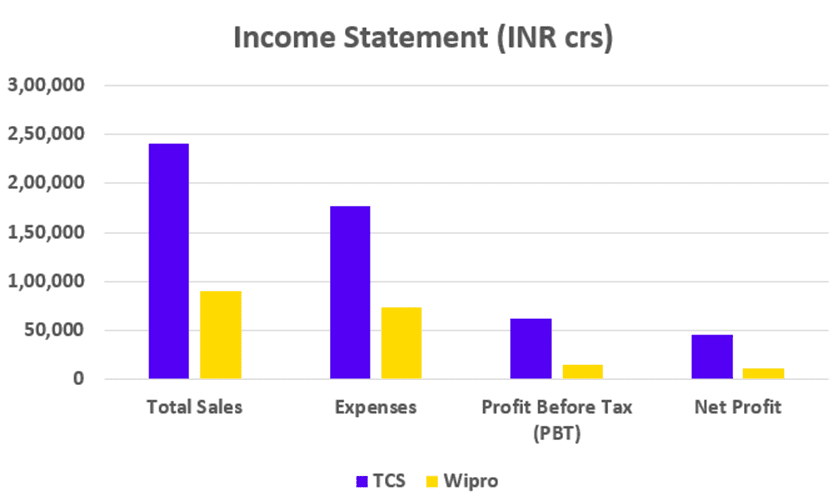
As of March 2024, TCS has a net profit of INR 46,099 crores compared to INR 11,112 crores of Wipro.
Which company has a larger market capitalization: TCS or Wipro?
As of August 2024, TCS has a market capitalization of around INR than 16.31 lakh crores and Wipro has a market capitalization of around INR 2.83 lakh crores.
You save a lot of money and put in a lot of work, but you need help determining where to keep it. It is only possible to retain some of your hard-earned savings at home; opening a bank account is your only option. You might be surprised to hear that banks where you have accounts allow you to invest in their business.
This blog post will compare the State Bank of India (SBI) and ICICI Bank.
SBI Overview
State Bank of India is the largest public sector bank in India and is a titan in the Indian banking landscape with a 1/4th share in the market. SBI is headquartered in Mumbai and holds a rich heritage of over 200 years.
The roots of SBI trace back to 1806 with the establishment of the Bank of Calcutta, the first joint stock bank in British India. Three separate presidency banks – Bank of Bengal, Bank of Bombay, and Bank of Madras emerged across British India. In the year 1921, the three presidential banks merged to form the Imperial Bank of India.
In the year 1955, the government of India nationalized the Imperial Bank of India and renamed it as State Bank of India. SBI later acquired various state-associated banks and commercial banks.
SBI has played an important role in bringing banking services to rural areas. Currently, SBI holds a strong distribution network of 22,405 branches and 65,627 ATMs.
ICICI Bank Overview
ICICI Bank is among the biggest banks in India’s private sector. The government of India established the Industrial Credit and Investment Corporation of India (ICICI) on 5 January 1955. As a division of ICICI Limited, ICICI Bank was founded in 1994. It made history by being the first Indian bank and firm to list on the New York Stock Exchange. ICICI and ICICI Bank combined to form a new financial organization to increase business efficiency. Following accusations against Chanda Kochhar, the managing director of ICICI Bank, in 2018 about inappropriate lending practices, Sandeep Bakhshi assumed the role of managing director. It was the first bank to provide contactless credit and debit cards.
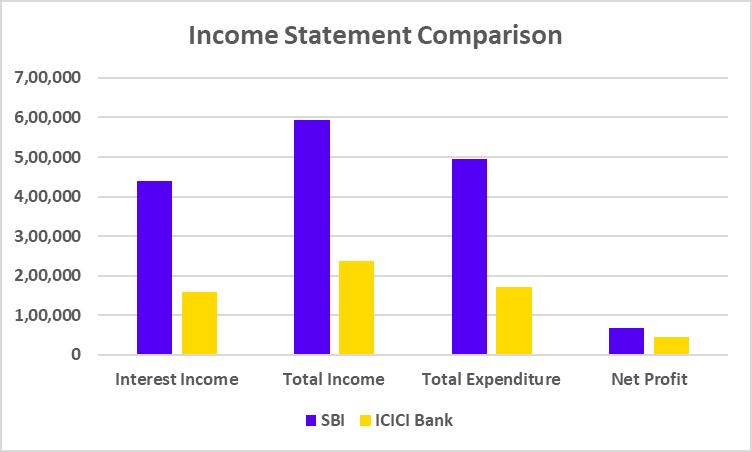
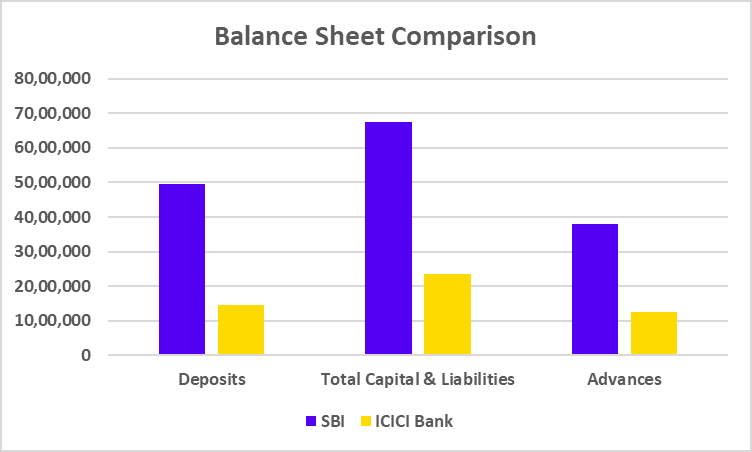
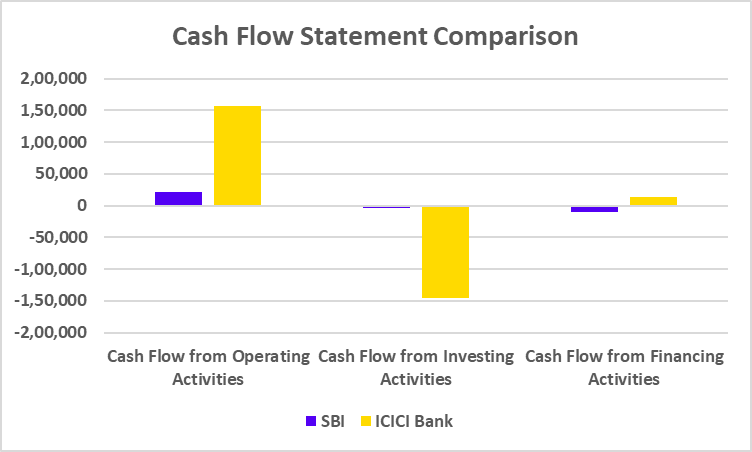
The comparison of SBI and ICICI Bank presented above leads us to conclude that while SBI has more net profit, ICICI Bank has a higher net profit margin. Although every bank has something special to offer, we always advise speaking with an investment expert before making investment decisions.
S.NO.
Check Out These Interesting Posts You Might Enjoy!
Which bank has a larger market capitalization: SBI or ICICI Bank?
ICICI Bank has a larger market capitalization than SBI as of 27 August 2024.
Which bank is more profitable: SBI or ICICI Bank?
SBI has a net profit of INR 68,244 crores compared to INR 45,007 crores for ICICI Bank for FY 2024.
Who is the CEO of ICICI Bank?
Sandeep Bakhshi is the MD and CEO of ICICI Bank.
What is the full form of ICICI Bank?
ICICI stands for Industrial Credit and Investment Corporation of India.
How was the State Bank of India formed?
State Bank of India was established in 1955 after the government of India nationalized the Imperial Bank of India and renamed it as State Bank of India.
IndiGo and SpiceJet have been important in shaping India’s aviation industry with their unique business models and operational strategies.
In today’s blog, we will take a closer look at their development and growth to gain valuable insights into the financial health of these two aviation giants.
IndiGo – An Overview
The largest and most popular passenger airline in India is InterGlobe Aviation Ltd., better known as IndiGo. Rakesh Gangwal, an Indian entrepreneur living in the US, and Rahul Bhatia of InterGlobe Enterprises established the business as a private company in 2006. The company was originally incorporated in Lucknow in 2004, and in 2006, it was converted into a public limited company, and the name was changed to InterGlobe Aviation Limited. It commenced operations in August 2006 with a fleet of 100 Airbus A320-200 aircraft. IndiGo has a strong record for punctuality, ensuring reliable travel experiences.
It operates over 2000 daily flights to 122 destinations, including 88 domestic and 34 international locations. With a fleet of over 370 aircraft, IndiGo ensures excellent connectivity and convenience for its passengers. The primary source of income for IndiGo is passenger fares.
The airline has the capability to attract a decent number of passengers through its competitive pricing and extensive network and maximizes its revenue by offering ancillary services such as baggage fees, seat selection, in-flight meals, and priority boarding. It also transports cargo, which contributes to its overall revenue.
SpiceJet – An Overview
SpiceJet is a prominent low-cost airline in India that is well-known for its affordable fares and extensive network. The airline was established in 2005 and has grown rapidly, becoming a major force in the Indian aviation sector. Originally founded as an air taxi provider in 1994, the company was known as ModiLuft. The business was bought and rebranded as SpiceJet by Indian businessman Ajay Singh in 2004.
The airline formally began operations with two Boeing 737-800 aircraft in May 2005. In terms of market share, it was ranked third among low-cost carriers in India by 2008, behind IndiGo and Air Deccan. SpiceJet provides various services, including discount coupons, travel insurance, tour packages, and flight reservations.
(All the above data is of the year ended March 2024)
Conclusion
IndiGo and SpiceJet are both major players in India’s aviation industry. However, there are differences in their strategies and operations. IndiGo is recognized as the dominant airline, with a strong focus on punctuality, customer service, and an extensive network. Standardizing its fleet to increase operational efficiency has been a key factor in its success. On the other hand, SpiceJet has followed a highly aggressive expansion strategy, capitalizing on its extensive network and competitive pricing to attract a significant customer base. While both airlines share a common goal of providing affordable air travel, their distinct approaches have led to different market positions. It is advised to consult a financial advisor before investing.
S.NO.
Check Out These Interesting Posts You Might Enjoy!
India is one of the world’s fastest-growing economies and is facing substantial challenges in managing its energy requirements. With a population of over 140 crore, the Government of India is making all the necessary efforts to meet the country’s rising energy needs. Two government-owned businesses, NHPC and NTPC, are responsible for energy production in India.
In today’s blog post, we’ll compare NTPC and NHPC.
NHPC Overview
The NHPC was established in 1975 by the Government of India as a division of the Ministry of Power. The company’s primary goal is to increase the nation’s hydropower output. The company has operations in Jammu & Kashmir, Uttarakhand, Arunachal Pradesh, Sikkim, etc. The corporation uses wind energy and solar energy, among other sources, to generate electricity.
In 2008, the company went public on the Indian Stock Exchange. With a hydro share of 6971.20 MW as of March 2024, the corporation has a total capacity of 7144.20 MW or 14.85% of the nation’s hydro capacity. The organization is always concentrating on using renewable energy sources to generate electricity. It also develops several infrastructure types, including tunnels, dams, and powerhouses. The company’s main office is located in Faridabad.
NTPC Overview
In response to the country’s growing need for power, the Indian government established the firm in 1975 as a public-sector corporation. The company used coal to produce electricity and is now focusing on utilizing renewable energy sources. Due to its substantial contribution to the nation’s electricity consumption, the business became India’s largest power utility in 1990. The company launched an initial public offering (IPO) in 2004 and became listed on the Indian Stock Exchange.
The corporation is diversifying its sources of electricity generation, including nuclear, solar, wind, and hydroelectric power. The firm has 94 facilities with a combined capacity of 76,134 MW, of which 52 are owned and run by NTPC, and 43 are in joint ventures or subsidiaries. The company plans to achieve a 130 GW capacity by 2032. The business produced 400 billion units of power in 2023–2024. The organization’s headquarters is in New Delhi.
In conclusion, both businesses produce power, but their methods vary: NHPC primarily draws its energy from hydroelectric sources, while NTPC draws its energy from more traditional sources like coal, gas, etc. In the fiscal year ending in 2024, both businesses reported profits and are expanding their operations in the renewable energy market. Given their bright futures, an investor should take into account the risk profile of these companies or consult a financial advisor before making any investment decisions.
S.NO.
Check Out These Interesting Posts You Might Enjoy!
Which firm, NHPC or NTPC, has a higher market capitalization?
The market capitalization of NTPC is more than that of NHPC.
What is the full form of NTPC and NHPC?
National Hydroelectric Power Corporation is abbreviated as NHPC, and the full name of NTPC is National Thermal Power Corporation Limited.
Which company is more profitable: NTPC or NHPC?
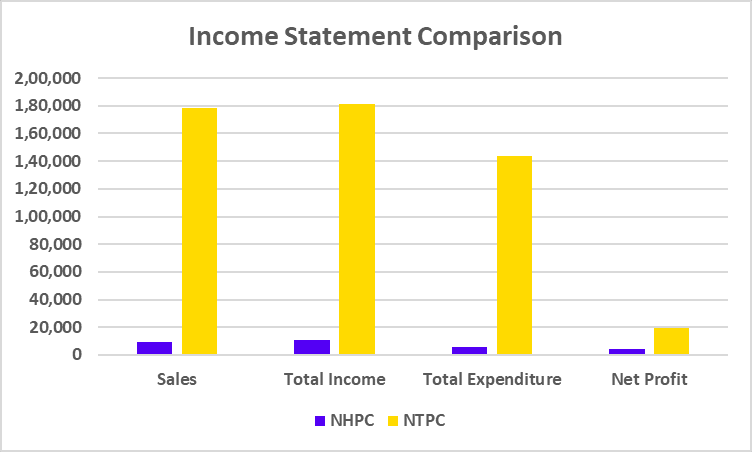
For FY 2024, NTPC generated a net profit of 19,696 crores, while NHPC reported a net profit of 4,023 crores, demonstrating that NTPC is more profitable.
What are NTPC and NHPC’s primary business activities?
While NTPC is a well-known player in the thermal power (oil, gas, and coal) generation industry, NHPC is primarily focused on hydroelectric power generation and is regarded as a major player in this area.
Which company has a more diversified business model among NTPC and NHPC?
Compared to NHPC, which mostly concentrates on hydroelectric power, NTPC has a more diverse business strategy because it generates power from various sources, including coal, gas, hydroelectric, solar, wind, etc.
Miniratna companies are a group of public sector enterprises in India that are considered relatively small but still important in terms of their operations and contributions to the economy. The Government of India categorizes these companies under the “Miniratna” status to recognize their performance and to provide them with certain financial and operational autonomy.
In this blog, we will discuss the significance of “Miniratna” status, the criteria for earning it, and an overview of the top Miniratna companies.
Overview of Miniratna Companies
The Indian government grants Miniratna status to a group of public sector companies based on their historical revenue and profit figures. These businesses are given the ability to make decisions by the government, which helps them operate more effectively in their respective industries. These enterprises work under the jurisdiction of the Government of India yet enjoy a great degree of decision-making power in terms of everyday operations, which includes investments, joint ventures, and other commercial decisions.
The Miniratna companies are divided into two different categories based on the financial position of the companies –
Miniratna Category I
The company must satisfy the following conditions to earn a Miniratna Category-I status:
A company must have continuously made a profit for the last three years.
A pre-tax profit of at least 30 crores in one of the previous three years.
The company must have a positive net worth.
Miniratna Category II
The company must satisfy the following conditions to earn a Miniratna Category-II status:
A company must have continuously made a profit for the last three years.
The company must have a positive net worth.
Moreover, to become a Miniratna company, the company should not have defaulted in the repayment of loans or interest payments and shall not depend upon budgetary support or Government guarantees.
Top Miniratna Companies in India Based on Market Capitalization
A brief overview of Miniratna companies is given below:
1. Indian Railway Finance Corporation Ltd.
Indian Railway Finance Corporation Ltd. was established in 1986 as the financial arm of the Indian Railway. The IRFC is governed by the Ministry of Railways. The company’s main goal is to raise capital through various means, such as issuing bonds, etc. The international capital market is another source of funding for the company. In 2021, the company launched its initial public offering (IPO) and was listed on the Indian stock exchanges. The company’s main office is located in New Delhi.
2. Indian Railways Catering and Tourism Corporation Ltd.
The Ministry of Railways formed the Indian Railway Catering and Tourism Corporation of India (IRCTC), a public sector organization. To modernize Indian Railways’ tourist and online ticketing operations, IRCTC was founded in 1999.
In 2002, they introduced irctc.co.in, an online ticketing platform. With this website, customers may make online reservations for tickets. Subsequently, they began providing more services, such as catering services for Indian Railways. The IRCTC mobile application was introduced in response to the growth in smartphone usage and technical advancements. It provides users with a quick way to order tickets, check train schedules, and access other services.
3. Cochin Shipyard Ltd.
Cochin Shipyard was established by the Indian government in 1972, and the company’s shipyard is located in Kochi, Kerala. The business delivered the MV Rani Padmini, a bulk carrier, as its maiden vessel in 1981. The business constructed the INS Vikrant, India’s first aircraft carrier. The company went public in 2017 to raise funds to modernize its infrastructure. Its main office is located in Kochi, Kerala.
4. Bharat Dynamics Ltd.
The Indian government formed Bharat Dynamics Ltd. in 1970 as a public-sector undertaking under the Ministry of Defence. The business was founded with the primary goal of producing guided weaponry. The company has created the Prithvi, Akash, and Nag Missiles in partnership with the Defence Research and Development Organization (DRDO). 2018 saw the company’s listing on the Indian Stock Exchange. The company’s headquarters is in Hyderabad.
5. Hindustan Copper Ltd.
Hindustan Copper was established by the Indian government in 1967 as a central public sector undertaking under the Ministry of Mines. The company’s primary goal is to explore the nation’s copper mining potential. The business took over the mines from NMDC Limited in 1967. The corporation is currently engaged in exploring new mines to boost production. The company’s main office is located in Kolkata.
6. KIOCL Ltd.
The Indian government established KIOCL, formerly known as Kudremukh Iron Ore Company Limited, in 1976. It is a department of the Ministry of Steel. According to a Supreme Court ruling, the company’s mines were shut down in 2005. Following this, the company began importing iron ore from various suppliers, including Brazil. The company is searching for a new mining lease to guarantee a steady supply of iron ore. The organization’s headquarters is in Bangalore.
Performance of the Miniratna Companies
Company
1-Year Return
3-Year Return
5-Year Return
Indian Railway Finance Corporation Ltd.
-24.52%
439.11%
363.98%
Indian Railway Catering & Tourism Corporation Ltd.
-30.29%
-14.29%
81.54%
Cochin Shipyard Ltd.
45.39%
776.17%
628.70%
Bharat Dynamics Ltd.
2.14%
360.40%
575.58%
Hindustan Copper Ltd.
-19.44%
80.48%
529.77%
KIOCL Ltd.
-52.28%
11.45%
126.62%
(As of 28th February 2025)
Key Performance Indicators (KPIs)
Company
ROE (in %)
ROCE(in %)
Debt to Equity (x)
P/E
P/B
Indian Railway Finance Corporation Ltd.
13.03
53.32
8.38
36.50
4.79
Indian Railway Catering & Tourism Corporation Ltd.
34.40
45.47
0
62.24
22.87
Cochin Shipyard Ltd.
15.65
19.98
0
59.87
10.28
Bharat Dynamics Ltd.
16.84
11.33
0
82.35
14.12
Hindustan Copper Ltd.
12.92
15.74
0.10
87.86
13.91
KIOCL Ltd.
-4.34
-2.31
0.03
-326.56
12.93
(All the above data is of the year ended March 2024)
In conclusion, Miniratna Companies of India significantly contribute to the nation’s economic growth. These businesses demonstrate consistent financial performance, effective operational efficiency, and the ability to strike a balance between profitability and social welfare. These businesses are regarded as excellent investment options, but before making investment decisions, it’s wise to consider your risk tolerance and speak with an investing professional.
S.NO.
Check Out These Interesting Posts You Might Enjoy!
There are 76 Miniratna companies in India, of which 64 are under Category I, and 12 are under Category II.
How many Miniratna companies are there in Category 1?
There are 64 Miniratna companies in Category-I as of 2024. These companies have demonstrated consistent profitability and operational efficiency.
How many Miniratna companies are there in Category 1?
There are 12 Miniratna companies in Category-II as of 2024. These companies have met basic profitability and financial stability criteria.
Which department gives Miniratna status to the companies?
The Department of Public Enterprises gives the Miniratna status to eligible companies.
Is it compulsory for Miniratna companies to get listed on the Indian Stock Exchange?
Miniratna companies are not required to list on the Indian Stock Exchange.
What is the full form of CPSE?
CPSE stands for Central Public Sector Enterprises.
Can a Miniratna company be upgraded to Maharatna status?
If a Miniratna company satisfies the requirements to be a Maharatna status, it can be granted a Maharatna status.
Where can I find the list of Miniratna companies?
The official and updated list of Miniratna companies is usually published on government websites, such as the Department of Public Enterprises (DPE) or other reliable sources like financial news platforms.
From a steady climb to a sharp decline, the Bump and Run Reversal Top pattern indicates the “End of the Bull Run.”
The Bump and Run Reversal Top Chart pattern is a bearish reversal pattern. It forms when the market is in an overly bullish trend, and prices suddenly advance to higher levels in a frantic manner. Once the pattern is confirmed, it suggests that the market trend is expected to reverse from bullish to bearish. In today’s blog, we will discuss the Bump and Run Reversal Top chart pattern, trading setup, advantages, and disadvantages.
What is the Bump and Run Reversal Top Chart Pattern?
The Bump and Run Reversal Top is a chart pattern that forms after a bull run or excessive uptrend in the stock price, which is too fast. The pattern generally indicates a change of trend from bullish to bearish. The pattern was first identified by Thomas Bulkowski and was introduced in the June 1997 issue of a journal called “Technical Analysis of Stocks and Commodities.” It was also included in his book, the “Encyclopedia of Chart Patterns.”
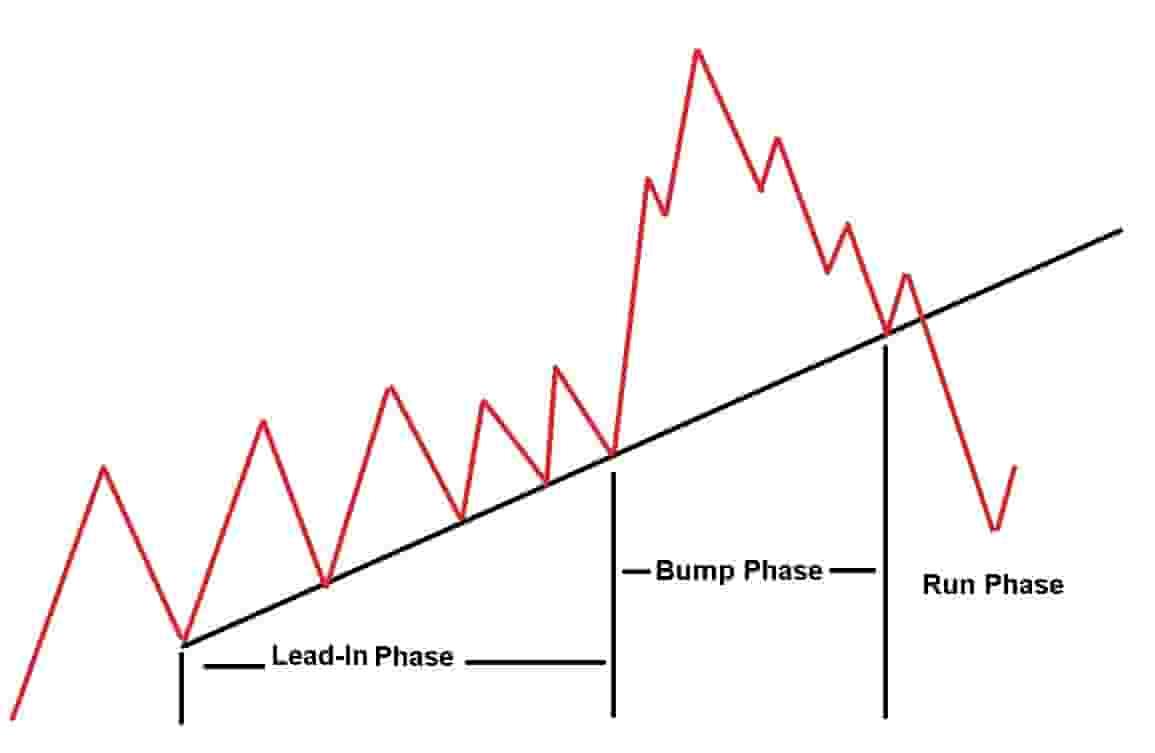
The three main phases of the pattern are explained below:
Lead-in Phase: The lead-in phase is characterized by a steady upward trend with a moderate slope. The asset price trends higher in this phase, roughly at an angle of 30 degrees to 45 degrees on the chart.
Bump Phase: In this phase, the price of an asset sharply increases and deviates significantly from the initial trendline, often due to excessive speculation. The asset price starts to trend even higher with a steeper angle, typically between 45 degrees and 60 degrees.
Run Phase: The price peaks, then reverses sharply, breaking below the original trendline, signaling the start of a bearish trend. The pattern is complete once the asset price moves below the original trendline, acting as a support.
This pattern helps traders recognize when a bullish trend may come to an end, offering opportunities to exit long positions or to enter short positions.
How to Find the Bump and Run Reversal Top Chart Pattern?
The methods for finding a Bump and Run Reversal Top pattern in the market are:
Use a percentage scanner: Use a percentage gainer stock scanner or tool to scan for trading opportunities and find the stocks that have appreciated significantly. Then, glance through the charts to find stocks about to enter the bump phase.
Manually browse the price charts: Manually check the price charts to find the Bump and Run Reversal Top pattern.
Trading Setup
A trading setup consists of a precise plan for entry, stop-loss, and target levels, which are discussed as follows:
Entry Point: The entry point should be when the price breaks below the trendline formed during the Lead-in phase. Create a short position once the price moves below the trendline. An increase in volume during the breakdown can be used as a confirmation signal.
Stop-loss: A stop-loss should be placed ideally just above the bump peak or above the most recent high before the breakdown to manage risk.
Target: Measure the vertical distance between the bump’s peak and the trendline. Find the breakdown point where the price first breaks the support and then subtract the distance from the breakdown price to get the target price.
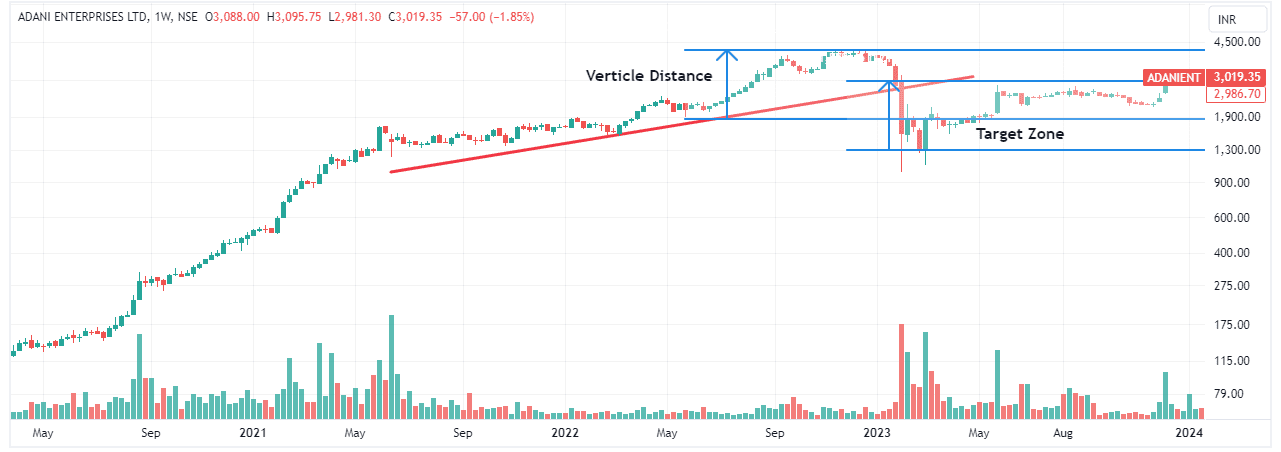
Example: Bump and Run Reversal Top Chart Pattern of Adani Enterprises Ltd.
The above image shows Adani Enterprises’ weekly chart. The stock was in an uptrend for some time, and then it started making a Bump and Run Reversal Top chart pattern when the stock price was in the Lead-in phase from June 2021 to May 2022. The stock price witnessed a sharp uptrend between May 2022 and November 2022 and went from a low of 1900 to a high of 4,096 in a speculative uptrend during the Bump phase. The stock price started falling with big volumes and gave a breakdown below the initial trend line in January 2023. The height of the bump is approximately 2,200, which is subtracted from the breakdown point of INR 3,019 to get an approximate target of INR 819. The stock almost achieves the target price in a couple of weeks after the breakdown. Stop-loss should ideally be placed just above the peak of the bump. A more conservative stop-loss should be placed just above the most recent high before the breakdown.
Advantages of Bump and Run Reversal Top Chart Pattern
The advantages of the Bump and Run Reversal Top chart pattern are:
It works in any market, such as equity, currency, or commodity markets.
It works in any time frame, but a pattern formation on a bigger time frame means a strong trend reversal is expected.
The pattern can be used as a reversal indicator.
The pattern can be used to capture large price movements.
The pattern provides a logical understanding of price action.
The pattern can be used to identify opportunities to short an asset in the market.
This pattern gives quite accurate results if the breakdown occurs with strong volumes.
Limitations of Bump and Run Reversal Top Chart Pattern
The limitations of the Bump and Run Reversal Top chart pattern are:
It is a complicated pattern and needs some expertise to trade.
Pattern interpretation can be subjective, as it is one of the confusing and complex patterns.
It is a time-consuming pattern.
The pattern could give a false breakdown, which can result in losses.
The pattern could be affected by various market factors such as volatility, news, policy change, political instability, or any other factor.
The Bump and Run Reversal Top chart pattern is a powerful technical tool for investors and traders. Though it is a time-consuming pattern, once breakdown occurs after a strong trend with good volume, it offers a potential for significant gains. The pattern is divided into three phases: Lead-in phase, Bump Phase, and Run Phase. It is important to understand the pattern’s characteristics, trade setup, and risk management strategies before using this pattern to make informed decisions and improve the chances of success in the markets.
Frequently Asked Questions (FAQs)
How does the Bump and Run Reversal Top pattern differ from other reversal patterns?
Other reversal patterns, such as Head and Shoulders or Double Top, have specific formations, but the Bump and Run Reversal Top pattern follows a trendline formed during the Lead-in phase. Furthermore, it is difficult to estimate the duration of each phase.
Can the Bump and Run Reversal Top pattern lead to a long-term trend reversal?
Yes, it can signal the start of a long-term bearish trend on a longer timeframe (e.g., weekly or monthly). However, in a short timeframe, it may only indicate a temporary correction.
What are the risks of trading the Bump and Run Reversal Top pattern?
The primary risk associated with the Bump and Run Reversal Top pattern is a false breakdown when the price temporarily moves below the trendline but then resumes the uptrend. To lower this risk, traders should check volumes for confirmation or use additional indicators to validate the reversal.
Is the Bump and Run Reversal Top pattern reliable?
The Bump and Run Reversal Top pattern can be reliable, especially when confirmed by volume and other technical indicators.
Navratna Companies are a group of government-owned enterprises whose legacy of excellence and contribution to the Indian economy is widely recognized and appreciated. These companies play a crucial role in driving India’s economic growth and development across various sectors.
In today’s blog, we will explore the key features of Navratna companies, how they have evolved, and their past financial track record.
What is a Navratna company?
Navratna Companies are a special group of public sector undertakings (PSUs) in India. These PSUs are the top performers, enjoying enhanced financial autonomy and operational flexibility granted by the government. The term ‘Navratna’ means nine gems in Sanskrit.
Key Characteristics of Navratna Companies
They can invest up to INR 1,000 crores without government approval.
They have more freedom to make decisions and can compete better in the market.
The Navratna status brings increased recognition and credibility.
Additionally, these companies play an important role in the Indian economy and are widely regarded as industry leaders.
Eligibility Criteria for Becoming a Navratna Company
A company must satisfy the following criteria to become a Maharatna company:
Miniratna Category 1 Status – For a PSU to qualify for ‘Navratna status’, it must have held ‘Miniratna’ Category 1 status for at least three years.
Profits – The company must have consistently generated profits over the past three years.
Net Worth – To ensure financial stability, the company needs to maintain a positive net worth consistently over the past three years.
Corporate Governance – The PSU must have a track record of exemplary performance and demonstrate sound corporate governance practices.
Global Presence – the company must establish a substantial global presence and engage in international operations.
Furthermore, Miniratna Category 1 and Schedule ‘A’ CPSEs, which have achieved an ‘excellent’ or ‘very good’ rating under the Memorandum of Understanding system in at least three out of the past five years and have a composite score of 60 or higher in the six specifically chose parameters viz.,
Net profit to net worth,
Manpower cost to total cost of production/services,
Profit before depreciation, interest, and taxes to capital employed,
Profit before interest and taxes to turnover,
Earnings per share
Inter-sectoral performance
All Navratna Companies List Based on Market Capitalization
The top Navratna stocks in 2026 are:
S.No.
Navratna Stocks
1
Bharat Electronics Ltd.
2
Rail Vikas Nigam Ltd.
3
Mazagon Dock Shipbuilders Ltd.
4
Indian Renewable Energy Development Agency Ltd.
5
NMDC Ltd.
6
Container Corporation of India Ltd.
7
Engineers India Ltd.
8
Mahanagar Telephone Nigam Ltd.
9
National Aluminium Company Ltd.
10
National Buildings Construction Corporation Ltd.
11
Neyveli Lignite Corporation Ltd.
12
Rashtriya Ispat Nigam Ltd.
13
Shipping Corporation of India Ltd.
14
Indian Railway Catering & Tourism Corporation Ltd.
A brief overview of Navratna companies is given below:
1. Hindustan Aeronautics Ltd.
Hindustan Aeronautics Ltd.(HAL) is India’s biggest aerospace company and plays a major role in the country’s defense industry. Founded in 1940, HAL has a rich history of designing, manufacturing, and maintaining aircraft, helicopters, etc. In the 1970s and 1980s, India made significant strides in developing indigenous aircraft, such as the HF-24 Marut and the HAL Cheetah Helicopter. HAL is a versatile aerospace company involved in a wide range of activities, which includes the design, development, and production of fighter jets, trainers, and transport aircraft, the production of military and civilian helicopters, and overhauling and repairing aircraft for both domestic and international customers.
2. Bharat Electronics Ltd.
Established in 1954, the company manufactures a wide range of advanced electronic products for Indian defense forces. This forms the major part of their revenue. It plays an important role in India’s defense sector by providing several crucial electronic equipments to the Indian Armed Forces. Bharat Electronics Ltd. (BEL) is a Navratna Public Sector Undertaking (PSU) under India’s Ministry of Defence. Products include communication equipment, electronic warfare systems, avionics, and night vision devices. The company also ventured into the civilian market and is trying to capture new growth opportunities. Their non-defense products include homeland security solutions, telecom & broadcast systems, medical electronics, etc.
3. Rail Vikas Nigam Ltd.
Rail Vikas Nigam Ltd. (RVNL) is a public sector undertaking under the Ministry of Railways, Government of India. It was established in 2003 with the main goal of quickly carrying out railway infrastructure projects. It is involved in the development and implementation of railway infrastructure projects in India. RVNL plays an important role in enhancing the efficiency and capacity of the Indian railway network. The company is responsible for the planning, designing, constructing, and maintaining various railway infra projects, which include new railway lines, doubling of existing lines, gauge conversion, electrification of railway lines, railway bridges, and tunnels. It offers complete project management services to ensure projects are completed on time and meet quality standards. RVNL actively participates in PPP projects with private companies to finance and execute railway infra projects.
4. Mazagon Dock Shipbuilders Ltd.
Mazagon Dock Shipbuilders Ltd. is a leading shipbuilding and repair yard in India. Established in 1849, the company has a rich history of constructing and repairing naval vessels, commercial ships, and offshore structures. In 1849, it was established as the Bombay Dockyard. During the 1990s and 2000s, the company started building commercial ships such as tankers, bulk carriers, and offshore platforms. The 2010s were marked by a sustained dedication to both naval and commercial shipbuilding, placing a strong emphasis on advanced technologies and high-quality standards. The company is an advanced shipbuilding facility for naval shipbuilding, commercial shipbuilding, ship repair, etc.
5. Indian Renewable Energy Development Agency Ltd.
Indian Renewable Energy Development Agency Ltd. (IREDA) is a financial institution that operates under the Ministry of New and Renewable Energy, which is part of the Government of India. Created in 1987, IREDA aims to support and fund renewable energy projects in India. It provides financial assistance to various renewable energy projects, including solar power, wind power, biomass power, small hydropower, and geothermal power. It plays an important role in promoting sustainable energy development in India. IREDA supports policies that encourage the development of renewable energy in India.
6. National Mineral Development Corporation Ltd.
National Mineral Development Corporation Ltd. (NMDC) is the biggest iron ore producer in India, playing a significant role in the country’s steel industry. It was founded in 1958 as the National Mineral Development Corporation and has played a leading role in India’s mining industry. The company is the primary supplier of iron ore to India’s steel industry, ensuring a steady supply of raw materials. It has played an important role in developing infrastructure in mining regions, including roads, railways, and power plants. NMDC operates numerous iron ore mines in India, such as Bailadila in Chhattisgarh, Donimalai in Karnataka, and Kumaram Bheem in Telangana. It is also looking for new mining opportunities and expanding its operations.
6. Container Corporation of India Ltd
Container Corporation of India Ltd. (CONCOR), founded in 1988 under the Ministry of Railways, is India’s largest container logistics and supply chain company. It provides end-to-end multimodal transport services combining rail, road, and port logistics. CONCOR plays a vital role in facilitating EXIM trade and strengthening India’s freight infrastructure network.
7. Engineers India Ltd. (EIL)
Engineers India Ltd. (EIL), incorporated in 1965, is a premier public sector engineering consultancy and EPC firm under the Ministry of Petroleum and Natural Gas. It provides design, project management, and turnkey solutions for refineries, petrochemicals, pipelines, and infrastructure. EIL has delivered landmark industrial and energy projects across India and abroad.
8. Mahanagar Telephone Nigam Ltd. (MTNL)
Mahanagar Telephone Nigam Ltd. (MTNL), established in 1986, provides telecom services in Delhi and Mumbai. Once a dominant player in India’s telecom market, MTNL now focuses on broadband, mobile, and enterprise connectivity. The company is working closely with BSNL toward network modernization and integration to enhance nationwide telecom infrastructure.
9. National Aluminium Company Ltd. (NALCO)
National Aluminium Company Ltd. (NALCO), founded in 1981, is one of Asia’s largest integrated aluminium producers, operating across mining, refining, smelting, and power generation. Headquartered in Bhubaneswar, NALCO exports aluminium and alumina to global markets. The company focuses on energy efficiency, sustainable mining, and expansion into renewable energy projects.
10. National Buildings Construction Corporation Ltd. (NBCC)
National Buildings Construction Corporation Ltd. (NBCC), incorporated in 1960, is a Navratna PSU under the Ministry of Housing and Urban Affairs. It provides project management consultancy, real estate development, and EPC contracting. NBCC has executed key government projects, including redevelopment of Delhi’s Central Vista and other major urban infrastructure works.
11. Neyveli Lignite Corporation Ltd. (NLC India Ltd.)
NLC India Ltd., established in 1956 under the Ministry of Coal, is a leading lignite mining and power generation company. Operating in Tamil Nadu and other states, it produces thermal and renewable energy. NLC is expanding into solar and wind energy projects, reinforcing India’s push toward cleaner power generation.
12. Rashtriya Ispat Nigam Ltd. (RINL)
Rashtriya Ispat Nigam Ltd. (RINL), known as Vizag Steel, was incorporated in 1982 and operates the Visakhapatnam Steel Plant. It specializes in long steel products for construction and infrastructure industries. As one of India’s leading steel producers, RINL contributes to national development through efficient operations, exports, and modernization initiatives.
13. Shipping Corporation of India Ltd. (SCI)
Shipping Corporation of India Ltd. (SCI), founded in 1961, is India’s largest shipping company offering maritime transport for crude oil, coal, fertilizers, and bulk cargo. It operates tankers, bulk carriers, passenger ships, and offshore vessels. SCI plays a crucial role in facilitating India’s seaborne trade and energy logistics network.
14. Indian Railway Catering & Tourism Corporation Ltd. (IRCTC)
Indian Railway Catering & Tourism Corporation Ltd. (IRCTC), established in 1999, manages online railway ticketing, catering, and tourism for Indian Railways. It operates India’s largest e-ticketing platform, serves millions daily, and manages premium trains like the Maharajas’ Express. IRCTC is expanding into hospitality, packaged drinking water, and tourism services.
15. Rashtriya Chemicals & Fertilisers Ltd. (RCF)
Rashtriya Chemicals & Fertilisers Ltd. (RCF), formed in 1978, is a leading producer of fertilizers and industrial chemicals. It manufactures urea, complex fertilizers, and chemicals like methanol and ammonium nitrate. RCF supports Indian agriculture with efficient fertilizer supply chains and sustainability-focused initiatives aimed at improving soil health and productivity.
16. IRCON International Ltd.
IRCON International Ltd., incorporated in 1976, is a public sector construction company under the Ministry of Railways. It executes railway, highway, and bridge infrastructure projects across India and internationally. Known for technical excellence and timely delivery, IRCON has built major infrastructure in difficult terrains and several foreign countries.
17. RITES Ltd.
RITES Ltd., founded in 1974, is a leading transport infrastructure consultancy and engineering company under the Ministry of Railways. It offers project management, turnkey solutions, and export of rolling stock. RITES operates in over 55 countries and is a key contributor to India’s railway modernization and international infrastructure presence.
18. National Fertilisers Ltd. (NFL)
National Fertilisers Ltd. (NFL), incorporated in 1974, is India’s second-largest urea producer and a major supplier of nitrogenous fertilizers. It operates five gas-based plants and provides agrochemicals, seeds, and soil health solutions. NFL plays a key role in supporting Indian agriculture through efficient production and farmer engagement programs.
19. ONGC Videsh Ltd. (OVL)
ONGC Videsh Ltd. (OVL) is the international arm of ONGC, engaged in oil and gas exploration and production overseas. Operating in over 30 countries, OVL contributes to India’s energy security by acquiring hydrocarbon assets abroad. Its global portfolio spans Asia, Africa, and Latin America across multiple upstream projects.
20. Housing & Urban Development Corporation Ltd. (HUDCO)
Housing & Urban Development Corporation Ltd. (HUDCO), founded in 1970, provides long-term finance for housing and infrastructure projects. It supports affordable housing, water supply, roads, and sanitation initiatives. HUDCO plays a critical role in India’s urban development mission and promotes inclusive growth through sustainable financing solutions.
21. RailTel Corporation of India Ltd.
RailTel Corporation of India Ltd., established in 2000, is a telecom infrastructure provider under Indian Railways. It manages an extensive nationwide optic fiber network and offers broadband, data center, and cloud services. RailTel also supports the government’s Digital India mission by enabling connectivity in rural and remote areas.
22. Indian Railway Finance Corporation Ltd. (IRFC)
Indian Railway Finance Corporation Ltd. (IRFC), founded in 1986, is the dedicated financial arm of Indian Railways. It mobilizes funds from domestic and international markets to support railway expansion, electrification, and modernization projects. IRFC plays a pivotal role in funding India’s growing transportation and logistics infrastructure.
23. NHPC Ltd.
NHPC Ltd., formerly National Hydroelectric Power Corporation, was established in 1975. It is India’s leading hydropower company engaged in the design, construction, and operation of hydroelectric projects. NHPC is expanding into solar and wind power, supporting India’s renewable energy goals and sustainable development agenda.
24. SJVN Ltd.
SJVN Ltd., earlier Satluj Jal Vidyut Nigam Ltd., was incorporated in 1988 as a joint venture between the Government of India and Himachal Pradesh. It operates in hydro, solar, and wind energy sectors. SJVN’s flagship project, the Nathpa Jhakri Power Station, is India’s largest hydroelectric plant.
25. Bharat Sanchar Nigam Ltd. (BSNL)
Bharat Sanchar Nigam Ltd. (BSNL), founded in 2000, is India’s largest government-owned telecom company. It provides mobile, broadband, and enterprise communication services across urban and rural India. BSNL plays a crucial role in digital connectivity and is expanding its 4G and 5G infrastructure under the government’s telecom revival plan.
Performance of the Navratna Companies
Company
1-Year Returns
3-Year Returns
5-Year Returns
Bharat Electronics Ltd.
46.79%
282.84%
1,307.69%
Rail Vikas Nigam Ltd.
-26.84%
608.90%
1,703.59%
Mazagon Dock Shipbuilders Ltd.
34.03%
591.09%
3,154.52%
Indian Renewable Energy Development Agency Ltd.
-26.13%
–
–
NMDC Ltd.
-1.56%
99.62%
161.23%
Container Corporation of India Ltd
-19.07%
-14.78%
70.47%
Engineers India Ltd
2.57%
172.37%
208.40%
Mahanagar Telephone Nigam Ltd.
-12.15%
97.65%
360.77%
National Aluminium Company Ltd.
0.51%
216.29%
664.42%
National Buildings Construction Corporation Ltd.
16.86%
405.75%
663.53%
Neyveli Lignite Corporation Ltd.
2.99%
235.68%
440.21%
Shipping Corporation of India Ltd.
17.83%
80.79%
403.10%
Indian Railway Catering & Tourism Corporation Ltd.
-12.01%
-5.31%
176.11%
Rashtriya Chemicals & Fertilisers Ltd.
-3.69%
49.91%
251.98%
IRCON International Ltd.
-19.97%
246.06%
346.24%
RITES Ltd.
-19.97%
246.06%
346.24%
National Fertilisers Ltd.
-12.95%
84.94%
201.08%
Housing & Urban Development Corporation Ltd.
5.77%
485.86%
656.10%
RailTel Corporation of India Ltd.
-10.17%
194.18%
–
Indian Railway Finance Corporation Ltd.
-20.20%
415.95%
390.92%
NHPC Ltd
0.84%
91.78%
315.84%
SJVN Ltd
-21.57%
142.05%
295.38%
(As of 03 November 2025)
Key Performance Indicators
Company
ROE (in %)
ROCE (in %)
Debt-to-Equity
P/E (x)
P/B (x)
Bharat Electronics Ltd.
24.4
30.13
0
51.67
13.42
Rail Vikas Nigam Ltd.
18
16.74
0.68
82.8
13.78
Mazagon Dock Shipbuilders Ltd.
31.02
35.65
0
39.22
15.68
Indian Renewable Energy Development Agency Ltd.
14.62
42.69
5.80
50.93
7.98
NMDC Ltd.
21.71
30.49
0.13
11.26
2.59
Container Corporation of India Ltd
10.40
13.49
0
26.1
3.4
Engineers India Ltd
21.7
23.4
0
15.5
3.3
Mahanagar Telephone Nigam Ltd.
0
14.88
-1.20
-0.8
-0.10
National Aluminium Company Ltd.
-21.5
-15.6
0.93
-22
4.79
National Buildings Construction Corporation Ltd.
21.82
29.96
0
40.95
8.92
Neyveli Lignite Corporation Ltd.
14.00
9.92
1.20
12.5
1.81
Shipping Corporation of India Ltd.
10.14
10
0.23
9.13
0.93
Indian Railway Catering & Tourism Corporation Ltd.
35.88
43.18
0
44.28
15.88
Rashtriya Chemicals & Fertilisers Ltd.
5.10
9.21
0.58
28.59
1.46
IRCON International Ltd.
11.49
8.93
0.67
20.24
2.32
RITES Ltd.
14.57
19.06
0
27.89
4.07
National Fertilisers Ltd.
6.77
7.49
0.73
21.43
1.45
Housing & Urban Development Corporation Ltd.
15.07
52.29
5.97
14.74
2.22
RailTel Corporation of India Ltd.
14.99
19.20
0
32.39
4.86
Indian Railway Finance Corporation Ltd.
12.34
49.98
7.83
24.98
3.09
NHPC Ltd
7.57
6.21
0.99
30.22
2.08
SJVN Ltd
5.78
4.45
1.90
44.03
2.54
(All the above data is for the year ended March 2025)
To summarize, Navratna companies are a valuable asset to India’s economy. These companies generate revenue and create job opportunities, making them instrumental in driving India’s growth. Their performance and contributions have made them leading players in their respective sectors. These companies have exhibited a remarkable track record of innovation and resilience, which will serve as a strong foundation for their future endeavors. With their extensive resources, talented workforce, and commitment to excellence, the Navratna companies are well-positioned to drive their growth and contribute to the overall development of the nation.
S.NO.
Check Out These Interesting Posts You Might Enjoy!
The Indian economy is driven by many companies contributing to its growth and development. These companies vary in size, ownership, control, and access to capital, reflecting the country’s diverse corporate landscape. However, companies must be categorized to promote effective corporate governance.
In this blog, we will discuss the types of companies based on size, number of members, control, liability, and access to capital.
What is a Company?
A company is a legal entity formed by a group of individuals to engage in and operate a business or enterprise. It is a separate legal entity from its owners, meaning it can own assets, incur liabilities, enter into contracts, sue, and be sued. It has perpetual succession, a common seal, and is subject to statutory compliance. The purpose of the companies is generally to generate profit for their owners, although some, like Section 8 Companies, may be formed for charitable or social purposes.
List of Different Types of Companies in India
Category
Type
Definition/Act
Categorization Based on Size
Micro Enterprise
MSMED Act, 2006
Small Enterprise
MSMED Act, 2006
Medium Enterprise
MSMED Act, 2006
Categorization Based on Number of Members
One Person Company (OPC)
Section 2(62) of Companies Act, 2013
Private Limited Company
Section 2(68) of Companies Act, 2013
Public Limited Company
Section 2(71) of Companies Act, 2013
Categorization Based on Control
Sole Proprietorship
Recognized under Income Tax Act
Private Limited Company
Companies Act, 2013
Public Limited Company
Companies Act, 2013
Government-Owned Company (PSU)
Section 2(45) of Companies Act, 2013
Categorization Based on Liability
Sole Proprietorship
Not defined under Companies Act
Partnership Firm
Indian Partnership Act, 1932
Limited Liability Partnership (LLP)
LLP Act, 2008
Private Limited Company
Companies Act, 2013
Public Limited Company
Companies Act, 2013
Categorization Based on Access to Capital
Sole Proprietorship
Not defined under Companies Act
Partnership Firm
Indian Partnership Act, 1932
Private Limited Company
Companies Act, 2013
Public Limited Company
Companies Act, 2013
Section 8 Company
Section 8 of Companies Act, 2013
Here’s a detailed categorization of Indian companies based on size, number of members, control, liability, and access to capital, as per the Companies Act, 2013:
The MSME Act classifies companies based on their size to give benefits the government provides for MSMEs.
1. Categorization Based on Size
Based on the size, companies can be categorized as:
Micro, Small, and Medium Enterprises (MSMEs):
Companies are categorized based on size under the Micro, Small, and Medium Enterprises Development (MSMED) Act, 2006, but often referenced in the context of companies under the Companies Act.
Micro Enterprises:
Investment: Up to ₹1 crore.
Annual Turnover: Up to ₹5 crore.
Small Enterprises:
Investment: Between ₹1 crore and ₹10 crore.
Annual Turnover: Between ₹5 crore and ₹50 crore.
Medium Enterprises:
Investment: Between ₹10 crore and ₹50 crore.
Annual Turnover: Between ₹50 crore and ₹250 crore.
2. Categorization Based on Number of Members
Based on the number of members, companies can be categorized as:
One Person Company (OPC):
Definition: Under Section 2(62) of the Companies Act, 2013.
Members: One individual is the sole member.
Characteristics: The OPC allows a single entrepreneur to start and manage a company with limited liability, with provisions for a nominee in case of the sole member’s death or incapacity.
Private Limited Company:
Definition: Under Section 2(68) of the Companies Act, 2013.
Members: Minimum of 2 members, maximum of 200.
Characteristics: Shares are not freely transferable, and the company cannot invite the public to subscribe to its shares.
Public Limited Company:
Definition: Under Section 2(71) of the Companies Act, 2013.
Members: Minimum of 7 members, no maximum limit.
Characteristics: Can issue shares to the public, and shares are freely transferable. These companies are usually listed on stock exchanges.
3. Categorization Based on Control
Based on control, companies can be categorized as:
Sole Proprietorship:
Definition: It is not defined under the Companies Act but is recognized under various laws, such as the Income Tax Act.
Control: Controlled by a single individual.
Characteristics: The owner has full control over business operations, and there is no distinction between personal and business assets.
Private Limited Company:
Control: Controlled by directors, often with significant influence from shareholders.
Characteristics: Decisions are made by the board of directors, with major shareholders often having significant influence.
Public Limited Company:
Control: Controlled by a board of directors elected by the shareholders.
Characteristics: Ownership and management are separate, with control exercised by the elected board.
Government-Owned Companies (PSUs):
Definition: Under Section 2(45) of the Companies Act, 2013.
Control: Controlled by the government, which holds a majority stake.
Characteristics: Operates in sectors deemed crucial by the government, such as defense, energy, and infrastructure.
4. Categorization Based on Liability
Based on liability, companies can be categorized as:
Sole Proprietorship:
Liability: Unlimited liability.
Characteristics: The owner is personally responsible for all debts, and there is no legal distinction between personal and business assets.
Partnership Firm:
Liability: Unlimited liability for all partners.
Characteristics: Every partner is liable, jointly with all the other partners, for all acts of the firm.
Limited Liability Partnership (LLP):
Definition: Under the Limited Liability Partnership Act, 2008.
Liability: Limited liability for partners.
Characteristics: Partners’ liability is limited to their contribution, and the LLP has a separate legal existence. No partner is liable on account of the independent or unauthorized acts of other partners.
Private Limited Company:
Liability: Limited liability.
Characteristics: Shareholders are liable only up to the value of their shares, which means shareholders are not liable to sell their personal assets in case of a loss.
Public Limited Company:
Liability: Limited liability.
Characteristics: Shareholders are not personally liable for the company’s debts beyond the amounts of their investments.
5. Categorization Based on Access to Capital
Based on access to capital, companies can be categorized as:
Sole Proprietorship:
Access to Capital: Limited.
Characteristics: Funding is typically from personal savings, small loans, or family resources.
Partnership Firm:
Access to Capital: Moderate.
Characteristics: Partners pool their resources with additional funding from loans based on the firm’s credit.
Private Limited Company:
Access to Capital: Moderate to high.
Characteristics: Can raise capital through private placements, venture capital, or loans but cannot raise capital from the public.
Public Limited Company:
Access to Capital: High.
Characteristics: Can raise capital by issuing shares and debentures to the public, listing on stock exchanges, and other financial instruments.
Section 8 Company:
Definition: Under Section 8 of the Companies Act, 2013.
Access to Capital: Limited to donations, grants, and philanthropic funding.
Characteristics: Cannot distribute profits to members; profits are reinvested in the company’s objectives.
Each of these categories presents a different aspect of how companies in India are structured and operate, from the scale of their operations to their financial and legal framework.
There are different types of companies in India, so different stakeholders, like entrepreneurs, investors, and businesses, can operate efficiently within a legal framework. Every company serves a different purpose, from small startups to large multinational corporations, providing flexibility in terms of ownership, control, liability, and access to capital, as there are different regulations for different types of companies. Understanding these different types of companies is important for anyone looking to start, manage, or invest in a business in India.
S.NO.
Check Out These Interesting Posts You Might Enjoy!
An OPC, or a One Person Company, is a type of company in India where a single individual can own and manage the business with limited liability protection. It is ideal for entrepreneurs who want to maintain full control while enjoying the benefits of a corporate structure.
What is the difference between a Partnership Firm and a Limited Liability Partnership?
A Partnership Firm is a business owned by two or more individuals with unlimited liability, where partners are personally liable for the business’s debts and liabilities. On the other hand, an LLP provides limited liability protection to its partners, meaning they are only liable to the extent of their investment.
What is a Section 8 Company?
It is a non-profit organization in India that promotes social welfare activities such as education, arts, environment preservation, sports, charity, etc. These companies reinvest their profits and enjoy tax benefits and other exemptions.
Can a foreign company establish a business in India?
A foreign company can establish a business in India through various routes, including a joint venture with an Indian partner or establishing a branch office, liaison office, or project office. India’s Foreign Direct Investment (FDI) policy controls these processes.
What are the criteria for qualifying as a Micro Enterprise?
Investment in the plant and machinery can’t exceed INR 1 crore, and annual turnover must not exceed INR 5 crore for a company to qualify as a Micro Enterprise.
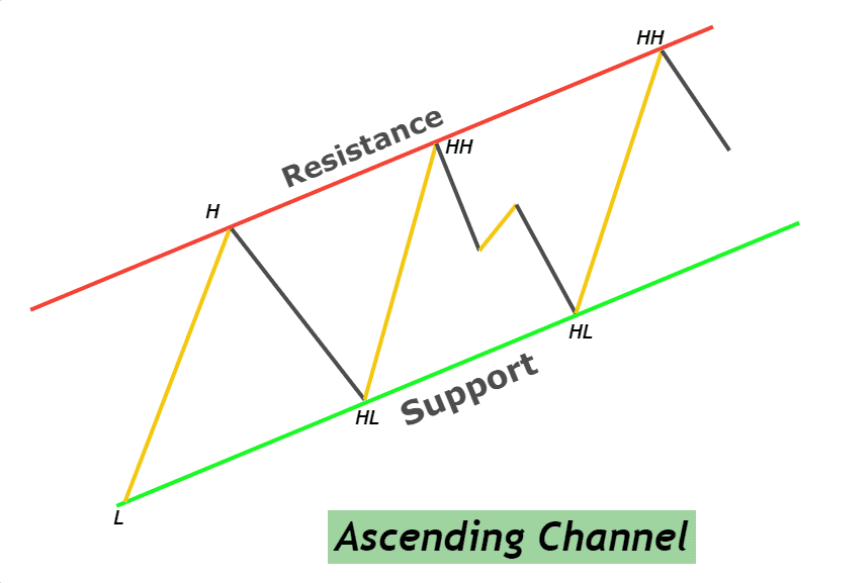
Ever wondered how traders manage to find precise buying and selling points in an uptrending market? The answer usually refers to recognizing patterns, such as the ascending channel. This powerful chart pattern portrays an ongoing uptrend by displaying a series of higher highs and higher lows, making it one of the favorite chart patterns of traders who want to surf the wave of market momentum.
In this blog, we will discuss how mastering the ascending channel sharpens your trading edge.
What is the Ascending Channel Pattern?
The ascending channel pattern is a bullish chart pattern in which two parallel upward-sloping trend lines contain all the price fluctuations. One trend line connects the higher highs, while the other trend line connects the higher lows, reflecting a consistent uptrend. This pattern signals that the buyers are in control, driving prices steadily higher while establishing predictable support and resistance areas.
It is also used by traders for the ascending channel to determine buying points near the lower trend line and selling points near the upper trend line. A breakout above the upper trendline indicates an accelerated trend continuation. A breakdown below the lower trend line indicates a potential trend reversal. Hence, it is very crucial to pay close attention to other confirmation signals.
Interpretation of Ascending Channel Pattern
The ascending channel pattern is generally viewed as a solid and steady uptrend, showing the market’s bullish sentiment. Herein lies the interpretation:
Trend Continuation: The pattern often indicates a continuation of the prevailing bullish trend. If the price remains in the channel, this reflects sustained upward buying pressure, wherein traders can expect bullish movement.
Support and Resistance Zones: The lower trendline then acts like a support level where buying pressure tends to increase, while the upper trendline serves as a resistance level where selling pressure builds. This creates predictable zones for making long and short positions.
Possible Breakouts: A breakout above the higher trend line would indicate a probable acceleration in the uptrend and can be a buying opportunity. In contrast, a breakdown below the lower trend line could hint at the reversal of the trend, thus signaling to traders that they should create short positions.
Indicator of Market Sentiment: The upward slope of the channel indicates positive market sentiment. The slope of the channel defines how aggressive the buying interest is, thus informing the traders about the trend’s sustainability.
An individual can use the following steps to trade using an Ascending Channel Pattern:
Step 1. Identification of Ascending Channel:
An ascending channel is created by drawing two parallel trend lines connecting higher highs, acting as a resistance, and higher lows, acting as a support.
At least three points must be connected by upper and lower trendlines to confirm the channel.
The price fluctuates between these two trend lines, forming an upward channel.
Step 2. Confirm the Trend:
Generally speaking, this pattern will occur under an uptrend.
Indicators like moving averages help further confirm the uptrend. The price will be above a 50-day and 200-day moving average.
Step 3. Entry Points:
Buy at Support: Create a long position whenever the price touches the lower trendline (support line). Confirm its rebound with the hammer or engulfing candlestick pattern.
Sell at Resistance: Create a short position whenever the price touches the upper trendline (resistance line). Confirm its rebound with the inverted hammer or engulfing candlestick pattern.
Wait for Breakout Confirmation: A breakout above the upper trendline (resistance line) could confirm a continued uptrend. A breakdown below the lower trendline (support line) could confirm a bearish trend. If the breakout or breakdown occurs with high volumes, it will increase the chances of a bullish or bearish trend.
Step 4. Set Stop-Loss:
Below Resistance Line: Place a stop-loss slightly below the upper trendline – the resistance line – to protect against a false breakout. In case of a false breakdown, place the stop-loss slightly above the lower trend line to avoid losses.
Below Recent Swing Low: Alternatively, place the stop-loss below the most recent swing low outside the channel.
Step 5. Define Take-Profit Levels:
Near Trend Line: Take partial profit near the trend lines and wait for a breakout or breakdown with reduced quantity.
Based on Breakout: If it’s a breakout trade, project the target price based on either channel height or use Fibonacci extensions to estimate probable take-profit levels.
Step 6. Continuation or Reversal Signals through the Channel:
Monitor changes in volume, price action, or technical indicators such as RSI or MACD. These can be used to identify a weakening trend or an upcoming reversal.
The breakdown below the lower trendline could be a potential indication to start considering short positions.
Step 7. Adjust Stop-Loss and Take-Profit Orders:
Move your stop-loss to lock in profits as the price moves in your favor. This could be done by moving the stop-loss to your breakeven point.
Continuously monitor the trade and book profit after analyzing market conditions and channel development.
Key takeaways
Volume confirmation: Always look for entry and breakout confirmation using volume data. Greater volume at breakout points decreases the possibility of a false breakout or breakdown.
Risk Management: Traders must trade based on a good risk-reward ratio.
Avoid overtrading: Do not chase trades when the price moves away from the lower trendline. Only enter if prices are near the trend lines or wait for a breakout or breakdown.
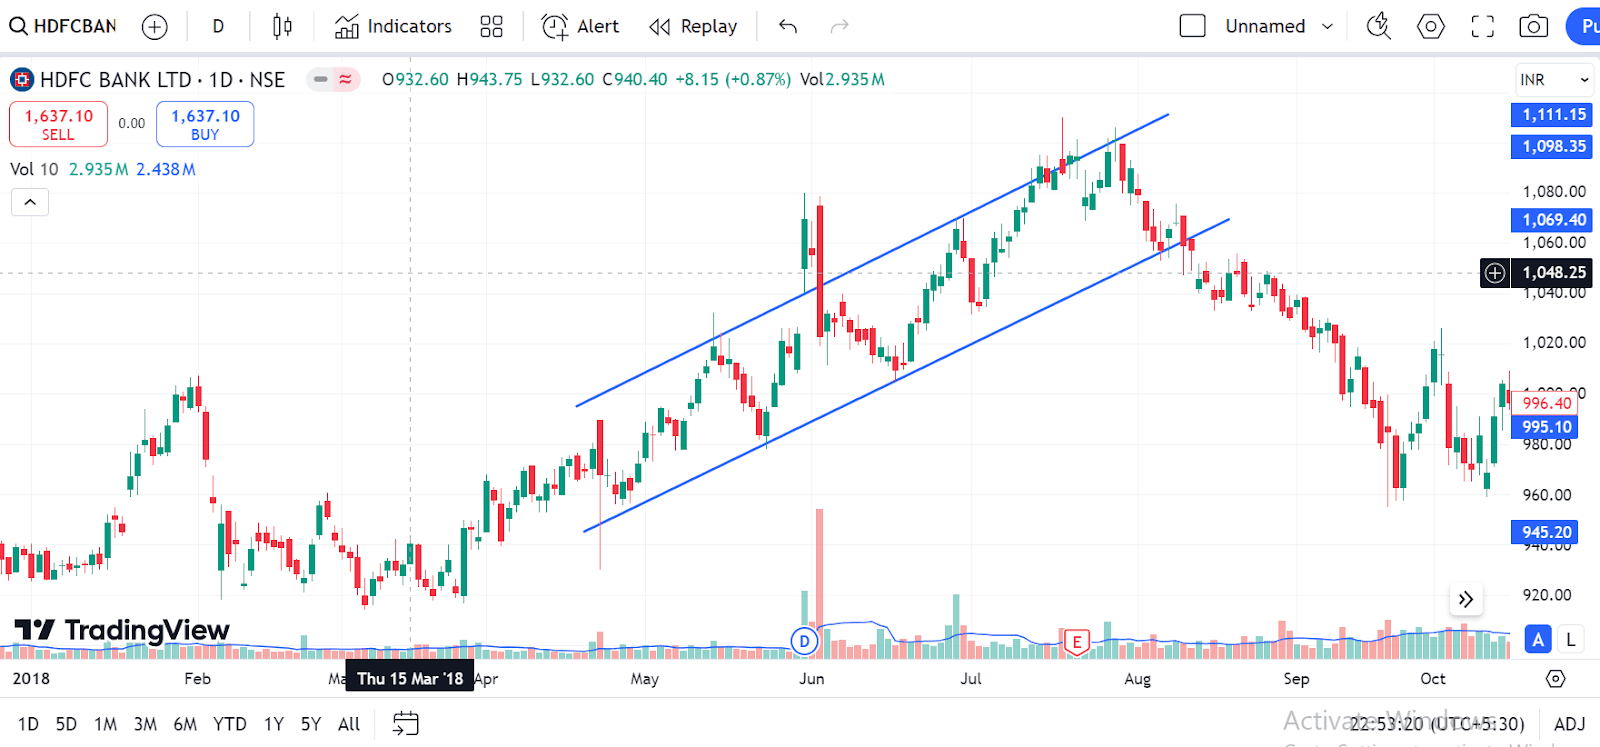
Below is the chart of HDFC Bank Ltd. for a one-day time frame. The chart below shows the upper and lower trend lines in the ascending channel pattern, which can also be viewed as resistance and support lines. Likewise, the higher and lower low points touching this resistance and support can also be considered resistance and support points, respectively.
Advantages of Ascending Channel Pattern
The advantages of the Ascending Channel pattern are:
Definitive Identification of Trend: The ascending channel pattern indicates an ongoing uptrend. It is easy to recognize, and an individual can easily use it.
Predictable Entry and Exit Points: Another key feature of this pattern is its predictable entry and exit points. One can buy near the lower trendline, acting as support, and sell near the upper trendline, acting as resistance. Thus, the profit will be maximized while minimizing risk.
Timeframe Diversity: It can be applied to numerous timeframes, making the ascending channel helpful for short-term and long-term traders. Whether you are day trading or swing trading, this pattern can be used.
Limitations of Ascending Channel Pattern
The limitations of the Ascending Channel pattern are:
Risks of false breakout: The pattern is susceptible to false breakouts when the price breaks the upper or lower trendline and then reverses. This can result in early trade entries and stop-loss order execution, causing possible losses.
Inability to determine when the pattern will terminate: It is difficult to determine when an Ascending Channel will end. Sometimes, the price breaks out or breaks down unexpectedly and surprises traders, resulting in a missed opportunity to trade or can result in potential losses.
Over-reliance can be hazardous: One should not overly depend on an ascending channel pattern and neglect other indicators or market conditions. The accuracy of the pattern decreases in volatile market conditions.
The Ascending Channel pattern is an exceptional technique traders utilize to identify bullish trends and take long and short positions. Once identified, the trader can see a pattern of higher highs and higher lows, forming inside parallel trendlines. This pattern provides a roadmap for the trader to buy near support, sell near resistance, or wait for breakouts. Risk management techniques, such as stop-loss and take-profit orders, can be used to manage risks. However, it is advised to consult a financial advisor before investing.
Frequently Asked Questions (FAQs)
What is a false breakout in an Ascending Channel Pattern?
A false breakout occurs when the asset price briefly exits the channel and then abruptly enters the channel again.
How can traders use the Ascending Channel Pattern to identify target levels?
It enables traders to set target levels near the trendlines if the asset price fluctuates inside the channel. If the price moves outside the channel, the target price can be calculated using the channel width or other technical indicators.
What risks are involved in trading with an Ascending Channel Pattern?
The risks are false breakouts and sudden reversals that might catch the trader off guard, especially when traded without using other indicators.
How is volume important in the Ascending Channel Pattern?
Volume can be used for confirmation, as higher volumes during breakouts or breakdowns can decrease the probability of a false signal.
Can an Ascending Channel Pattern reverse into a downtrend?
A downtrend can occur after an Ascending Channel pattern if the price breaks below the lower trendline with strong volume.
Are you interested in elevating your proficiency in technical analysis? Descending Channel pattern provides a structured approach for identifying downtrends and presents profit opportunities in financial markets.
In today’s blog, we will learn about the intricacies of the descending channel pattern and how a trader can interpret it.
What is a Descending Channel Pattern?
The descending channel pattern is a technical analysis chart pattern that indicates a possible reversal towards a bearish trend. It can be observed as a sequence of declining peaks and troughs, creating a channel exhibiting a downward slope.
When a clear breakdown occurs, it is advisable to enter a short position to capitalize on the ongoing downward trend and maximize profits.
Remember that a narrower channel often showcases a stronger trend and a higher probability of a breakout.
Interpretation Of Descending Channel Pattern
A Descending channel chart pattern has the following phases:
Downward Slope – The upper and lower trend lines move parallel to each other in a downward direction, creating a narrow channel.
Price Action – The price should repeatedly rebound from both the upper and lower trendlines.
Lower Highs and Lower Lows – Each new high is lower than the previous one, and each new low is also lower than the previous one.
Breakdown Alert – This pattern is generally considered to have given a breakdown when the price falls below the lower trendline, which signals the continuation of the bearish trend.
Additionally, it is suggested to be cautious of false breakdowns, where the price briefly breaks below the lower trendline but then reverses.
How to Determine Target & Stop Loss?
Extend the lower trendline to project a possible target price. This is based on the premise that the price will continue to decrease and remain within the channel.
You can also search for previous support and resistance levels within the channel that could serve as targets. These levels can be identified using horizontal lines or technical indicators.
In case of a breakdown, set a stop-loss above the most recent high within the channel. This ensures the trade is closed if the price reverses and moves above the upper trendline.
Furthermore, assess your risk tolerance and establish an appropriate stop-loss level. For instance, if you are willing to risk 2% of your account balance on a trade, adjust your stop-loss accordingly or decrease your position size.
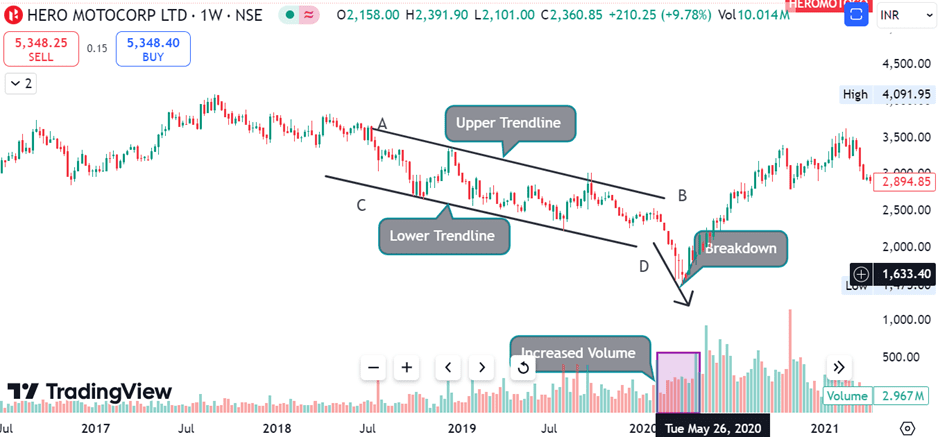
The image above is the weekly chart of ‘Hero MotoCorp Limited.’
It is evident from the chart that the price has been declining over the past few weeks, forming a series of lower highs and lower lows. Upon closer inspection, you can see two downward-sloping trend lines: the Upper Trendline, where the price has repeatedly been rejected, depicting resistance, and the Lower Trendline, where the price has found support several times, preventing further declines.
The price oscillates between these two trendlines, creating a descending wedge or channel shape. As soon as it breaks below the lower trendline with increased volume, traders will enter a short position, considering it a bearish breakdown.
Advantages of Descending Channel Pattern
The advantages of the Descending Channel pattern are:
Clear Indication of a Trend – It offers a visually distinct representation of a bearish trend. This makes it easier for traders to recognize the ongoing trend and make better trading decisions.
Risk Management – Traders can limit potential losses by using stop-loss orders based on the upper trendline if the price reverses unexpectedly after giving a breakdown below the lower trendline.
Simple – This pattern is relatively easy to use and implement.
Limitations of Descending Channel Pattern
The limitations of the Descending Channel pattern are:
False Breakdowns – At times, prices may temporarily breach the lower trendline but swiftly rebound, causing a false breakdown. This situation can result in losses for traders who enter short positions too early.
Subjectivity – Different traders may draw trend lines with slight variations, resulting in different interpretations of the pattern.
Need for Confirmation – Confirmation is required before entering a trade when there is a breakdown below the lower trendline. You may need to wait for a retest of the lower trendline or look at other technical indicators for better accuracy.
To summarize, the descending channel pattern is an incredibly powerful tool in technical analysis. It provides traders a reliable method to identify bearish trends and possible reversal points. Understanding the formation of this pattern can help traders enhance their ability to navigate markets effectively. However, it may still produce false signals, especially in volatile markets where price fluctuations can be erratic and unpredictable. Traders should always use additional analysis and risk management strategies to validate their trading decisions. Eventually, a trader should always remember that patience and discipline are integral components to succeed in trading. It is advisable to consult a financial advisor before trading.
Frequently Asked Questions (FAQs)
What is the difference between a Descending Channel and a Triangle pattern?
Both patterns are bearish, but a triangle has converging trend lines that meet at a point, and the channel has parallel trendlines.
Can a Descending Channel pattern give a bullish reversal?
A bullish breakout above the upper trendline can hint at a possible reversal of the bearish trend.
What role does volume play in a Descending Channel pattern?
Decreasing volume within the channel shows weakening momentum, and a spike in volume during the breakout can confirm the move.
Is the Descending Channel pattern applicable to all time frames?
The pattern can be used in different timeframes, including daily, weekly, monthly, etc.
How can I improve my accuracy in trading the Descending Channel pattern?
A trader can increase accuracy by using other technical indicators with the Descending Channel pattern.
Open Free Demat Account
Join Pocketful Now
You have successfully subscribed to the newsletter
There was an error while trying to send your request. Please try again.