You save a lot of money and put in a lot of work, but you need help determining where to keep it. It is only possible to retain some of your hard-earned savings at home; opening a bank account is your only option. You might be surprised to hear that banks where you have accounts allow you to invest in their business.
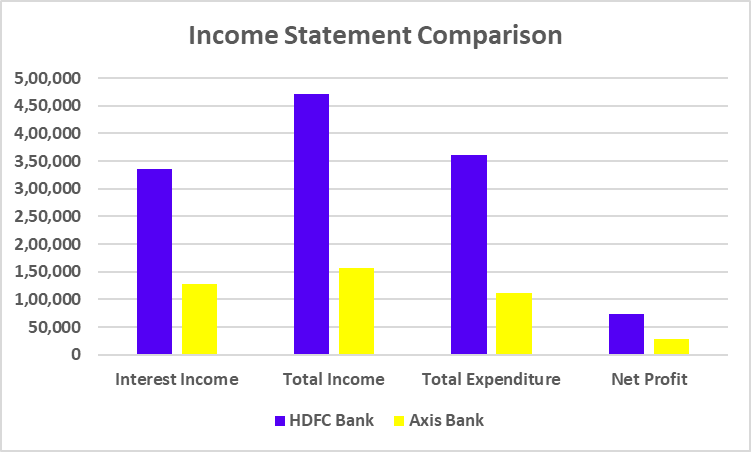
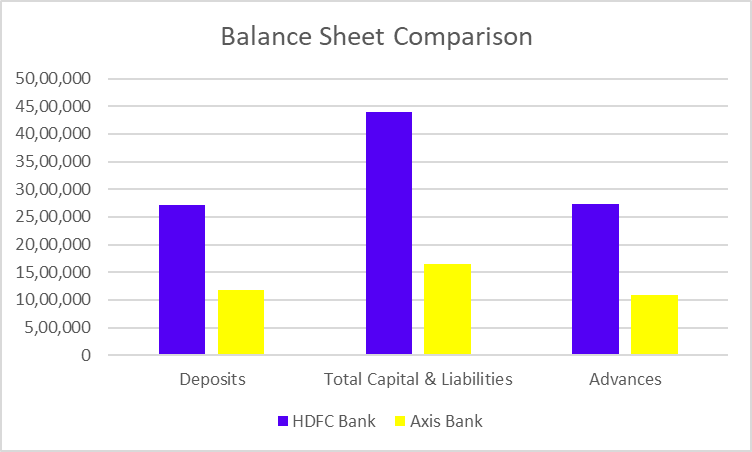
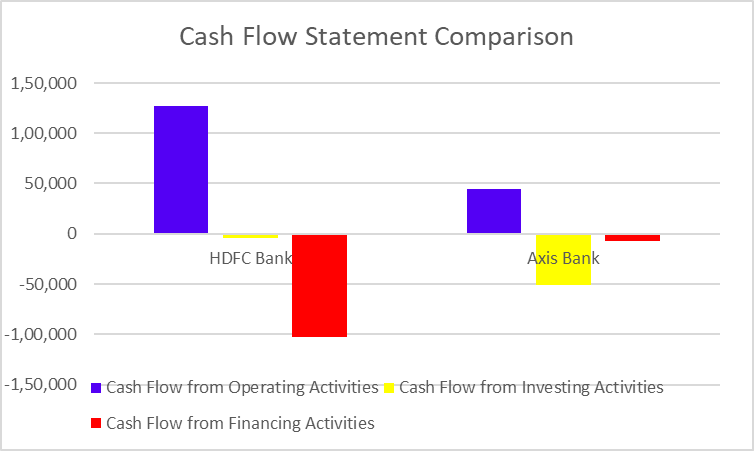
This blog post will compare HDFC Bank and Axis Bank.
HDFC Bank Overview
HDFC Bank was established in 1994 as a subsidiary of HDFC Ltd. The Reserve Bank of India granted it a banking license in January 1995. In November 1995, the bank launched its Initial Public Offering (IPO) and became a listed company on the Bombay Stock Exchange and the National Stock Exchange. In 2000, the Times Bank merged with HDFC Bank. HDFC Bank acquired Centurion Bank of Punjab to increase its branch network and clientele. The bank’s business philosophy is based on five core values: Operational Excellence, Customer Focus, Product Leadership, People, and Sustainability.
HDFC Ltd. or Housing Development Finance Corporation Ltd. was merged with HDFC Bank in 2023, The merger officially came into effect on July 1,2023 it’s India’s largest-ever M&A deal. The bank provides a wide range of financial products and services, such as retail banking, wholesale banking, loans, credit cards, savings accounts, current accounts, investment products, etc. The company’s headquarters is in Mumbai.
Axis Bank was initially established as UTI Bank by a joint venture between the Life Insurance Corporation of India, Unit Trust of India (UTI), and other business houses. UTI Bank’s operations started in 1994 when the first branch in Ahmedabad was opened. In 2007, UTI Bank was renamed “Axis Bank”. It soon became a well-established and recognized bank in the Indian Banking sector. This was a turning point in the history of Axis Bank because it became an aggressive player with a focus on branch expansion and innovation. Additionally, Axis Bank consistently made an effort to diversify its product portfolio. The bank now offers a variety of financial products, including credit cards, savings accounts, current accounts, brokerage facilities, and retail banking..
The comparison of India’s biggest private sector banks presented above leads us to conclude that while HDFC Bank has more revenue and profits overall, Axis Bank posts higher net profit margins even with less revenue. Although every bank has something special to offer, we always advise speaking with an investment expert before making investment decisions.
S.NO.
Check Out These Interesting Posts You Might Enjoy!
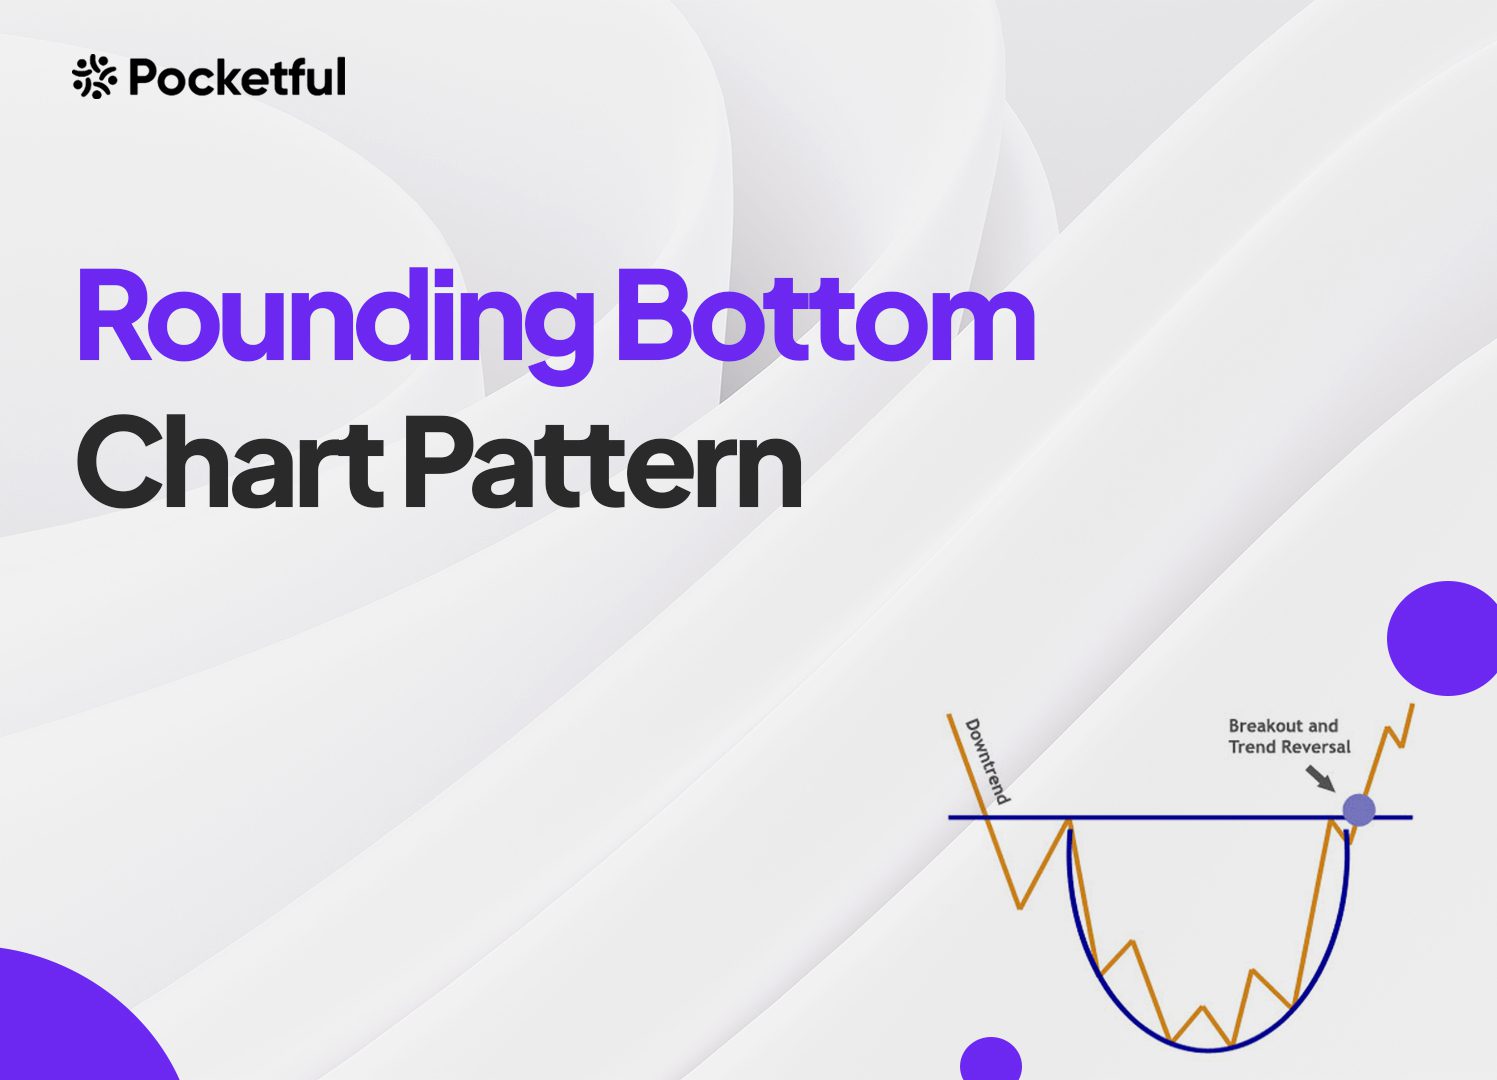
The Rounding Bottom chart pattern, also known as the Saucer Bottom pattern, is a bullish reversal pattern. The Rounding Bottom chart pattern indicates a change of trend from bearish to bullish because it initially forms a downtrend followed by a gradual uptrend. Rounding Bottom is one of the time-consuming patterns in technical analysis, which gives higher statistical accuracy. Let’s dig deeper into it.
What is the Rounding Bottom Pattern?
The name Rounding Bottom suggests that security forms a “U” Shape or a bowl shape on a chart. In this pattern, the asset price starts to fall steadily with a gradual decrease in volume. For some time, the asset price remains in a narrow range, and no sharp fall is seen. After remaining in a sideways range, the asset price slowly increases. The Rounding Bottom is considered a bullish reversal pattern as it indicates that the selling pressure is decreasing and the buying pressure is increasing, indicating a potential change in the trend direction.
How to Identify the Rounding Bottom Chart Pattern?
Look for the following characteristics to identify the Rounding Bottom chart pattern:
Downtrend: Before the pattern forms, the asset price shows a downtrend.
Gradual Decline: Price declines gradually with a slight curve-shaped formation on the chart.
Rounded Bottom: The price forms a rounded bottom that indicates the accumulation stage for the security. Investors accumulate security in this stage.
Increasing Volume: Price starts rising with an increase in volume, giving a clear indication of buying momentum.
Breakout: The breakout happens when an asset price breaks the previous high or resistance level, confirming the trend reversal.
Trading Setup
The Rounding Bottom pattern can be used to develop a trading setup, as shown below. However, trading based on chart patterns can be extremely complex, and investors must consult a financial advisor before investing. A Rounding Bottom chart pattern can be used in determining the following:
Entry Point: An entry point can be determined near the levels where the asset price breaks the resistance levels. Here, the resistance level is the same level from where the stock started falling. Investors can also use volume analysis to get confirmation.
Stop Loss: A stop loss should be placed ideally below the lowest point of the rounding bottom pattern to manage risk and limit losses.
Target: Measure the vertical distance from the bottom of the rounding pattern to the resistance level. Find the breakout point where the price first breaks the resistance and add that distance to the breakout price.
Trading Strategies
Here are a few trading strategies based on rounding bottom chart pattern:
Buy on breakout: Buy the security when the price first moves above the resistance level, confirming the trend reversal.
Buy on pullback: If you couldn’t buy at breakout, wait for a pullback to the support level, and then enter the trade.
Set stop-loss: Set a stop-loss below the lowest level of rounding bottom or after breakout around the nearest support level to limit potential losses.
Rounding Bottom chart pattern has the following advantages:
Easy to understand and identify.
It works in any market, such as equity markets, currency markets, commodity markets, etc.
It works in any time frame; a bigger time frame means strong trend reversal is on the cards.
This pattern provides information regarding stop-loss and target levels.
The pattern allows effective risk management as it gives clear stop-loss levels.
According to various studies, this pattern gives quite accurate results.
Limitations of Rounding Bottom Pattern
Rounding Bottom chart pattern has the following limitations:
The signals given by the pattern can be subjective because, on numerous occasions, complex patterns with multiple lows appear that are far from the ideal pattern.
It is a time-consuming pattern.
It could give a false breakout signal, which can result in losses.
This pattern could be affected by various market factors, such as volatility, news, policy change, political instability, etc.
The shape of the pattern could be different from the bookish ideal pattern.
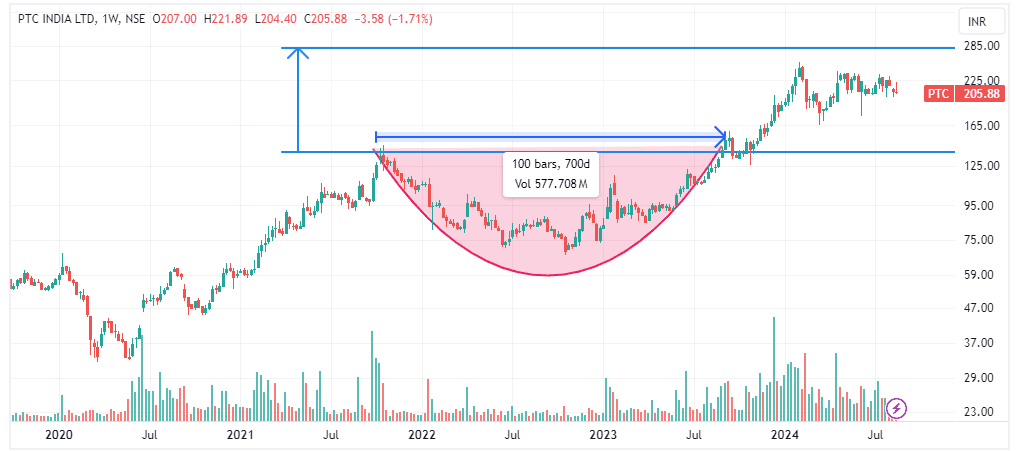
The above image shows the weekly chart of PTC India Ltd. The stock price gave a breakout with huge volumes on the weekly timeframe in November 2023. The stock started moving up and surpassed the highs of 2010, 2017, and 2021 and broke the resistance line joining these highs. In November, it broke the 2021 high of INR 140 and made a new high of INR 254, after which the stock gave sideways movements. The current market price is INR 205.
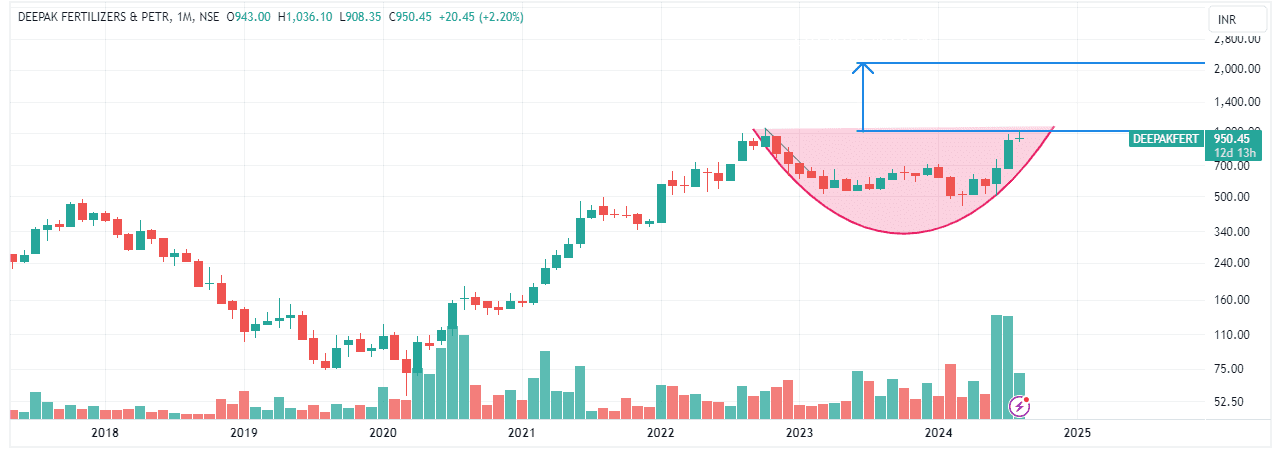
The above image shows the monthly chart of Deepak Fertilizers. The stock was in a downtrend for some time, and then it started making a Rounding Bottom chart pattern. From October 2022 to March 2024, the stock price fell from a high of INR 1062 to INR 450. The stock price started rising with big volumes and is about to break the neckline. It will be interesting to watch if it gives a breakout in the near future.
The Rounding Bottom chart pattern is a very powerful technical chart pattern for investors and traders alike. It is a time-consuming pattern but has the potential to offer significant gains. It is a trend reversal pattern that indicates the potential change in the trend direction. Initially, it is characterized by a slow and steady decline in the asset price, followed by a slow and steady increase in the price in a way that forms a rounded bottom. By understanding the pattern’s characteristics, trade setup, strategies, and pros and cons, traders and investors can make informed mid to long-term investment decisions and improve their chances of success in the markets. However, it is advised to consult a financial advisor before investing.
Frequently Asked Questions (FAQs)
In which market does the Rounding Bottom chart pattern work?
The rounding bottom pattern works in any market and time frame.
What is the success rate of the Rounding Bottom chart pattern?
It depends upon the market conditions and time frames. The longer the time frame (months or years), the higher the success rate.
How is the Rounding Bottom chart pattern different from the Cup and Handle chart pattern?
Generally, the Rounding Bottom chart pattern makes a smooth, rounded U-shape pattern with no additional formations, but the Cup and Handle pattern makes another smaller formation, which is either downward or sideways consolidation.
Is it easy to identify the Rounding Bottom chart pattern?
Yes, a rounding bottom pattern can be identified easily. Investors must look for a gradual downtrend followed by a gradual uptrend. Investors can create a long position when an asset price breaks the resistance level.
How can we use the Rounding Bottom chart pattern to determine stop loss?
Stop loss can be set as the lowest price point of the rounded bottom to prevent huge losses.
After putting in a lot of effort, you may have some capital left after paying for all your expenditures. However, one must be cautious when it comes to investing your assets. Nowadays, mutual funds and portfolio management services (PMS) are the most popular investment options available to investors, but do you know how to choose the right one for you?
In this blog, we provide information about mutual funds and PMS and the approach an investor must take to choose between them.
Overview of Mutual Fund
A mutual fund is a type of financial vehicle that pools the capital of several investors with similar investment goals or objectives. The pooled capital is invested in various asset classes, including equities, bonds, commodities, etc., by the fund managers, who are professionals in this field. After deducting expenses and fees, the investor gets the return on their investment. An asset management company, or AMC, is the organization in charge of this procedure.
In India, mutual funds can be categorized based on asset classes, financial goals and structure. There are four types of mutual funds in India based on asset class-
Equity Mutual Fund – Due to its vulnerability to fluctuations in the market, this specific mutual fund type is riskier than others because it typically invests in stocks or equities.
Debt Mutual Fund – Investors who invest in these funds are risk-averse because they invest in fixed-income securities such as government bonds, corporate bonds, and other fixed-income securities.
Hybrid Fund – This fund invests in both debt and equity. The portfolio of hybrid funds will have some allocation to debt to deliver stable and predictable returns, along with some equity allocation to achieve capital appreciation.
Money Market Fund – This type of mutual fund invests in low-risk money market instruments, such as treasury bills and commercial paper, with maturities less than a year.
Overview of Portfolio Management Services
Financial institutions offer portfolio management services or PMS. Investors may purchase this product, and a group of experienced fund managers will use their expertise to determine which asset classes to invest in.
Individuals typically set aside a percentage of their capital for investments, but if they don’t have the investing knowledge, they may not be able to invest it properly. Such investors can invest in portfolio management services (PMS) companies. Investment professionals manage the portfolio according to the client’s risk profile, investment objectives, and preferences. In exchange for these services, investment managers charge fees.
Types of portfolio management services are:
Discretionary PMS– Under this category of portfolio management services, the portfolio managers make all investment-related decisions on behalf of the client. Fund managers are not required to consult with investors before making investment decisions. Most customers select this kind of service.
Non-discretionary PMS– In this type of service, the fund manager needs the client’s approval before investing. The investment team of PMS provides financial advice to the client, who ultimately chooses whether or not to take it.
Difference Between Mutual Funds and PMS
Particular
Mutual Fund
PMS
Minimum Investment Amount
In mutual funds, the minimum investment amount starts from INR 100.
As per SEBI, a minimum investment amount of INR 50 Lakhs is required for PMS.
Customisation
A mutual fund does not allow investors to customize their portfolios.
PMS allows investors to customize portfolios according to their preferences.
Ownership of Assets
Investors don’t directly own underlying assets.
The investor has direct ownership of underlying securities.
Charges
Mutual funds have nominal fees compared to PMS, which generally have higher fees.
PMS has higher fees than mutual funds.
Risk
Mutual funds are suitable for investors with low-risk profiles.
It is typically ideal for high-risk investors.
Transparency
In mutual funds, investors can only track the performance of funds.
Investors of mutual funds can track and view every trade made in their accounts.
Factors to Consider Before Investing in Mutual Funds and PMS
The various factors to be considered before investing in mutual funds and PMS are as follows-
Risk Profile – The investor’s risk tolerance will determine whether they choose a mutual fund or PMS as their investment option. If investors are ready to take high risks, they should choose PMS.
Capital – If an investor has a substantial amount of money to invest, they may choose to opt for portfolio management services (PMS). Investors with a small capital to invest can choose mutual funds.
Expense Ratio – Mutual funds investments have a relatively lower expense ratio than PMS.
Return Potential – PMS generally offer higher potential returns than mutual funds. Hence, investors seeking better returns may invest in PMS instead of mutual funds.
Liquidity – Generally, PMS have longer lock-in periods than mutual funds.
In conclusion, there are advantages and disadvantages to investing in PMS and mutual funds. If investors want personalized investment services and have a sizable amount of money to invest, they should choose PMS. Investors should consider mutual funds if they have a lower initial investment amount. Investors should consult a financial advisor before investing.
S.NO.
Check Out These Interesting Posts You Might Enjoy!
What is the minimum investment amount required to open a PMS account?
The SEBI guideline states that a minimum investment of INR 50 lakhs is required to open a PMS account.
Which is better: PMS or Mutual Fund?
Mutual funds are suitable for individuals with a low-risk tolerance and a small amount to invest, while PMS is suitable for investors with a high-risk tolerance who have at least INR 50 lakh to invest.
Does PMS have exit loads?
Indeed, exit loads for certain portfolio management service companies typically range from 1% to 3%.
How are the profits from PMS taxed?
Profits earned by the PMS are subject to capital gains tax, and the tax rate varies according to the asset’s holding period.
Can an NRI invest in PMS in India?
NRIs can invest in PMS in India if they follow FEMA regulations and other compliance requirements.
Do you know there is a group that owns and operates more than 100 companies and has been playing a key role in the nation’s development for more than 140 years? Yes, you guessed it right, we’re talking about none other than the Tata group. It is extremely hard to imagine a sector that doesn’t feature a Tata company as one of its major players. Tata Sons Pvt. Ltd. is the parent company of Tata Group and is a major shareholder in the Tata Group of companies.
In this blog, we will discuss the stocks of Tata Group based on the market capitalization and 1-year returns.
Top Tata Companies Share Based on Market Capitalization
An overview of the companies owned by Tata Group has been given below:
1. Tata Consultancy Services Ltd.
TCS was established in 1968, when Mr Fakir Chand Kohli, known as the Father of India’s IT industry, brought together a young team of IT professionals to provide punched card services to its sister company, TISCO (now Tata Steel). TCS also developed an Inter-Branch Reconciliation System for the Central Bank of India. To expand its operation in the IT sector, the company developed the electronic depository and trading system named SECOM for Swiss company SIS SegaInterSettle in 1975. Furthermore, TCS completed the task of automating the Johannesburg Stock Exchange. TCS has expanded its operations beyond India and has a significant presence in countries across America, Europe, Asia Pacific, the Middle East, and Africa, recognizing the growth opportunities in the global market. The company’s headquarters is in Mumbai.
2. Tata Motors Ltd.
Tata Motors was established in 1945 to manufacture locomotives. The company got the opportunity to enter the commercial vehicle sector by entering into a joint venture with Daimler-Benz in 1954 and setting up a manufacturing facility for Daimler lorries. Today, Tata Motors is a leading global automobile manufacturer. The company manufactures sports utility vehicles, trucks, buses, and defense vehicles. It has operations in India, the UK, South Korea, South Africa, China, Brazil, Austria, and Slovakia through a strong global network of subsidiaries, associate companies and Joint Ventures (JVs). Its subsidiaries include Jaguar Land Rover in the UK and Tata Daewoo in South Korea. The company’s headquarters is in Mumbai.
3. Titan Company Ltd.
Titan was established in 1984 as Titan Watches Limited. The company set up a manufacturing facility in Tamil Nadu to manufacture quartz analog electronic watches. The company entered the digital watch segment when it signed an MoU with Casio in 1986 to manufacture 2 million digital watches annually. Today, Titan has a significant presence in the watches, jewelry, eyewear, and perfume segment. It entered the jewelry segment by launching Tanishq and then launched Titan Eyeplus, an eyewear brand. The company’s headquarters is in Bangalore.
4. Trent Ltd.
The company’s history dates back to 1952 when it was originally established as Lakme Limited. The company was initially involved in the cosmetics business. However, in 1998, the company sold the cosmetic business to Hindustan Unilever and created Trent to venture into the fashion and lifestyle segment. The company acquired Littlewoods International (India) Limited to begin selling readymade garments and related merchandise. Today, Trent owns popular brands such as Westside, Zudio, Utsa, etc. The company’s headquarters is in Mumbai.
5. Tata Steel Ltd.
Mr Jamsetji Tata established Tata Iron and Steel Company Limited (TISCO) in 1907 and was later renamed Tata Steel Ltd. in 2005. The firm established its first facility and began producing steel in 1912. It also provided steel to the defense sector during the Second World War. Today, it is one of the few companies in the steel sector with fully integrated steel operations, ranging from mining to marketing finished products. Tata Steel acquired Singapore-based NatSteel Holdings in 2004 to broaden its global presence. The company has since completed several domestic and foreign acquisitions. The most recent occurred when it bought Bhushan Steel Limited in 2018. The company’s headquarters are in Mumbai.
Top Tata Stocks Based on 1-year Returns
Company
1-year returns
Trent Ltd.
245.08%
Tata Investment Corporation Ltd.
153.99%
Voltas Ltd.
104.85%
Tata Motors Ltd.
88.18%
Tata Power Company Ltd.
70.32%
(As of 26 August 2024)
Overview of Tata Stocks Based on 1-year Returns
An overview of the companies owned by Tata Group has been given below:
Tata Investment Corporation Ltd.
Tata Investment Corporation Ltd. was established in 1937 and was then known as The Investment Corporation of India Ltd. The company is a non-banking financial corporation that invests in debt, equity, etc. The company was incorporated to help small and medium-sized enterprises and entrepreneurs. Some major companies TICL invested in are SKF Bearings (India) Ltd., Ceat Tyres Ltd., etc. The company was listed on the stock market in 1959. The company generates its income through dividends and profit from the sale of investments. The company’s headquarters is in Mumbai.
Voltas Ltd.
Voltas was established in 1954 and is a key player in the home appliances industry. The company started as a collaboration between Tata Sons and Volkart Brothers. Today, the company offers a wide range of products, including air conditioners, air coolers, refrigerators, washing machines, etc. It is the largest air conditioning company in India by market share. Voltas partnered with Ardutch to launch appliances under the brand name “Voltas Beko.” The company has operations in over 100 countries and has undertaken many international projects, including the air conditioning of Burj Khalifa. The company’s headquarters is in Mumbai.
Tata Power Company Ltd.
The company was founded as Tata Hydro-Electric Power Supply Company in 1910. In 1915, the company established the Khopoli plant, which was India’s first clean energy station. The company uses conventional and renewable sources for energy generation and can produce 14,707 MW of energy annually, out of which 40% is from renewable sources. The company aims to achieve carbon neutrality by 2045. The company operates in India, Singapore, South Africa, Mauritius, etc. The company’s headquarters is in Mumbai.
Overviews of the remaining companies have been given above.
Key Performance Indicators
Company
Net Profit Margin (%)
ROCE (%)
Debt to Equity
P/E
P/B
Tata Consultancy Services Ltd.
19.13
63.51
0
34.78
18.02
Tata Motors Ltd.
7.10
19.39
1.16
10.74
4.28
Titan Company Ltd.
6.84
34.89
1.40
93.40
34.53
Trent Ltd.
10.94
27.40
0.12
145.14
60.89
Tata Steel Ltd.
-2.11
8.13
0.89
-47.02
2.11
Tata Investment Corporation Ltd.
83.60
1.07
0
84.04
1.04
Voltas Ltd.
3.09
10.83
0.12
124.40
9.77
Tata Power Company Ltd.
5.04
9.03
1.53
36.23
4.14
(All the above data is of the year ended March 2024)
Tata Group is a collection of India’s value-based corporations prioritizing core values over profits. It all began in 1868 when Jamsetji Tata established a trading firm, and today, companies of the Tata Group have a key presence in almost every crucial sector of India’s economy. Tata Trusts holds a 66% equity stake in Tata Sons, and the dividend income from the companies is utilized exclusively to support philanthropic activities. Tata Group employs more than 1 million people and plays a key role in developing the nation.
Frequently Asked Questions (FAQs)
Who is the Chairman Emeritus of Tata Sons?
Ratan Naval Tata is the Chairman Emeritus of Tata Sons.
Who is the chairman of Tata Group and Tata Sons?
Natarajan Chandrasekaran is the chairman of Tata Sons and Tata Group.
What is Titan’s main business?
Titan Company Ltd. generates revenues by offering watches, jewelry, eyewear, and perfumes to its customers.
What was Tata Steel previously known as?
Tata Steel was previously known as Tata Iron and Steel Company Limited (TISCO).
Who is the founder of the Tata Group?
Jamsetji Nusserwanji Tata is the founder of the Tata Group.
Selection Methodology and Important Disclaimer
The stocks included in this list are selected primarily on the basis of their market capitalisation, which represents the total market value of a company’s outstanding shares. The companies are arranged in descending order of market capitalisation, with larger companies appearing first, followed by relatively smaller companies. This methodology is intended to provide a structured approach for identifying companies based on their market size and overall presence within a sector.
However, market capitalisation should not be considered the sole factor while evaluating investment opportunities, as it does not guarantee future performance, profitability, or returns. Investors should also assess other important factors such as financial health, business fundamentals, management quality, valuation metrics, industry outlook, and market conditions before making investment decisions.
The information provided is for educational and informational purposes only and should not be construed as investment advice, recommendation, solicitation, or an offer to buy or sell any securities by Pocketful Fintech Capital Private Limited.
Chart patterns are important for traders using technical analysis to predict market movements and make decisions. Among various chart patterns, the ascending triangle is a reliable chart pattern for identifying possible bullish breakouts. Whether you are an experienced trader or just getting started, grasping the intricacies of the ascending triangle pattern can improve your trading strategy.
This blog post will discuss the pros and cons of the ascending triangle pattern and how to recognize this pattern. Let us discover how this pattern can assist us in navigating financial markets.
Ascending Triangle Chart Pattern – An Overview
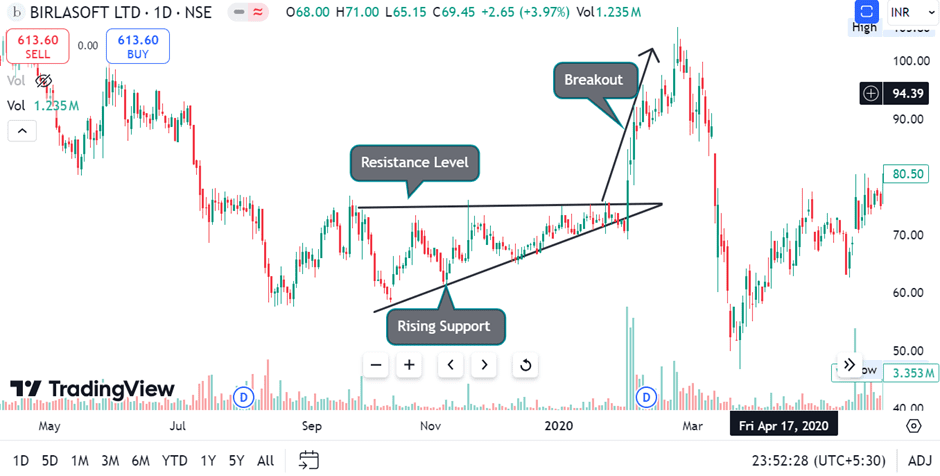
An ascending triangle chart pattern is a bullish chart pattern that occurs when a stock’s price is unable to break a resistance level while the asset price consistently makes higher lows. This creates a triangle shape on the chart. When the price goes above the resistance level, it signals a possible bullish trend. Traders often enter long positions at or near the breakout point.
Ascending triangle chart pattern has the following characteristics:
Resistance Level – The horizontal line represents the resistance level the price repeatedly fails to break above.
Rising Support – The upward-sloping line shows the rising support level formed by connecting the successive higher lows.
Convergence – The resistance and support lines converge as time passes, creating a narrowing triangle shape.
Breakout – The price eventually breaks above the resistance level, signaling a bullish trend reversal.
Additionally, it is important to remember that no technical analysis pattern is 100% accurate. False breakouts can happen, and market conditions can change unexpectedly. The Ascending Triangle chart pattern should be used in combination with other technical indicators and risk management strategies.
Interpretation
The triangle signifies a phase of consolidation or accumulation. During this phase, buyers gradually gain control, causing prices to rise. The triangle formation displays strong buying pressure, and the price usually breaks out above the resistance level.
When the price breaks above the resistance level, it signals a bullish trend. The narrowing triangle suggests there could be a breakout soon. Furthermore, sometimes, the price may break above the resistance level only to reverse direction, resulting in a false breakout.
A stop-loss order below is set on the recent low point of the support line in the ascending triangle. This helps to limit the losses if the trend reverses and the price moves downwards after a breakout. The risk per trade is determined by the difference between the entry price and the stop-loss level. Traders can change the stop-loss orders according to their risk tolerance and the market conditions.
A common way to set a target is to measure the triangle’s height and add it to the breakout point. Traders assume the price will move at least equal to the height of the triangle.
Example
The above image shows that the stock entered a consolidation phase in September 2019 and remained in this phase until February 2020, characterized by similar highs and higher lows. The asset price broke out at a price level of INR 75 and made a high of INR 105.80, which was slightly more than the height of the triangle.
Advantages of Ascending Triangle Chart Pattern
Ascending Triangle chart pattern has the following advantages:
Pre-defined entry and exit points – The pattern gives clear entry signals when the price breaks out above the resistance line. Stop-loss orders should be placed below the rising trendline to exit trades.
Reliable – The ascending triangle pattern is quite reliable, especially in strongly trending markets. Confirmation from other technical indicators can increase traders’ confidence.
Versatile Usage –The pattern can be used in different time frames, from intraday to weekly or monthly charts.
Predictability – Once the triangle forms, it can provide a sense of predictability, allowing traders to anticipate the possible price movements.
Limitations of Ascending Triangle Chart Pattern
Ascending Triangle chart pattern has the following limitations:
False Breakouts – One of the main drawbacks of the ascending triangle pattern is the potential false breakouts. Sometimes, the price briefly goes above the resistance level and then falls back, which can lead to losses.
Subjectivity – Identifying an ascending triangle pattern can be somewhat subjective. Different traders might draw trendlines differently or may have varying criteria for what constitutes a valid pattern, causing inconsistencies in its application.
Not Always Predictive – Although the pattern suggests that the trend will likely continue, it can’t be 100% accurate. Regardless of the pattern, market conditions, news events, or other factors can cause unexpected price movements.
The Ascending Triangle chart pattern is useful for technical analysts as it predicts bullish trends with a fair amount of accuracy. Although the ascending triangle pattern has its own merits, it is important to combine it with other technical indicators and risk management strategies. Unexpected changes in market conditions can lead to false breakouts and result in losses. Therefore, traders should constantly monitor and adapt to any developments or shifts in market dynamics. Individuals can also consult a financial advisor before trading.
Frequently Asked Questions (FAQs)
Can ascending triangle patterns be used in all market conditions?
Ascending triangle patterns are most effective when used in uptrend or sideways markets.
Are there other chart patterns similar to ascending triangles?
Chart patterns that feature a triangle pattern are descending triangles and symmetrical triangles.
How do you recognize an ascending triangle pattern?
Look for a horizontal resistance line and a series of higher lows forming an upward-sloping support line. If the two trend lines are converging, it can signal that an Ascending Triangle chart pattern is forming.
What does a breakout above the resistance level indicate?
A breakout above the resistance level indicates a bullish trend continuation.
Can an ascending triangle be a bearish pattern?
No, ascending triangles are generally considered bullish patterns.
The financial markets form a vibrant landscape where trends constantly evolve. Understanding these shifts is important for making well-informed trading decisions. One such pattern that is a must-have in a technical analyst’s arsenal is the ‘Double Top Reversal Pattern.’ This pattern provides valuable insights into upcoming market reversals, helping traders recognize possible selling opportunities.
In this blog, we will discuss the double-top reversal chart pattern with the help of an example. Moreover, we will discuss the advantages and disadvantages of this pattern.
What is a Double-top Reversal Pattern?
A double top is a chart pattern used in technical analysis to signal a bearish reversal in an asset’s price. It is formed when the price of an asset reaches a high price twice consecutively, with a moderate decline between the two highs.
This pattern is often understood as a sign that buyers are losing their momentum and sellers might take control of the market soon. Traders often look for confirmation signals, such as a break below the neckline, to further validate the bearish reversal.
Target Price: The price target is the same as the height from the neckline to the highest peak, projected downward from the neckline. An order to book profits can also be placed at the next support level.
Stop-Loss Price: A stop-loss order can also be placed above the highest peak or just above the neckline to limit potential losses if the price moves higher.
Characteristics of Double Top Reversal Pattern
The double-top reversal pattern has the following characteristics:
M-Shaped Pattern – The price chart forms an ‘M’ shape, with two different peaks at approximately the same price level.
Moderate Decline – When the price reaches a high, retraces, and rallies back to a similar high after a minor decline.
Confirmation – The pattern is confirmed when the price falls below the support level (neckline). Traders also use volume data to confirm pattern formation.
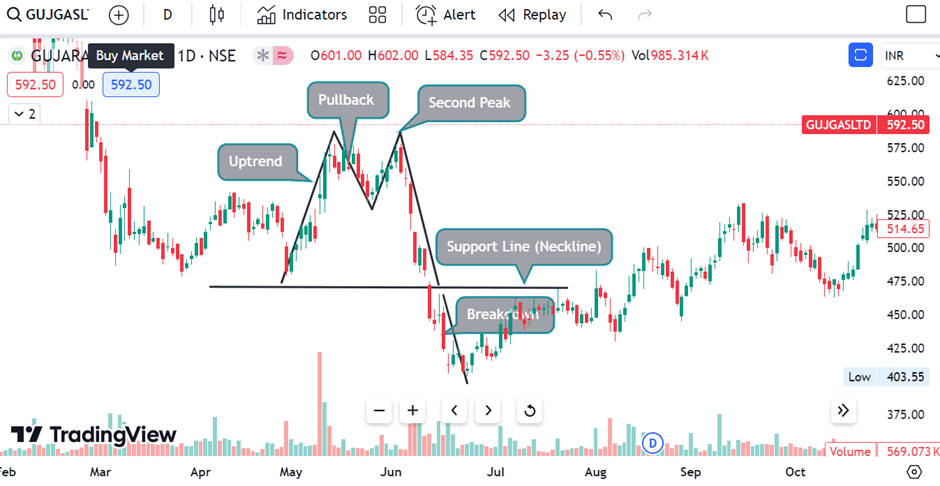
The example below shows the daily chart of Gujarat Gas Private Limited showing the Double Top Chart Pattern. The pattern shows the following phases:
Upward Trend – The stock price experiences a strong upward trend, reaching a peak (the first top).
Pullback – The price retraces slightly, indicating buyers are losing control.
Second Peak – The price rallies again, almost reaching the same level as the first peak. (the second top).
SupportLine or Neckline– A horizontal line is drawn between the two lowest points between the peaks, forming the neckline.
Breakdown – The price breaks below the neckline, confirming the double top pattern.
Price Target – The height of the pattern, i.e., the distance between the support line and the peak, is projected downwards from the support to estimate the price target.
This is a simplified example, and real-world analysis considers factors like volume, technical indicators, and fundamental analysis. Not all double-top patterns lead to profitable trades, and individuals must be careful before making trading decisions.
Advantages of Double Top Reversal Pattern
A double-top reversal pattern has the following advantages:
A clear sign of reversal – The pattern shows a possible change in the direction of the price. Traders can use this to predict a price decline.
Definite Entry and Exit Points – The support line provides a clear entry point for short positions once it is broken. An individual can exit the trade if the price reaches the target price or moves upwards after breaking the support level.
Risk Management – Patterns are often useful for establishing stop loss and target levels. Place a stop-loss above the highest peak and determine the profit target by projecting the pattern’s height downward from the support line.
Objective Analysis – The double top pattern depends on price action and does not need subjective analysis, making it a comparatively objective tool.
Limitations of Double Top Reversal Pattern
A double-top reversal pattern has the following disadvantages:
False Signals – Like any technical indicator, the double top reversal pattern can give incorrect signals. The price could briefly touch two high points before continuing its upward movement, causing traders who act too soon to lose money.
Timing Concerns – Finding the best time to enter and exit a trade can be difficult. If the trader enters or exits too early, he might miss good opportunities or lose money.
Confirmation Needed – Relying solely on the double top pattern without confirmation from other technical indicators or fundamental analysis can increase the risk of false signals and wrong entries.
Limited Usefulness in Strong Uptrends – In a robust uptrend, the double-top pattern might be less reliable as the overall market momentum can override the pattern’s bearish implications.
The Double Top Reversal pattern is a very useful pattern for identifying reversals in the financial market. Once you understand how it is formed and other trading concepts that work with this pattern, you’ll be well-placed to spot a bearish shot!
The Double Top Reversal pattern is a decent chart pattern with good accuracy but should be used with a stop-loss order to limit losses. An individual must also keep realistic targets to book profits. Nevertheless, always be sure to do plenty of research and perhaps consult with a financial advisor before you make any investment decisions.
Frequently Asked Questions (FAQs)
How is double top confirmed?
A double top is confirmed when the price breaks below the support level between the two peaks.
What does the pattern indicate?
A double top shows a loss of buying momentum and a possible increase in selling pressure.
How can I trade the double-top pattern?
Traders often short-sell after the price breaks below the support line. A stop-loss can be placed above the highest peak.
Are double-top patterns always accurate?
No, like any other technical pattern, a double-top reversal pattern can produce false signals. It is important to use it in combination with other indicators like volume.
Can double tops form in any timeframe?
Yes, the double top reversal pattern can form in any timeframe, from short-term to long-term timeframe.
Central public sector enterprises are crucial to the development of the nation’s economy as they operate in various sectors of strategic importance. The main aim of these companies is to achieve a balance between public welfare and industrial progress. But do you know some companies are granted a special status known as the “Maharatna”?
In this blog, we will discuss the significance of “Maharatna” status, the criteria for earning a Maharatna status, and an overview of the top Maharatna companies.
What is a Maharatna Company?
Central public sector enterprises (CPSEs) are those companies in which the direct holding of the Government of India or other CPSEs is 51% or more. Some CPSEs are of such strategic importance that the government of India started granting them Maharatna status, which gives these companies more autonomy and authority than the other CPSEs. These companies have more freedom to select projects for investment and can invest up to 15% of their net worth in any project without the government’s permission. The meaning of Maharatna is a ‘great jewel,’ and, indeed, these companies are shining jewels among the Indian CPSEs.
A company must satisfy the following criteria to become a Maharatna company:
The company should have a Navratna status.
The company should be listed on the Indian stock exchange with minimum prescribed public shareholding under the SEBI regulations.
An average annual turnover of more than INR 25,000 crores during the last three years.
An average annual net worth of more than INR 15,000 crores during the last three years.
An average annual net profit after tax of more than INR 5,000 crores during the last three years.
The company should have a significant global presence and international operations.
There are 13 Maharatna companies in India, and in this blog, we will discuss the top 7 Maharatna companies based on market capitalization.
Top Maharatna Companies in India Based on Market Capitalization
A brief overview of Maharatna companies is given below:
1. Oil & Natural Gas Corporation Ltd.
Oil & Natural Gas Corporation Ltd. (ONGC) was established in 1956 and is the largest government-owned oil and gas explorer. It accounts for 70% of the domestic crude oil production and 84% of the domestic natural gas production. The company operates in 26 sedimentary basins and a network of pipelines that runs 11,000 kilometers. It has a subsidiary named ONGC Videsh, which has projects in 15 countries. In 2010, ONGC was granted the Maharatna status by the Government of India. The company’s headquarters is in New Delhi.
2. Coal India Ltd.
Coal India is the largest government-owned coal producer in the world. Coal India was established in 1975 and is under the Ministry of Coal, The Government of India. The company accounts for 82% of the total domestic coal production. CIL is a major player in the nation’s energy sector. It operates 313 mines and produced 773.65 million tonnes of coal during 2023-24. It has seven wholly owned subsidiaries in India and a foreign subsidiary named Coal India Africana Limitada (CIAL) in Mozambique. The company received the status of a Maharatna company in 2011. The company’s headquarters is in Kolkata.
3. Power Grid Corporation of India Ltd.
Power Grid Corporation of India is under the Ministry of Power, Government of India. The company was established in 1989 and is responsible for the transmission of bulk power across the country. The company was formerly known as the “National Power Transmission Corporation Ltd.” and is responsible for operating and maintaining 90% of the country’s power transmission systems. The company took over assets from NTPC, NHPC, NEEPCO, NLC, and others to start operations in 1993. The company was granted Mini-Ratna status in 1998, Navratna status in 2008, and Maharatna status in 2019. The company’s headquarters is in Gurugram.
4. Indian Oil Corporation Ltd.
The business was established in 1959 as Indian Oil Company Ltd. Indian Oil Corporation Ltd. was established due to a merger between Indian Oil Company Limited and Indian Refineries Limited in 1964. They established refineries in Gujarat, Barauni, Guwahati, etc., to grow their business and refine 31.44% of the total oil refined in India. Indian Oil’s LPG brand, “Indane,” is crucial in supplying LPG cylinders to more than 150 million households. The company has been aware of its carbon footprint and has launched a number of initiatives such as hydrogen Mobility, Electric Mobility, Solar Cooktop, etc. Its main office is located in New Delhi.
5. Power Finance Corporation Ltd.
The Power Finance Corporation Limited was established in 1986 and is under the administrative control of the Ministry of Power. The company gives financial support not only to projects related to power generation but also to transmission and distribution projects. The company is of strategic importance in India’s power infrastructure development. The company has launched the Green Bond Framework to develop financial instruments to finance green projects. In 2021, the company received the Maharatna status. The company’s headquarters is in New Delhi.
6. GAIL (India) Ltd.
Gas Authority of India Limited, or GAIL, was established in 1984 as a central public sector undertaking under the Ministry of Petroleum and Natural Gas. The company’s first project was the construction, operation, and maintenance of the Hazira-Vijaipur-Jagdishpur (HVJ) pipeline. It is primarily involved in the production and distribution of natural gas and operates 13,722 km of natural gas pipeline network. The company also has operations in the production of solar and wind power. The company was awarded the Maharatna status in 2013. Its headquarters is located in New Delhi.
7. Bharat Petroleum Corporation Limited
Under the Ministry of Petroleum and Natural Gas, Bharat Petroleum Corporation Limited (BPCL), a prominent government-owned integrated oil and gas firm, was established on November 3, 1952. BPCL, which has its headquarters in Mumbai, Maharashtra, is involved in upstream exploration and production as well as the refining, marketing, and distribution of petroleum products. With a combined refining capacity of over 35.3 million metric tonnes per annum (MMTPA), the business runs significant refineries in Mumbai, Kochi, and Bina. With more than 23,600 fuel stations spread throughout India, it offers a wide marketing network to cater to both commercial and retail clients. In 2017, the Indian government recognised BPCL’s strategic significance in the country’s energy industry and its good financial performance by awarding it Maharatna status.
8. Oil India Limited
Oil India Limited (OIL) was established in 1959 and is the second-largest national oil and gas company in India after ONGC. It operates under the Ministry of Petroleum and Natural Gas and plays a vital role in exploration, development, and production of crude oil, natural gas, and LPG. The company also undertakes pipeline transportation, renewable energy projects, and consultancy services in India and abroad. OIL operates extensive exploration and production blocks across Assam, Arunachal Pradesh, Rajasthan, and offshore areas, along with international assets in countries like Russia, Mozambique, and the USA. It owns one of Asia’s longest crude oil pipelines, stretching from Assam to Barauni. Headquartered in Duliajan, Assam, the company was granted Maharatna status in August 2023 by the Government of India, recognizing its outstanding performance and strategic importance in the nation’s energy security.
9. Hindustan Aeronautics Limited
HAL, incorporated on 23 December 1940, is a leading aerospace and defense company under the Ministry of Defence, Government of India. Based in Bengaluru, Karnataka, HAL designs, develops, manufactures, repairs, overhauls, and upgrades aircraft, helicopters, aero-engines, avionics, and related systems. The company is important to India’s defense manufacturing sector and has received Maharatna status, which gives it more financial and operational freedom. HAL has several production divisions and R&D centers across India, supporting homegrown defense programs like the Tejas Light Combat Aircraft, Dhruv helicopter, and Light Combat Helicopter (LCH).
10. Bharat Heavy Electricals Limited
After independence in 1947, India under Prime Minister Jawaharlal Nehru focused on creating a strong industrial base and power infrastructure. To achieve this, Heavy Electricals (India) Limited (HE(I)L) was established in 1956 at Bhopal in collaboration with AEI, UK — marking the birth of India’s heavy electrical equipment industry. Headquartered in Bhopal, the company produced turbines, generators, transformers, and switchgear, supporting major power and industrial projects across the nation and laying the foundation for future plants and growth. Bharat Heavy Electricals Limited (BHEL) was granted Maharatna status by the Government of India in February 2013, recognizing its exceptional performance.
11. Hindustan Petroleum Corporation Limited
HPCL was established in 1974 and is one of India’s leading government-owned oil refining and marketing companies. It operates under the Ministry of Petroleum and Natural Gas and owns two major refineries – in Mumbai and Visakhapatnam – with a combined capacity of over 17 million metric tonnes per annum. HPCL markets a wide range of petroleum products through an extensive retail network across the country. Headquartered in Mumbai, the company was granted Maharatna status in October 2019 by the Government of India.
12. Steel Authority Of India Limited
Steel Authority of India Limited (SAIL) was established in 1973 and is one of India’s largest state-owned steel-making companies. It operates under the Ministry of Steel and manages five integrated steel plants located at Bhilai, Rourkela, Durgapur, Bokaro, and Burnpur, along with three special steel plants. SAIL produces a wide range of steel products used in construction, railways, defense, and infrastructure. Headquartered in New Delhi, the company was granted Maharatna status by the Government of India in May 2010 for its outstanding contribution to the nation’s industrial growth.
13. Rural Electrification Corporation Limited
REC Limited (formerly Rural Electrification Corporation Limited) was established in 1969 and is a leading public sector enterprise under the Ministry of Power, Government of India. The company plays a crucial role in financing and promoting power sector projects across generation, transmission, distribution, and renewable energy. REC provides financial assistance to state electricity boards, power utilities, and private developers. Headquartered in Gurugram, Haryana, REC supports India’s goal of universal electricity access. It was granted Maharatna status by the Government of India in September 2022, recognizing its strong performance and strategic importance.
Performance of the Maharatna Companies
Company
1-Year Returns
3-Year Returns
5-Year Returns
Oil & Natural Gas Corporation Ltd.
-5.25%
91.99%
269.51%
NTPC Ltd.
-17.55%
103.41%
293.74%
Coal India Ltd.
-17.43%
63.85%
234.79%
Power Grid Corporation of India Ltd.
-9.60%
75.76%
201.43%
Indian Oil Corporation Ltd.
-1.89%
120.97%
188.23%
Power Finance Corporation Ltd.
-13.13%
363.06%
446.67%
GAIL (India) Ltd.
-14.40%
109.39%
211.03%
Bharat Petroleum Corporation Limited
2.80%
119.74%
87.99%
Hindustan Aeronautics Limited
14.70%
298.70%
1241.08%
Bharat Heavy Electricals Limited
8.76%
223.51%
695.41%
Hindustan Petroleum Corporation Limited
21.16%
222.79%
291.70%
Steel Authority Of India Limited
16.57%
57.42%
281.09%
Rural Electrification Corporation Limited
-27.33%
282.54%
381.60%
Oil India Limited
-13.11%
237.82%
617.54%
(As of 27 October 2025)
Key Performance Indicators
Company
Net Profit Margin (in %)
ROCE (in %)
Debt to Equity Ratio
P/E Ratio
P/B Ratio
Oil & Natural Gas Corporation Ltd.
6.09
11.15
0.45
8.55
0.90
NTPC Ltd.
11.55
9.40
1.34
17.58
1.88
Coal India Ltd.
24.30
24.24
0.09
6.94
2.48
Power Grid Corporation of India Ltd.
34.13
12.32
1.41
17.40
2.96
Indian Oil Corporation Ltd.
1.58
8.22
0.76
12.94
0.94
Power Finance Corporation Ltd.
28.65
65.86
8.25
5.95
1.16
GAIL (India) Ltd.
7.72
11.52
0.19
9.67
1.41
Bharat Petroleum Corporation Limited
2.72
16.30
0.63
8.92
1.46
Hindustan Aeronautics Limited
26.86
17.41
0.00
33.40
7.98
Bharat Heavy Electricals Limited
21.83
11.83
0.60
9.60
1.26
Hindustan Petroleum Corporation Limited
1.57
12.67
1.30
11.38
1.50
Steel Authority Of India Limited
1.83
6.50
0.51
20.07
0.81
Rural Electrification Corporation Limited
28.18
68.85
6.38
7.13
1.45
Oil India Limited
21.83
11.83
0.60
9.60
1.26
(All the above data is for the year ended March 2025)
Maharatna companies in India are vital to economic growth and provide employment to a huge workforce. These companies operate in various sectors ranging from energy, infrastructure, finance, etc. These companies have earned the Maharatna status by meeting all the criteria related to consistent profitability, annual turnover, annual net worth, etc. Meeting these parameters makes these companies a good investment opportunity for an investor. However, it is advised to consult a financial advisor before investing.
S.NO.
Check Out These Interesting Posts You Might Enjoy!
There are a total of 13 Maharatna companies in India. The list includes ONGC, NTPC, Coal India Ltd., Power Grid Corporation of India Ltd., IOCL, etc.
What are the benefits of being a Maharatna company?
A Maharatna company has more autonomy and authority in selecting projects for investment and can invest up to 15% of its net worth without the government’s approval.
Should a company be listed on the stock exchange to become a Maharatna company?
Yes, a company must be listed on the Indian stock exchange and must have a minimum prescribed public shareholding under the SEBI regulations.
Which company was the first to earn a Maharatna status?
Oil and Natural Gas Corporation Ltd. (ONGC) was the first company to get a Maharatna status on 24 December 2010.
What is a central public sector enterprise (CPSE)?
Central public sector enterprises (CPSEs) are those companies in which the direct holding of the Government of India or other CPSEs is 51% or more.
Interested in investing in the dairy sector of the fastest-growing economy in 2024? From being a milk-deficit nation to an exporter of milk products, the Indian dairy industry has grown remarkably. The Indian dairy industry presents a lot of investment opportunities for investors, especially in companies associated with best dairy food brands in India that have strong market presence and potential for growth.
In this blog, we will discuss dairy stocks based on market capitalization, the benefits of investing in them, factors to consider before investing, and their recent performance.
Overview Of the Dairy Industry in India
India’s dairy industry contributes over 4% to the GDP and is a major sector of the Indian economy. The sector was worth about $108 billion in 2022 and is estimated to reach a valuation of $170 billion by 2028 at a CAGR of 8.62%.
The industry has faced various challenges, including the absence of an efficient supply chain, fluctuating milk prices, geographical constraints, etc. However, technology plays a key role in optimizing cold storage and supply chains. Due to a rise in disposable incomes, there is a high demand for value-added dairy products in urban areas. There has been a growing emphasis on sustainable and organic dairy farming to reduce the negative impact on the environment.
Best Dairy Stocks in India Based on Market Capitalization – An Overview
A brief overview of the best dairy stocks in India is given below:
1. Hatsun Agro Product Ltd.
Hatsun Agro Product Ltd. was established in 1970 and is India’s largest private dairy company. The company has the capacity to process 2.5 million liters of milk per day. The company’s product range includes Arokya milk, Arun ice cream, Hatsun curd, etc. It has 20 processing plants across India and exports its products to 42 countries worldwide. The company’s headquarters is in Chennai.
2. Dodla Dairy Ltd.
Dodla Dairy Ltd. is a renowned dairy company that was incorporated in 1995. The company adopts an integrated business model, focusing on the procuring, processing, and distributing dairy products. Dodla has 150 chilling centers and 14 processing plants, which can process 2.2 million liters of milk daily. The products include fresh milk, curd, ghee, butter, and paneer. The company’s headquarters is in Hyderabad.
It is one of the leading companies in the Indian dairy sector, founded by N. Chandrababu Naidu in 1992. The company follows a farm-to-home business model wherein it takes care of the quality of milk, from the procurement of milk to its delivery to households. Heritage has a processing capacity of 2.57 million liters of milk daily and offers a product line that includes milk, curd, ghee, and buttermilk. The company has a large southern Indian footprint and reaches more than 1.5 million households through 1,25,000 retail outlets.
4. Vadilal Industries Ltd.
Vadilal Industries Ltd is one of the oldest and most renowned ice cream manufacturing companies in India. It was established in 1907. The company offers a wide product range, which includes ice creams, frozen desserts, and processed foods. Its ice cream division caters to millions of customers across India through a network of over 50,000 retailers and 1,500 distributors with over 150 flavors. Further on, Vadilal exports processed foods to over 45 countries. The company’s headquarters is located in Ahmedabad.
5. Parag Milk Foods Ltd.
Parag Milk Foods Ltd. was established in 1992. They can process approximately 1,500,000 liters of milk every day with the help of their modern machinery and produce a number of products such as milk, cheese, ghee, and yogurt. Parag is known for its solid distribution network, which sells its products in different cities in India and also exports milk and other products to other countries worldwide. In 2017, the company started selling whey protein. It is also the largest producer of cow ghee under the brand name “Govardhan.” The company’s headquarters is in Mumbai.
6. Vadilal Enterprises Ltd.
The company was incorporated in 1985 and mainly focuses on the distribution of ice creams, frozen desserts, and processed foods across India. Taking care that millions of consumers get to choose from, the group’s wide range of over 150 ice cream flavors are more than 1,500 distributors and 50,000 retailers networked with Vadilal Enterprises. It also plays a significant role in Vadilal’s export operations by covering markets in more than 45 countries. The company’s headquarters is located in Ahmedabad.
7. Milkfood Ltd.
Milkfoods Ltd. was incorporated in 1973. It is a vertically integrated business with processes ranging from milk procurement to finished products. The company processes more than 1 million liters of milk daily. Its product range consists of milk powders, ghee, butter, and cheese. Through a large distribution network, the company has been selling its products across the nation and exporting them to foreign markets, too. The company’s headquarters is located in Patiala.
8. Umang Dairies Ltd.
Umang Dairies Ltd. was established in 1994 and is part of the JK Organisation. It operates a highly robust farm-to-table business model focusing on milk processing and producing value-added dairy products. The company processes more than 6 lakh liters of milk per day. Its product line includes milk powder, ghee, etc. The company has 800 distributors and more than 1,50,000 retailers across India. The company’s head office is located in New Delhi.
(All the above data is of the year ended March 2024)
Benefits of Investing in the Dairy Industry
Investing in dairy stocks can have several advantages, some of which are listed below:
Steady Demand: Dairy products have a steady demand, which is not influenced even during economic downturns.
Growth Potential: As urbanization increases, the dairy sector is expected to grow significantly, particularly due to value-added products.
Government Support: Initiatives such as the National Dairy Plan are positive for attracting investment in the sector.
Diversification: Investors can buy dairy stocks to reduce the portfolio risk.
Factors to consider before investing in the Dairy industry
There are various factors one should take into account before investing in dairy stocks:
Market Demand: Assess the demand for dairy products, especially processed and value-added products like cheese and yogurt.
Supply Chain Efficiency: Evaluate the company’s distribution network and storage facilities.
Sustainability Practices: Investors need to identify companies with sustainable practices.
The Future of Dairy Industry
The future of the Indian dairy industry looks bright due to the adoption of the latest technologies to optimize supply chains and storage facilities. These improvements are helping companies reach new markets with better-quality products. One has to look at the growth trends, such as the rise in the demand for value-added products like organic and fortified dairy.
However, certain factors, such as fluctuating milk prices, sustainability issues, and regulatory aspects, can affect the performance of dairy stocks. The Indian dairy sector is set for expansion, and investors must consider it for long-term investments.
In a nutshell, investing in dairy stocks in India can be profitable in the long run as the industry is expected to grow substantially due to a rise in domestic consumption and government support. Major players in the industry are in a good position to capitalize on the growing demand for value-added dairy products. New technologies are being used to improve storage facilities and supply chains to help companies reach new consumers. However, an individual must consult a financial advisor before investing.
S.NO.
Check Out These Interesting Posts You Might Enjoy!
Which companies operate in the Indian dairy sector?
Based on market capitalization, Hatsun Agro Product, Dodla Dairy, Heritage Foods Ltd., etc., are a few major companies operating in the dairy sector.
How can technological advancements in the dairy industry affect its stocks?
Technological innovations in processing and supply chain management enhance the quality of products, thus improving the company’s financial performance and stock returns.
How critical is the sustainability factor while investing in dairy stocks?
Sustainability has become an important factor as consumers and regulators are forcing companies to adopt sustainable practices. Firms that adopt sustainable practices build a reputation over time and are preferred by investors and customers.
Are there any risks associated with investing in dairy stocks?
Yes, the risks associated with dairy stocks are fluctuating milk prices, changes in regulations, and supply chain problems.
What role does the government policies play in the dairy sector?
Government initiatives, such as subsidies and the National Dairy Plan, support industry growth and could be helpful in enhancing the performance of dairy stocks.
Selection Methodology and Important Disclaimer
The stocks included in this list are selected primarily on the basis of their market capitalisation, which represents the total market value of a company’s outstanding shares. The companies are arranged in descending order of market capitalisation, with larger companies appearing first, followed by relatively smaller companies. This methodology is intended to provide a structured approach for identifying companies based on their market size and overall presence within a sector.
However, market capitalisation should not be considered the sole factor while evaluating investment opportunities, as it does not guarantee future performance, profitability, or returns. Investors should also assess other important factors such as financial health, business fundamentals, management quality, valuation metrics, industry outlook, and market conditions before making investment decisions.
The information provided is for educational and informational purposes only and should not be construed as investment advice, recommendation, solicitation, or an offer to buy or sell any securities by Pocketful Fintech Capital Private Limited.
The first things you notice when traveling to a new city or nation are its highways, railway stations, high-rise structures, etc. It takes a lot of expertise and innovative thinking to make these infrastructure marvels. There are some companies in India that undertake these complex tasks and complete them with remarkable efficiency. The nation’s infrastructure sector paints a picture of its economic expansion.
In today’s blog, we’ll give you an overview of the infrastructure sector and the top 5 infrastructure stocks based on market capitalization and 1-year returns.
Overview of Infrastructure Industry
A very robust infrastructure is necessary for any nation to develop. A strong network of roads, railroads, flyovers, buildings, etc., is required. Because it generates a large number of job opportunities and supports the nation’s economic growth, the Indian infrastructure industry is regarded as one of the country’s most dynamic economic sectors.
The Government of India realizes the importance of the infrastructure sector and its role in becoming a developed nation. The government has set aside $1.3 trillion for the infrastructure sector and launched “Gati Shakti” to bring reforms to the infrastructure sector. The central government has announced a capital expenditure allocation of $133.9 billion for the infrastructure sector in Budget 2024. Additionally, the National Infrastructure Pipeline (NIP) has a total project count of 9,142. The focus on developing smart cities and attracting investments from countries like Saudi Arabia makes this sector attractive to investors.
Top Infrastructure Stocks Based on Market Capitalization
The top Infrastructure stocks in 2026 are:
S.No.
Infrastructure stocks
1
Larsen & Toubro Ltd.
2
Rail Vikas Nigam Ltd.
3
GMR Airport Infrastructure Ltd.
4
IRB Infrastructure Developers Ltd.
5
NBCC (India) Ltd.
The infrastructure stocks have been listed in descending order based on their market capitalization in the table below:
Best Infrastructure Stocks in India 2026 Based on Market Capitalization – An Overview
A brief overview of the best infrastructure stocks in India is given below:
1. Larsen & Toubro Ltd.
Two Danish engineers, Henning Holck-Larsen and Soren Kristian Toubro, established the business in Mumbai in 1938. However, the business was legally incorporated in 1946 as Engineering Construction & Contracts Ltd (ECC). In the Second World War, the company started repairing and fabricating ships. The company is now working on building infrastructure, including roads, bridges, buildings, dams, etc. The company has diversified into financial services to expand its operations. The organization’s headquarters is in Mumbai.
Know the Returns:
1Y Return (%)
3Y Return (%)
5Y Return (%)
-4.06%
93.72%
310.60%
(As of 22 September 2025)
2. Rail Vikas Nigam Ltd.
The company operates under the Ministry of Railways and was established in 2003. It was established to implement the National Rail Vikas Yojana (NRVY), which was launched to develop railway infrastructure in India. Its numerous initiatives include modernizing train stations, electrifying train tracks, and extending new rail lines into isolated places. To obtain funds for growth, the company was listed on the Indian Stock Exchange in 2019. Its main office is located in New Delhi.
Know the Returns:
1Y Return (%)
3Y Return (%)
5Y Return (%)
33.96%
941.74%
1,674.81%
(As of 22 September 2025)
3. GMR Airports Ltd
Grandhi Mallikarjuna Rao started the business in 1978, and at first, it operated as a modest Andhra Pradesh jute plant. The company ventured into the infrastructure industry later in 1990. The company was given the go-ahead to build Hyderabad’s Rajiv Gandhi International Airport and Delhi’s Indira Gandhi International Airport in 2000, and it became a well-known name in the airport development industry due to these two projects. In 2006, the company was listed on the Indian Stock Exchange. Its main office is located in New Delhi.
Know the Returns:
1Y Return (%)
3Y Return (%)
5Y Return (%)
-4.23%
138.22%
295.65%
(As of 22 September 2025)
4. IRB Infrastructure Developers Ltd.
Virendra D. Mhaiskar launched the business in 1998. The company started as a minor road-building company before rising to prominence in the infrastructure industry. In order to obtain money for its ongoing expansion, the company was listed on the Indian Stock Exchange in 2008. The company was the first to operate a build-operate-transfer road project in India. Mumbai-Pune Expressway and Ahmedabad-Vadodara Expressway are some of its notable projects. The company’s headquarters is in Mumbai.
Know the Returns:
1Y Return (%)
3Y Return (%)
5Y Return (%)
32.19%
96.92%
274.83%
(As of 22 September 2025)
5. NBCC (India) Ltd.
The business was previously known as National Buildings Construction Corporation when it was established in 1960. The company is responsible for the redevelopment of government properties, EPC projects, real estate development, etc. Subsequently, the company’s operations extended to Yemen, Iraq, Libya, Nepal, etc. The business started developing government and residential real estate in 2000. In 2012, the company went public, and the Government of India granted it Navratna status in 2014. Its main office is located in New Delhi.
Best Infrastructure Stocks in India Based on 1-Year Return – An Overview
The best infrastructure stocks according to 1-Year return are given below, along with a brief overview:
1. GPT Infraprojects Limited
The business was established in 1980 as a GPT Group subsidiary. Later in 1990, the business began manufacturing railway concrete sleepers to expand its operations into the railway industry. In 2010, the company began accepting international projects and has operations in India, South Africa, Namibia, and Ghana. The company has expertise in developing bridges, railway tracks, roads, and highways. The company’s main office is in Kolkata, West Bengal.
1Y Return (%)
3Y Return (%)
5Y Return (%)
-18.55%
287.44%
1,730.73%
(As of 22 September 2025)
2. GMR Airports Ltd and Urban Infra Limited
The business was established as a division of the GMR Airports Ltd, which was founded in 1978 and is regarded as one of India’s top infrastructure corporations. The corporation has completed infrastructure projects in India and abroad, including highways, industrial parks, and smart cities. The company developed GMR Krishnagiri SIR (Special Investment Region) in an area of 850 hectares. Its head office is in New Delhi.
1Y Return (%)
3Y Return (%)
5Y Return (%)
-12.57%
317.94%
157.73%
(As of 22 September 2025)
3. Supreme Infrastructure Limited
Shri Bhawani Shakar Sharma established the business in 1983 as Supreme Asphalts Private Ltd., and its activities included minor civil building projects. In 2002, the company’s name was changed to Supreme Infrastructure India Ltd. Later, the business began to receive contracts from the government to build bridges, flyovers, and other infrastructure. In 2007, the company was listed on the Indian Stock Exchange. The organization’s headquarters is in Mumbai.
Overviews of the remaining companies have been given above.
1Y Return (%)
3Y Return (%)
5Y Return (%)
18.48%
320.34%
320.34%
(As of 22 September 2025)
Key Performance Indicators (KPIs)
Company
ROE (%)
ROCE (%)
Debt to Equity (x)
P/E
P/B
Larsen & Toubro Ltd.
15.12
14.70
1.32
37.96
5.87
Rail Vikas Nigam Ltd.
18
16.74
0.68
81.66
13.59
GMR Airports Ltd
0
4.74
-16.30
-148.97
-22.76
IRB Infrastructure Developers Ltd.
4.40
7.63
1.36
64.74
2.88
NBCC (India) Ltd.
18.04
27.57
0
76.49
14.79
GPT Infraprojects Ltd.
19.11
30.96
0.62
37.25
7.31
GMR Airports Ltd and Urban Infra Ltd.
0
11.02
-4.75
6.18
-0.88
Supreme Infrastructure India Ltd.
0
0.91
-0.87
-0.18
-0.01
(All the above data is for the year ended March 2024, except Supreme Infrastructure India Ltd.)
Benefits of Investing in Infrastructure Stocks
There are various benefits of investing in infrastructure stocks, a few of which are mentioned below-
Diversification – You can lower the risk in your portfolio by investing in infrastructure stocks.
Government Spending – The government of India supports the infrastructure sector through several incentive programs to speed up the country’s economic progress.
Periodic Cash flows – Operating infrastructure assets have a long usable life, thereby providing predictable long-term cash flows to the inventors.
Factors to be Considered before Investing in Infrastructure Stocks
Before making any investment in the infrastructure stocks, there are various factors to be taken into consideration-
Political Risks – Infrastructure development depends on a nation’s political stability; any instability in the government will result in project cancellations, which will have an immediate negative impact on the company’s earnings.
Government Policies – The infrastructure industry depends on government support and regulatory policies established by the Indian government, such as tax incentives. Any modifications to these policies will have a detrimental effect on the company’s profitability.
Company’s Financial – Before investing in any infrastructure stock, one should carefully review a firm’s financial reports, including the balance sheet, income statement, and cash flow statements.
Future of Infrastructure Sector in India
Since the infrastructure sector is the foundation of India’s economic growth, the government has launched multiple initiatives to support the sector. In addition, the government is providing incentives for this industry to promote urbanization. New investment opportunities in this sector are created by the growing participation of the private sector alongside government firms. By 2025, the Indian infrastructure sector is projected to be valued at over $1.4 trillion. All these factors make the infrastructure sector in India a sector to watch out for.
To summarize, the government’s initiatives and emphasis on infrastructure development indicate a positive outlook for the infrastructure industry in India. This industry has good growth potential in the long run and must be considered by long-term investors. But before making any decisions about your investments, you should speak with an investment advisor and thoroughly review the performance of the companies in this industry.
S.NO.
Check Out These Interesting Posts You Might Enjoy!
Larsen & Toubro, Rail Vikas Nigam Ltd., GMR Airports Ltd, IRB Infrastructure Limited, and NBCC (India) Limited are India’s top 5 infrastructure companies based on market capitalization.
How can I identify the best infrastructure stocks to invest in?
Investors can analyze the company’s cash flows, order books, financial statements, and other documents to identify the best infrastructure stocks in India.
Is it worth investing in the infrastructure sector?
Yes, one can invest in the Indian infrastructure sector given its growth potential and government incentives supporting it, but only after analyzing their financial statements and taking their risk tolerance into account.
Which is the largest infrastructure company in India?
Larsen & Toubro Limited is the biggest infrastructure stock in India based on market capitalization.
What are the major risks associated with investing in Infrastructure Sector Companies?
The main risks associated with the infrastructure sector are the company’s debt levels and project delays because these businesses make huge capital expenditures and may have huge debts.
Selection Methodology and Important Disclaimer
The stocks included in this list are selected primarily on the basis of their market capitalisation, which represents the total market value of a company’s outstanding shares. The companies are arranged in descending order of market capitalisation, with larger companies appearing first, followed by relatively smaller companies. This methodology is intended to provide a structured approach for identifying companies based on their market size and overall presence within a sector.
However, market capitalisation should not be considered the sole factor while evaluating investment opportunities, as it does not guarantee future performance, profitability, or returns. Investors should also assess other important factors such as financial health, business fundamentals, management quality, valuation metrics, industry outlook, and market conditions before making investment decisions.
The information provided is for educational and informational purposes only and should not be construed as investment advice, recommendation, solicitation, or an offer to buy or sell any securities by Pocketful Fintech Capital Private Limited.
The Indian automobile sector, one of the main pillars of the Indian economy, plays a pivotal role in shaping the economic landscape. From being one of the world’s largest markets for two-wheelers to witnessing rapid advancements in electric vehicles, the industry is a vibrant mix of legacy manufacturers and cutting-edge innovation. The sector continues to be a key driver of growth, employment, and technological progress in India.
In this blog, let’s look at the best automobile stocks in India and the reasons to invest in them.
Overview of the Indian Automobile Sector
The Indian automobile industry is one of the most significant sectors in the country, contributing substantially to its GDP, employment, and industrial output. As of 2024, the Indian automobile sector contributes approximately 7.1% to India’s GDP. Additionally, the sector accounts for about 49% of the country’s manufacturing GDP. This substantial contribution underscores the sector’s critical role in driving economic growth, creating employment, and fostering technological innovation across the country.
India is the fourth-largest automobile manufacturer in the world and has emerged as a key player in the global automotive landscape. The industry is known for its wide range of products, including passenger vehicles, commercial vehicles, two-wheelers, three-wheelers, and, recently, electric vehicles (EVs). Here’s a detailed overview:
Key Features:
Global Presence: India is one of the world’s largest manufacturers of automobiles, particularly in the two-wheeler and small-car segments. The country is also a significant exporter of vehicles and automotive components.
Growth Driver: The industry has been a major contributor to economic growth, driven by rising income levels, increased urbanization, and favorable government policies.
Technological Advancement: The industry is increasingly focusing on innovation, including the development of electric vehicles (EVs), connected vehicles, and advanced safety features.
Industry Structure
The Indian automobile sector is broadly divided into several key segments:
Passenger Vehicles (PV): It includes hatchbacks, sedans, SUVs, and luxury cars.
Commercial Vehicles (CV): It encompasses light commercial vehicles (LCVs), medium and heavy commercial vehicles (M&HCVs), and buses.
Two-wheelers: It includes motorcycles, scooters, and mopeds.
Three-wheelers: It includes auto-rickshaws and other small commercial three-wheelers.
Electric Vehicles (EVs): A rapidly growing segment covering all types of electric-powered vehicles.
Top Automobile Stocks Based on Market Capitalization
Best Automobile Stocks in India Based on Market Capitalization – An Overview
Here is a brief overview of the top Indian Automobile stocks:
1. Tata Motors Ltd.
Tata Motors was established in 1945 with the aim of being a locomotive manufacturer. In 1954, the company entered into a joint venture with Daimler-Benz and set up a manufacturing facility for Daimler lorries. Today, Tata Motors is a leading global automobile manufacturer. The company is a part of the illustrious multinational conglomerate, the Tata Group. It offers a diverse portfolio of automobiles, including sports utility vehicles, trucks, buses, and defense vehicles. It has operations in India, the UK, South Korea, South Africa, China, Brazil, Austria, and Slovakia through a strong global network of subsidiaries, associate companies and Joint Ventures (JVs). Its subsidiaries include Jaguar Land Rover in the UK and Tata Daewoo in South Korea. The company’s headquarters is in Mumbai.
2. Maruti Suzuki India Ltd.
Maruti Suzuki was established in 1981 by the Government of India and was previously known as Maruti Udyog Ltd. as a joint venture with Suzuki Motor Corporation (SMC), Japan. Suzuki initially held a 26% stake. The Government of India reduced its stake and sold its stake to Suzuki Motor Corporation in 2007. It is the market leader in the passenger vehicle segment in India. In terms of production volume and sales, the company is now SMC’s largest subsidiary. Maruti Suzuki Ltd. is a market leader in passenger vehicles and sells approximately 42% of the total passenger vehicles sold in India. The company’s headquarters is located in New Delhi.
3. Mahindra & Mahindra Ltd.
The company was established in 1945 by Ghulam Mohammad and two Mahindra Brothers (KC & JC Mahindra) as a steel trading company. It was later renamed Mahindra & Mahindra in 1948. Today, Mahindra & Mahindra Ltd. is one of the most diversified automobile companies in India, with a presence across 2-wheelers, 3-wheelers, PVs, CVs, tractors, and earthmovers segments. Mahindra Tractors is a unit of M&M and is also the world’s largest manufacturer of tractors. The company’s headquarters is located in Mumbai.
4. Bajaj Auto Ltd.
Bajaj Auto, the flagship company of Bajaj Group, was established in 1945 as Bachraj Trading Corporation Ltd. During its early days, the company used to import and sell two and three-wheelers in India. In 1959, the company got a license from Piaggio to manufacture Vespa scooters. The company exports to 79 countries across the world. Its headquarters are located in Pune.
5. Eicher Motors Ltd.
Eicher Motors Limited, incorporated in 1982, is the listed company of the Eicher Group in India. It is a major player in the Indian automobile industry and the global leader in middleweight motorcycles. It is the owner of the iconic Royal Enfield brand, which is focused on mid-sized motorcycles (250-750 cc). Classic, Bullet, and Himalayan are some of the brands owned by the company’s Royal Enfield brand. The automobiles manufactured by Eicher Motors are sold in more than 60 countries. The company entered a joint venture with Volvo Group to create Volvo Eicher Commercial Vehicles Limited (VECV). VECV is engaged in truck and bus operations, auto components business, and technical consulting services business. The company’s headquarters is located in New Delhi.
Top Automobile Stocks Based on One-Year Return
Company
1-Year Return
Bajaj Auto Ltd.
-23.89%
Samvardhana Motherson International Ltd.
-20.61%
TVS Motor Company Ltd.
25.84%
Mahindra & Mahindra Ltd.
28.02%
(As of 19 September 2025)
Best Automobile Stocks in India Based on One Year Return – An Overview
The best automobile stocks according to 1-Year return are given below, along with a brief overview:
Samvardhana Motherson International Ltd
Samvardhana Motherson International Ltd. was established in 1986 as a wiring harness manufacturer for Maruti Udyog. The company was a joint venture with the Sumitomo Group of Japan. The company primarily engages in the manufacture and sale of components to automobile manufacturers. The company is amongst the world’s largest manufacturers of exterior rear-view mirrors, has a dominant market share, and is a leading global player in polymer-based interior and exterior modules. Moreover, the group is also the largest manufacturer of wiring harnesses for passenger vehicles in India. The company’s headquarters is located in Noida.
TVS Motor Company Ltd.
TVS started its journey in 1911 when T.V. Sundaram Iyengar started a transportation business in Madurai. Today, TVS Motor Company Ltd (TVSM) is engaged in manufacturing two-wheelers and their accessories; it currently manufactures a wide range of two-wheelers and three-wheelers. TVSM is one of the leading players in the two-wheeler industry and is the only company to have a presence in all three categories, i.e., motorcycles, scooters, and mopeds, catering to both domestic and international markets. The company’s headquarters is located in Chennai.
Overviews of the remaining companies have been given above.
Key Performance Indicators (KPIs)
Company
ROE (%)
ROCE (%)
Debt to Equity
P/E (X)
P/B (X)
Tata Motors Ltd.
36.97
19.39
1.16
10.69
4.26
Maruti Suzuki India Ltd.
15.75
19.42
0
26.17
4.49
Mahindra & Mahindra Ltd.
17.02
13.89
1.56
31.11
5.21
Bajaj Auto Ltd.
26.61
32.5
0.06
34.22
9.47
Eicher Motors Ltd.
22.17
24.6
0.02
32.16
7.46
Samvardhana Motherson International Ltd.
10.38
13.07
0.66
41.89
4.99
TVS Motor Company Ltd.
24.85
22.1
3.73
72.85
18.4
(All the above data is of the year ended March 2024)
Benefits of Investing in Automobile Stocks
Here are some reasons to invest in Indian automobile stocks:
Growing Domestic Market: Rising incomes and urbanization are boosting vehicle demand.
EV Growth: Strong government support and early mover advantage in electric vehicles.
Export Potential: Expanding global reach and competitiveness in international markets.
Favorable Demographics: A young population and first-time buyers driving market growth.
Economic Recovery: Post-pandemic rebound and infrastructure development fueling demand.
Innovation: Investment in R&D and new product launches enhances the competitiveness and quality of automobiles.
Factors to consider while investing in Automobile Stocks
Here’s a summary of the key factors to consider before investing in the Indian automobile stocks:
Market Trends: Monitor shifts in consumer preferences, demand for electric vehicles (EVs), and urban vs. rural market dynamics.
Government Policies: Investors must remain informed regarding regulations on emissions, EV incentives, and tax changes that could impact the profitability of the companies.
Technological Innovation: Investors should look for companies leading innovation in EVs, automation, and connected vehicles.
Economic Factors: Evaluate the impact of interest rates, fuel prices, and overall economic growth on vehicle demand.
Supply Chain Strength: Assess the company’s ability to manage raw material costs and navigate challenges like semiconductor shortages.
Competitive Positioning: Look at market share, innovation, and the potential impact of new entrants in the industry.
Global Exposure: Factor in export opportunities, global economic conditions, and international partnerships.
Financial Health: Review the company’s financial statements thoroughly before investing.
Sustainability and ESG: Prioritize companies focusing on sustainable practices and good governance.
Future of the Automobile Industry
Investing in automobile stocks requires considering both their current market positions and future growth potential, especially with the industry’s shift towards electric and sustainable mobility. The following themes would define the future of the automobile industry:
Electric Vehicles (EVs): The shift towards electric mobility is one of the most significant trends in the Indian automobile sector. Companies that are early movers in this space, like Tata Motors and M&M, are likely to benefit.
Rural Demand: Companies with a strong rural presence, like Hero MotoCorp and Mahindra & Mahindra, are well-positioned to capitalize on the growing demand from these areas.
Premiumization: There is a growing trend towards premium vehicles, particularly in the two-wheeler segment, benefiting companies like Eicher Motors and Bajaj Auto.
The Indian automobile industry is poised for significant growth, driven by a combination of rising incomes, urbanization, favorable government policies, and technological advancements. The shift towards electric vehicles, the growing export market, and changing consumer preferences are shaping the future of the industry. As India continues to develop, the automobile sector is expected to play a crucial role in the country’s economic landscape, offering numerous opportunities for investors, manufacturers, and consumers alike. Understanding the key aspects of the industry will help investors identify opportunities and manage risks effectively, ensuring well-informed investment decisions in this rapidly evolving industry. Moreover, an individual can consult a financial advisor before investing.
S.NO.
Check Out These Interesting Posts You Might Enjoy!
What is the contribution of the Indian automobile sector to GDP?
The Indian automobile sector contributes approximately 7.1% to India’s GDP and about 49% to its manufacturing GDP.
What kind of market structure does the Automobile Sector have?
The Indian automobile sector exhibits the characteristics of monopolistic competition, with many firms offering similar products, which are not perfect substitutes, and some degree of pricing power.
What are the challenges faced by the Indian automobile sector?
Challenges faced by the Indian automobile sector include supply chain disruptions, semiconductor shortages, strict environmental regulations, and fluctuating raw material costs.
What role does rural demand play in the sector?
Rural demand is crucial for the automobile sector, especially for two-wheelers, tractors, and entry-level cars. Companies manufacturing two-wheelers and tractors are especially affected by the rural demand.
How is the Indian government supporting the automobile industry?
The government supports the industry through policies like FAME (Faster Adoption and Manufacturing of Electric Vehicles), incentives for EV adoption, and infrastructure development.
Selection Methodology and Important Disclaimer
The stocks included in this list are selected primarily on the basis of their market capitalisation, which represents the total market value of a company’s outstanding shares. The companies are arranged in descending order of market capitalisation, with larger companies appearing first, followed by relatively smaller companies. This methodology is intended to provide a structured approach for identifying companies based on their market size and overall presence within a sector.
However, market capitalisation should not be considered the sole factor while evaluating investment opportunities, as it does not guarantee future performance, profitability, or returns. Investors should also assess other important factors such as financial health, business fundamentals, management quality, valuation metrics, industry outlook, and market conditions before making investment decisions.
The information provided is for educational and informational purposes only and should not be construed as investment advice, recommendation, solicitation, or an offer to buy or sell any securities by Pocketful Fintech Capital Private Limited.
Open Free Demat Account
Join Pocketful Now
You have successfully subscribed to the newsletter
There was an error while trying to send your request. Please try again.