Blog

  • Takeover vs Buyback: Key Differences

    Takeover vs Buyback: Key Differences

    Investors often hear both words in the share market and get confused. Both are associated with the purchase of the shares, but the end impact is different. The takeover impacts the company, while the buyback impacts the shareholders mainly.

    Understanding the difference between takeover and buyback is important. This will help you understand how your ownership will be impacted. It will guide you on how you should reach in both situations.

    This guide explains what is takeover, what is buyback, how each process actually works in the Indian market, and how to read the two events when they show up in your holdings.

    What Is Takeover

    A takeover happens when one company, or an individual acquirer, gains control of another company. This is usually done by buying a controlling stake in its shares. Most of the time, when 25% or more voting rights are taken over as per the SEBI’s regulations, we call it a takeover.

    Control can be acquired through various ways, such as:

    • Open market purchases
    • Negotiated deal with existing promoters
    • Mandatory open offer to public shareholders

    In India, takeovers are governed by the SEBI (Substantial Acquisition of Shares and Takeovers) Regulations, 2011. It is commonly called the Takeover Code. Once an acquirer crosses the 25% threshold or seeks to gain control regardless of shareholding, the code requires a public announcement.

    Also, an open offer to buy at least 26% of the target company’s shares from public shareholders at a regulator-defined price needs to be made. This protects minority shareholders by giving them a chance to exit at a fair price rather than being left holding shares under a new, unknown management.

    Types of Takeover

    • Friendly takeovers is the one where the target company’s management and board support the acquisition. They all negotiate terms jointly, making the process simpler and quicker.
    • Hostile takeovers are situations where the acquirer bypasses the target’s management. They directly make an appeal to the shareholders. This is often through an open offer at a premium to the market price.
    • Reverse takeovers are situations where a smaller company acquires a larger one. It is often used to gain a stock exchange listing. This is done without going through a traditional IPO.

    For shareholders, a takeover usually means one of two things: 

    • An open offer that lets you sell your shares at a set price.
    • A change in company ownership and strategy.

    What Is Buyback

    A buyback is formally a share repurchase. It is when a company buys back its own shares from existing shareholders. The company does this to reduce the outstanding shares. It helps in the valuation as well. 

    The company uses its own cash reserves to do this. All the shares bought back are typically extinguished, permanently reducing the total share count. This is beneficial for those who have shares in the market already, as they get more control.

    Buybacks in India are governed by the SEBI (Buy-Back of Securities) Regulations, 2018. 

    The companies can execute them through two routes:

    1. Tender Offer Route

    Here, the company announces a fixed price. It is usually at a premium to the market price. The shareholders can tender their shares proportionately based on their holdings

    2. Open Market Route

    The company buys back shares gradually through the stock exchange over a specified period. This is without a fixed price announced in advance.

    Companies typically announce a buyback in the following situations:

    • When management believes the stock is undervalued.
    • If there is surplus cash sitting idle with no better investment opportunity.
    • When the company wants to return value to shareholders in a more tax-efficient way.

    A buyback also improves key ratios like earnings per share, since the same profit gets divided among fewer outstanding shares.

    In buyback, there is no change in the company. Promoters and public shareholders continue to hold the company in roughly the same relative proportion, minus whichever shareholders chose to sell into the buyback.

    Difference Between Takeover and Buyback: Side by Side

    FactorTakeoverBuyback
    Who initiates itAn external acquirer or another companyThe company buying back its own shares
    Effect on controlOwnership and control change handsControl generally stays with existing promoters
    Effect on share countUsually unchangedReduces total outstanding shares
    Governing regulationSEBI Takeover Code, 2011SEBI Buy-Back Regulations, 2018
    Shareholder actionMay need to respond to an open offerCan choose to tender shares or stay invested
    Typical market reactionPrice often jumps toward the open offer pricePrice often rises on reduced supply and signal of confidence
    Company’s cash positionUnaffected directly, since acquirer paysCompany cash reserves reduce
    FrequencyRare, event-driven, tied to a specific acquirer’s interestMore common, can recur across multiple years

    The difference between takeover and buyback comes down to one question: where is the money actually coming from or going to? A takeover is about a change of hands. A buyback is about a change of scale.

    Why the Distinction Matters for Investors

    Confusing the two events leads to two common mistakes.

    The first mistake is assuming every corporate action that lifts the share price is the same kind of opportunity. A takeover open offer is usually a one-time exit price set by regulation, and once it closes, the stock’s future depends entirely on the acquirer’s plans, which may or may not benefit remaining shareholders. A buyback, by contrast, is management signaling confidence in the existing business using its own operating cash, and the company continues to run under the same leadership and strategy afterward.

    The second mistake is misreading intent. A hostile takeover attempt can sometimes trigger a company to announce a defensive buyback, buying back shares specifically to reduce the number of shares available for the acquirer to purchase and to make the takeover more expensive. In this case, the two events appear together, but they are still fundamentally different tools serving different purposes, one changing control and the other defending it.

    Reading quarterly filings, exchange announcements, and open offer documents carefully, rather than reacting to headlines alone, is the only reliable way to tell which of the two events you are actually looking at.

    How to Track These Corporate Actions as a Trader

    Both takeovers and buybacks move stock prices quickly once announced, so timing and information quality matter.

    • Exchange filings on NSE and BSE websites carry the original public announcement for both events, well ahead of most news coverage.
    • SEBI’s SAST disclosures list every substantial acquisition and takeover trigger as it crosses the regulatory threshold.
    • Record dates and tender periods for buybacks are published in advance, giving existing shareholders a clear window to decide whether to tender shares.
    • Open offer price versus market price is the number to track during a takeover, since the market price often converges toward the open offer price as the deadline approaches.

    A trading platform with reliable corporate action alerts and a fast order execution system matters here, since the price gap between an announcement and the market’s full reaction can close within minutes of trading resuming. Traders using Pocketful can track these announcements alongside live price action and place orders through Scalper Mode when a corporate action creates a fast-moving opportunity, rather than relying on delayed news feeds.

    Conclusion

    The difference between takeover and buyback is really a difference in direction. In a takeover, an outsider is buying control, and shares typically stay in issue while ownership changes hands. In a buyback, the company itself is buying back its own shares, keeping control exactly where it was. Either way, both options have a direct impact on the company and the shareholders.

    For traders, it is important to understand how these work. This will help them to know what impact it will have on their portfolio. This is where platforms like Pocketful can help. They can guide you through the process and share the insights as needed.

    Frequently Asked Questions (FAQs)

    1. What is a takeover in simple terms? 

      A takeover is when one company or investor gains control of another company. This is mainly by buying enough shares, usually 25% or more. This influences or directs its management and decisions, often triggering a mandatory open offer to public shareholders under SEBI’s Takeover Code.

    2. What is a buyback in simple terms? 

      A buyback is a simple process of purchasing shares back. The company repurchases its own shares from existing shareholders. It does this by using its own cash. This reduces the total number of shares outstanding. It is done when company feels that shares are undervalued.

    3. Does a buyback change who controls a company? 

      No, a buyback does not usually change control. Promoters and remaining shareholders continue to hold the company in roughly the same manner. Here, the company is simply reducing its own share count. There is no transfer of ownership to the new company. The company usually clears all the shares that they buy, making them null.

    4. Is a takeover always good news for shareholders? 

      Not always. A takeover can bring a premium open offer price in the short term, but the stock’s longer-term outlook depends entirely on the new acquirer’s strategy, which may or may not align with what benefited shareholders under the previous management.

    5. Can a company use a buyback to prevent a hostile takeover?

      Yes, a company can announce a defensive buyback to reduce the number of shares available in the market. This can make it more expensive and difficult for a hostile acquirer to gain a controlling stake. But it is important to understand that both are different situations.


  • Global Index vs Indian Index: Key Differences

    Global Index vs Indian Index: Key Differences

    Have you ever wondered how people know if the stock market is doing well? A stock market index acts like a thermometer for the financial world. It tracks a specific group of stocks to show how the broader market is performing.

    Investors monitor these market indices to understand trends and check the health of the economy. Lately, there is a growing interest in both Indian and international markets. People want to find new growth opportunities beyond our borders.

    By tracking different markets, you can build a balanced portfolio and reduce your financial risk. When comparing a Global Index vs Indian Index, you will see how each offers unique benefits to help grow your wealth.

    What is a Stock Market Index?

    A stock market index is a tool that measures changes in the stock market. It groups similar companies based on their size or industry. This makes it easy for you to track a section of the economy without watching every single stock.

    Most modern indices are calculated using a free float market capitalization method. This means the index value depends only on shares available for public trading. Shares held by promoters or the government are not counted. Naturally, bigger companies have a bigger impact on the final index value.

    Stock market indices matter because they act as a benchmark. Fund managers use them to see if their mutual funds are performing well. For you, they help show the general mood of the market at a glance.

    What is a Global Index?

    A Global Index tracks companies listed in international markets. It gives you a quick snapshot of how foreign economies and big multinational businesses are doing.

    A key feature is that it includes many different businesses across various countries. This spreads your risk so you do not depend on just one country. These indices are also valued in foreign currencies like the US Dollar or Euro.

    Tracking global indices is important to understand international trends. They also serve as a benchmark for international funds. Some of the most famous global stock market indices include the S&P 500, Nasdaq Composite, Dow Jones, and FTSE 100. 

    What is an Indian Index?

    An Indian Index tracks companies listed on the domestic exchanges, like the National Stock Exchange and Bombay Stock Exchange. It acts as a direct mirror of our own financial landscape as they measure how our domestic stock market and local economy are performing.

    Indian Index tracks companies operating mostly in India. They reflect our economic growth and are valued entirely in Indian Rupees. This index helps investors to understand the mood of the domestic market on a daily basis. Experts and retail investors use them to guide and make decisions about their domestic investments.

    The most popular indexes used by the investors in India are Nifty50, Sensex, Nifty Bank, and NiftyIT. 

    Global Index vs Indian Index

    Understanding the differences between the domestic and international index is very important for the investors. It allows them to spread their investments and to build a diverse portfolio. 

    ParameterGlobal IndexIndian Index
    MeaningTracks the performance of companies listed in international markets.Tracks the performance of companies listed on Indian stock exchanges.
    Market CoveredGlobal or specific foreign markets.Domestic Indian stock market.
    ExamplesS&P 500, Nasdaq Composite, FTSE 100, Dow Jones.Nifty 50, Sensex, Nifty Bank, Nifty IT.
    Companies IncludedForeign companies located outside India like Apple and Amazon.Indian companies like Reliance Industries and HDFC Bank.
    CurrencyUSD, GBP, JPY, EUR, or other local international currencies.Indian Rupees (INR).
    Main PurposeMeasures international market performance and global trends.Measures the performance of the Indian stock market and economy.
    Key Influencing FactorsUS Federal Reserve decisions, global inflation, and oil prices.Indian economic state, RBI policies, and domestic inflation.
    Suitable ForInvestors seeking international exposure and geographical diversification.Investors focused strictly on the domestic Indian market.

    Top Global Indices vs Major Indian Indices

    • S&P 500 vs Nifty 50: The S&P 500 tracks the biggest 500 companies of the USA which covers about 80% of their market. Nifty 50 on the other hand tracks the 50 biggest companies of India. S&P is mainly concentrated with companies related to the technology sector, while Nifty50 mostly has companies related to the banking and financial sector. 
    • Nasdaq Composite vs Nifty IT: The Nasdaq Composite covers companies that are global giants like Apple and Microsoft, this composite includes approximately 3000 stocks in it. Nifty IT is much smaller compared to Nasdaq and it only tracks the top Indian Tech service based companies like TCS and Infosys. 
    • Dow Jones vs Sensex: The Dow Jones tracks 30 big US companies using a price weighted method. The Sensex tracks 30 well established Indian companies on the Bombay Stock Exchange. However, it uses the free float method.
    • FTSE 100 vs Nifty 50: The FTSE 100 tracks the 100 major companies of London. Many are global firms that make money all over the world. The Nifty 50 focuses on Indian companies driven mostly by our local economy and consumption.

    Factors That Influence Global Stock Indices

    • Interest Rate Decisions: The change in the interest rates by the central banks like the US Federal Reserve directly impacts the borrowing rates. If the rates are pushed upwards the global stock prices fall. 
    • Inflation Data: Rising prices can lower stock values. This happens because companies face higher production costs.
    • GDP Growth: Strong economic growth shows better consumer demand worldwide. This boosts confidence in investors and the global markets.
    • Corporate Earnings: The profits made by a global giant directly affects the index values. 
    • Geopolitical Events: Conflicts, trade wars, or political tensions have direct correlation with the disruption of global trade. These events often cause sudden market drops.
    • Currency Movements: A strong US Dollar can affect the profits of US companies making money overseas.
    • Commodity Prices: Changes in gold and crude oil prices impact global inflation. This affects corporate profits around the world.

    Read Also: ETF vs Index Fund: Key Differences

    Factors That Influence Indian Stock Indices

    • RBI Monetary Policy: Interest rate changes by the RBI affect borrowing costs for Indian businesses. This directly impacts their profits.
    • Government Budget: Policies and taxes announced in the Union Budget are big triggers for local stocks.
    • FII and DII Investments: The buying and selling by foreign and domestic institutions guide the market. Their large investments give our market clear direction.
    • Rupee Exchange Rate: A weaker Rupee makes imports expensive. However, it helps export sectors like Information Technology.
    • Corporate Earnings: Profits from large Indian companies dictate the mood of the index. Big companies like Adani, Reliance and HDFC Bank can push the whole market in a positive direction. 
    • Domestic Economic Growth: India’s GDP and people demand in the rural area is the key driver of the index. Good numbers put a positive impact on the domestic market. 
    • Inflation and Interest Rates: Rising inflation makes the central bank of India keep interest rates high. This slows down corporate expansion and market growth.

    How Global Markets Impact Indian Markets

    We often see our markets react to Wall Street. US Market Influence on Indian Markets is very visible. If US markets fall, Indian markets usually open lower the next day. This happens because investor feelings shift quickly across borders.

    The Impact of Federal Reserve Decisions is also very strong. When the US raises interest rates, foreign investors might take money out of India to invest in safer US assets. This selling puts heavy pressure on our local stocks.

    The Dollar Index (DXY) and Rupee Movement play a critical role too. A strong US Dollar usually weakens the Indian Rupee. This makes importing goods more expensive for us and drives up domestic inflation.

    The Effect of Crude Oil Prices is something we cannot ignore. We import a lot of crude oil. High oil prices cause inflation and hurt the profits of our manufacturing companies.

    Foreign Institutional Investors (FIIs) dictate a lot of movement in India. Bad global economic news often leads to heavy selling by FIIs. This directly pulls down major indices like the Nifty 50.

    Lastly, Global Economic Slowdowns and Their Effect on India are significant. A global slowdown reduces the demand for our exports. This hurts sectors like IT and pharma that rely on international clients.

    Benefits of Tracking Global Indices

    • Better Market Awareness: It helps you predict shifts in our domestic stocks. It acts like an early warning system.
    • International Diversification: It is the first step to spreading your investments across different countries. This reduces your dependence on a single economy.
    • Understanding Global Economic Trends: They show which industries are doing well worldwide. You get to see the big picture.
    • Identifying Overseas Investment Opportunities: You can spot high growth sectors. Themes like artificial intelligence might not be fully available in the Indian market yet.

    Benefits of Tracking Indian Indices

    • Understand Domestic Market Trends: They give a clear picture of our country’s economic progress. They show how healthy our domestic businesses are becoming.
    • Benchmark Mutual Fund Performance: You can check if your mutual funds are performing better than the overall market.
    • Better Investment Decisions: Tracking different sectors helps you see which parts of the economy are leading. It shows if banking or IT is currently doing well.
    • Suitable for Long-Term Wealth Creation: It helps you focus on long term growth. You can avoid getting distracted by daily news.

    Read Also: GIFT Nifty vs Nifty 50: Key Differences

    Common Mistakes Investors Make While Comparing Global and Indian Indices

    • Comparing returns without considering currency fluctuations: An international index might show huge gains. However, currency changes can lower your actual returns when converted to Rupees.
    • Ignoring sector composition: The S&P 500 is tech heavy, while the Nifty 50 focuses on banks, comparing them is not feasible as there is a very major difference.
    • Assuming one index predicts another: A rise in a global index does not guarantee the Indian market will go up on the same day. Local factors always play a big role.
    • Overlooking valuation differences: Developed and emerging markets trade at different values. This is based on their unique risks and growth rates.
    • Chasing short-term global trends: Moving money just because a foreign market rallied is risky. It can disrupt your carefully planned long term strategy.

    Conclusion

    Both global and domestic indices have a special place in a smart financial strategy. A global index gives you exposure to international brands and spreads your risk. On the other hand, an Indian index captures the massive potential of our growing economy. Understanding how they work together helps you build a strong portfolio. This knowledge will guide you toward smarter and more confident financial choices.

    For more market news and insights, download Pocketful – offering users zero brokerage on delivery trades and an easy to use platform designed for both beginners and experienced investors. 

    S.NO.Check Out These Interesting Posts You Might Enjoy!
    1Mutual Fund vs ETF. Are They Same Or Different?
    2Difference Between Gold ETF and Silver ETF
    3ETF vs Stock – Which One is the Better Investment Option?
    4Gold ETF vs Gold Mutual Fund: Differences and Similarities
    5ETF vs FOF: Key Differences

    Frequently Asked Questions (FAQs)

    1. Can Indian investors directly buy a global index?

      You cannot directly buy a global index. However, you can invest in international mutual funds or global ETFs that track these indices.

    2. Which is better for long term investing, global or Indian index?

      Both serve different purposes. An Indian index offers high growth potential in a developing economy. A global index provides geographical diversification and exposure to international brands.

    3. Why does the US Dollar Index affect the Indian market?

      A rising US Dollar Index generally leads to a weaker Indian Rupee. This increases the cost of imports like crude oil, which can drive up domestic inflation.

    4. Is the Nifty50 different from S&P 500?

      Yes, Nifty50 tracks the biggest 50 Indian companies that generally includes companies from the banking and financial sectors. On the other hand S&P 500 tracks the 500 biggest companies of the US that majorly deals in the tech sector.  

    5. Do global indices carry currency risk?

      Yes, they do. Since global indices are measured in foreign currencies, your investments are subject to exchange rate changes. This can impact your final returns.

  • A Guide to SEBI’s New Categories of Mutual Fund

    A Guide to SEBI’s New Categories of Mutual Fund

    A mutual fund is one of the easiest ways to create wealth in the long run, but for a retail investor, it is quite difficult to choose the right fund that suits their investment objective and risk profile. Various schemes are made available through asset management companies. To make it simpler, SEBI has introduced a new categorisation.

    In today’s blog post, we will give you an overview and a guide to SEBI’s new categories of mutual funds.

    What is SEBI Mutual Fund Categorisation?

    SEBI categorisation of mutual funds is a framework that defines mutual fund schemes into various categories based on their investment objective and asset allocation. The mutual fund categorisation was introduced by SEBI in 2017 to bring uniformity among fund houses. Before this, the asset management companies offered multiple schemes with similar investment strategies. 

    Why did SEBI introduce categorisation?

    SEBI introduced the new mutual fund categorisation due to the following objective:

    • Easy Fund Selection: As mutual fund companies offer various schemes, the SEBI categorisation helps investors in identifying the suitable scheme based on their investment objective.
    • Avoid Overlapping: Some AMCs offer multiple schemes with identical investment strategies under a similar name. SEBI category of mutual fund eliminates duplicate schemes.
    • Enhance Transparency: Each scheme has a defined investment strategy. This allows investors to understand where their capital is invested.
    • Comparison of Funds: Because of standard categorisation of mutual fund schemes by SEBI, investors can compare similar types of funds, allowing them to have a better understanding of funds.

    Categories of Equity Mutual Fund

    It is the most prominent category of mutual fund in which an investor invests their money. The equity mutual fund has 11 categories that are divided based on the market capitalisation of shares. For the convenience of investors.

    SEBI has defined the meaning of large cap, mid cap, and small cap. The following is the categorisation of large cap, mid cap and small cap by SEBI:

    • Large Cap: Top 100 shares based on market capitalisation.
    • Mid Cap: 101st to 250th company based on market capitalisation.
    • Small Cap: 251st company onwards based on market capitalisation.

    1. Large Cap Fund Category

    This fund is designed for investors seeking investment opportunities in well-established companies. Large cap companies are industry leaders having a proven track record of financial stability.

    ParticularDetails
    Scheme TypeEquity Scheme
    DefinitionAn open-ended equity mutual fund that predominantly invests in large-cap companies.
    Asset AllocationMinimum 80% of total assets in equity and equity-related instruments of large-cap companies.

    2. Large & Mid Cap Fund Category

    This category helps investors in having equal allocation in large-cap and mid-cap companies. This provides them a balanced approach in managing stability with growth.

    ParticularDetails
    Scheme TypeEquity Scheme
    DefinitionAn open-ended equity mutual fund investing in both large-cap and mid-cap companies.
    Asset AllocationMinimum 35% in large-cap stocks and 35% in mid-cap stocks.

    3. Mid Cap Fund Category

    These funds primarily invest in mid-cap companies that have strong growth potential in the long run. They can become future large-cap companies. This category is suitable for investors having an investment horizon of more than 7 years.

    ParticularDetails
    Scheme TypeEquity Scheme
    DefinitionAn open-ended equity mutual fund investing predominantly in mid-cap companies.
    Asset AllocationMinimum 65% of total assets in mid-cap stocks.

    4. Small Cap Fund Category

    These are relatively smaller companies having lower market capitalisation than mid and large cap companies. This category is highly volatile in nature. This is best suited for aggressive investors.

    ParticularDetails
    Scheme TypeEquity Scheme
    DefinitionAn open-ended equity mutual fund investing primarily in small-cap companies.
    Asset AllocationMinimum 65% of total assets in small-cap stocks.

    5. Multi Cap Fund Category

    This is one of the recent categories introduced by SEBI. The fund manager has liberty to invest across market caps, including large, mid and small, but in equal proportion.

    ParticularDetails
    Scheme TypeEquity Scheme
    DefinitionAn open-ended equity mutual fund investing across large-cap, mid-cap, and small-cap companies.
    Asset AllocationMinimum 25% each in large-cap, mid-cap, and small-cap stocks.

    6. Flexi Cap Fund Category

    In dynamic market conditions, investment opportunities also change. This fund provides flexibility to the fund manager to invest across all market capitalisations without having any fixed allocation.

    ParticularDetails
    Scheme TypeEquity Scheme
    DefinitionAn open-ended dynamic equity mutual fund investing across market capitalisations.
    Asset AllocationMinimum 65% of total assets in equity and equity-related instruments.

    7. Dividend Yield Fund Category

    This is a conservative equity category of mutual fund. The fund manager primarily invests in companies that have high dividend yields. This category of fund is suitable for long-term investors seeking both dividend income and capital appreciation.

    ParticularDetails
    Scheme TypeEquity Scheme
    DefinitionAn open-ended equity mutual fund investing primarily in high dividend-yielding companies.
    Asset AllocationMinimum 65% in equity and equity-related instruments.

    8. Value Fund Category

    Value investing is a very famous style in which one invests in companies that are generally trading below their intrinsic value, or undervalued companies. These undervalued companies can generate significant returns in the long-run.

    ParticularDetails
    Scheme TypeEquity Scheme
    DefinitionAn open-ended equity mutual fund following a value investment strategy.
    Asset AllocationMinimum 65% in equity and equity-related instruments.

    9. Contra Fund Category

    This fund follows a contrarian investment approach. Unlike a value fund contra fund manager invests in companies that are currently not in favour but have strong growth potential.

    ParticularDetails
    Scheme TypeEquity Scheme
    DefinitionAn open-ended equity mutual fund following a contrarian investment strategy.
    Asset AllocationMinimum 65% in equity and equity-related instruments.

    10. Focused Fund Category

    This is one of the riskiest categories of equity mutual fund because of its concentrated portfolio. According to the SEBI mandate, a focused fund manager can invest only in up to 30 stocks.

    ParticularDetails
    Scheme TypeEquity Scheme
    DefinitionAn open-ended equity mutual fund with a concentrated portfolio.
    Asset AllocationMinimum 65% in equity and equity-related instruments with a maximum of 30 stocks.

    11. Sectoral or Thematic Fund Category

    Sectors are cyclical in nature; hence, when a fund manager invests in a particular sector, including banking, pharma, IT, etc., they are known as sectoral funds. Whereas, on the other hand, if a fund manager invests in any particular theme, such as an infrastructure theme or an ESG theme, they are known as Thematic funds.

    ParticularDetails
    Scheme TypeEquity Scheme
    DefinitionAn open-ended equity mutual fund investing in a specific sector or investment theme.
    Asset AllocationMinimum 80% of total assets in a particular sector or theme.

    Read Also: How to Compare Mutual Funds in India?

    Categories of Debt Mutual Fund

    The following new debt mutual fund categories were introduced by SEBI in 2017:

    1. Overnight Fund Category

    This fund was introduced by SEBI to facilitate investors to park their money for a very short period without taking any risk. The debt securities of this portfolio mature within one business day.

    ParticularDetails
    Scheme TypeDebt Scheme
    DefinitionAn open-ended debt mutual fund investing in overnight securities with a maturity of one day.
    Asset AllocationInvests 100% of its assets in overnight securities having a maturity of 1 day.

    2. Short Duration Fund Category

    This category of fund is suitable for investors who want to have better returns than liquid funds. The portfolio has securities with short maturity.

    ParticularDetails
    Scheme TypeDebt Scheme
    DefinitionAn open-ended short-term debt mutual fund investing in debt and money market instruments.
    Asset AllocationPortfolio Macaulay Duration between 1 year and 3 years.

    3. Medium Duration Fund Category

    These funds invest in debt securities having a maturity of duration between 3 to 4 years. Suitable for investors seeking income generation and capital appreciation.

    ParticularDetails
    Scheme TypeDebt Scheme
    DefinitionAn open-ended debt mutual fund investing in medium-term debt securities.
    Asset AllocationPortfolio Macaulay Duration between 3 years and 4 years.

    4. Medium to Long Duration Fund Category

    According to SEBI, this fund invests in securities having longer maturity. This is suitable for investors having a 4 to 7 years of investment horizon

    ParticularDetails
    Scheme TypeDebt Scheme
    DefinitionAn open-ended debt mutual fund investing in medium- to long-term debt securities.
    Asset AllocationPortfolio Macaulay Duration between 4 years and 7 years.

    5. Long Duration Fund Category

    This fund primarily invests in securities having long-term debt. These funds are generally highly volatile in nature due to changes in interest rates.

    ParticularDetails
    Scheme TypeDebt Scheme
    DefinitionAn open-ended debt mutual fund investing in long-term debt instruments.
    Asset AllocationPortfolio Macaulay Duration of more than 7 years.

    6. Credit Risk Fund Category

    This fund primarily invests in corporate bonds that generally have lower credit ratings and offer higher interest rates. They aim to generate higher returns by managing risk.

    ParticularDetails
    Scheme TypeDebt Scheme
    DefinitionAn open-ended debt mutual fund investing primarily in below-highest-rated corporate bonds.
    Asset AllocationMinimum 65% of total assets in corporate bonds rated below the highest rating.

    Categories of Hybrid Mutual Fund

    The newly introduced hybrid category mutual funds are as follows:

    1. Multi Asset Allocation Fund Category: There is correlation between the assets; when equity performs in a phase, the other assets might not perform. A multi-asset allocation fund can help investors.
    2. Equity Savings Fund Category: The fund adopts various investment strategies, including equity, arbitrage, and debt securities, etc. This approach helps investors sail through volatile markets.

    Read Also: Types of Mutual Funds in India

    Conclusion

    On a concluding note, the standard categorisation introduced by SEBI has made investing organised for investors. It reduces confusion because of different scheme names and categories. The categorisation will make it easy for investors to pick a fund based on their investment objective and financial goal, etc. But it is advisable to consult your investment advisor before making any investment decision.

    S.NO.Check Out These Interesting Posts You Might Enjoy!
    1Mutual Fund vs PMS: Which is Better?
    210+ Best Investment Plan for Monthly Income in India
    3Hybrid Mutual Funds – Definition, Types and Taxation
    4What is an Open-Ended Mutual Fund & How to Invest in it?
    5Mutual Fund vs ETF. Are They Same Or Different?

    Frequently Asked Questions (FAQs)

    1. How many total categories of mutual fund defined by SEBI?

      SEBI has defined a total of 38 mutual fund categories across all asset classes.

    2. Can an asset management company offer multiple schemes under the same category?

      No, an AMC cannot offer multiple schemes under the same category.

    3. What are hybrid mutual funds?

      Hybrid mutual funds are considered a mix of equity and debt. The fund manager can have both equity and debt in their portfolio.

    4. What is SEBI mutual fund categorisation?

      SEBI mutual fund categorisation is a framework under which asset management companies can offer their schemes.

    5. Which mutual fund category contains the highest risk?

      Small cap, focused and sectoral/thematic categories of mutual funds carry the highest risk.

  • Why Is the Indian Rupee Falling in 2026? Reasons, Impact & Outlook

    Why Is the Indian Rupee Falling in 2026? Reasons, Impact & Outlook

    The Indian rupee is falling to INR 96 as of July 2026. It is one of the lowest rates in terms of dollar exchange. It even went to 83 in 2025-26. This is one major concern that people have.

    For anyone asking why the rupee is falling, understanding the reasons is important. But the honest answer is that it is not one single cause. There are several pressures hitting India’s currency at the same time, some external and out of India’s control, and some tied to domestic monetary policy choices.

    Know the Indian rupee falling reasons and all the details you need in this guide.

    Why Is the INR Falling in 2026? Quick Answer

    The rupee is falling in 2026 because of six factors hitting together: 

    • Sharp crude oil price spike from the West Asia conflict
    • Sustained foreign portfolio investment outflows
    • Broadly stronger US dollar backed by high Federal Reserve rates
    • US tariffs on Indian exports
    • Narrower interest rate gap after the RBI’s December 2025 rate cut
    • General geopolitical risk impacting the dollar value.

    The rupee moved from about 89.86 per dollar to 96.5 per dollar in 2026.

    Six Reasons the Rupee Is Falling

    S.NOReasonDirect Effect on INR
    1Crude oil price spike after Middle east  conflictMore dollars needed to pay for oil imports
    2Foreign portfolio investment outflowsInvestors sell rupees to convert back to dollars
    3Broadly stronger US dollarHigh Fed rates pull global capital into dollar assets
    4US tariffs on Indian exportsWeaker export dollar inflows
    5RBI repo rate cut to 5.25%Narrower rate gap reduces rupee’s yield appeal
    6Geopolitical risk aversionGlobal capital moves to safe-haven dollar

    How Far Has the Rupee Fallen in 2026

    This is one of the most important questions to address here. Here are main points:

    • In early January, the rupee was at 89.86 per dollar.
    • By April 30, it had slid to a record low of around 95.33.
    • It further fell to touch an even weaker level near 96.57 in May.
    • It is settling into a range of roughly 94 to 96.5 through June and July. 

    That is a fall of more than 10% against the dollar in about 18 months. This is indeed one of the steepest moves for the rupee since 2013.

    This is not a one-day story. The pressure built in stages, and each stage added a new reason to the list of why the Indian rupee falls when so many other emerging market currencies have held up comparatively better.

    Top Reasons Why the Rupee Is Falling in 2026

    While many people think that it is only because of the trade situations, they fail to point out the other factors that are playing a crucial role here. So, here are the key factors:

    1. A Sharp Spike in Crude Oil Prices

    India gets oil from other countries. It gets nearly 85% to 88% coming from overseas. So, any change in oil prices creates a direct impact. Take the US-Iran-Israel conflict, for example. In early 2026, it impacted Brent crude. The prices went from $80 to $120 per barrel in a few days.

    A higher oil bill means India needs more US dollars to pay for imports. As demand for dollars increases, the rupee tends to weaken. This is why crude oil prices remain one of the biggest factors influencing the Indian currency.

    2. Foreign Investors Pulling Money Out

    Foreign investors have been reducing their exposure to Indian markets. This has been happening for over the past several months. When they sell shares or bonds in India, they convert the money into US dollars before moving it abroad.

    The result is simple. More people buying dollars and selling rupees creates pressure on the Indian currency. Large FII outflows have therefore added to the rupee’s recent decline.

    3. The US Dollar Has Become Stronger

    The rupee is not the only currency under pressure. Many emerging market currencies have weakened because the US dollar has become stronger.

    One reason is that US interest rates have stayed high. Investors can earn better returns on dollar-based assets. But in this case, the money flow is towards the USA. As demand for the dollar rises globally, currencies like the rupee lose some value.

    4. Slower Export Growth

    Trade-related challenges have also played a role. Tariffs on some Indian exports have made them less competitive in international markets. This is also reducing the flow of dollars into the country.

    At the same time, India’s import bill has remained high. So, when the dollar moves out of the country, you will see that the value of the rupee falls.

    5. RBI Reduced Interest Rates

    The RBI lowered the repo rate to support economic growth. While this helped borrowers, it also narrowed the gap between Indian and US interest rates.

    For global investors, Indian assets became slightly less rewarding. Over time, that can reduce foreign investment and weaken the rupee further.

    6. Global Uncertainty

    Whenever geopolitical tensions rise, investors usually avoid riskier markets. They start moving towards the markets that feel safer.

    The conflict in West Asia triggered exactly that behaviour. As money flowed into the dollar, many emerging market currencies declined together, and the Indian rupee was among them.

    Impact of the Falling Rupee

    A weaker rupee is not uniformly bad news. It is based on the aspect of how it impacts your value. So, here is what you should know about.

    Who is hurt by a falling rupee:

    • Consumers face costlier imported goods. This can include electronics, crude oil-linked fuel prices, and edible oils.
    • Companies with dollar-denominated debt will have an increase in debt.
    • Students and families paying overseas tuition or planning foreign travel need more rupees for the same dollar cost.
    • Import-heavy sectors such as oil marketing companies and electronics manufacturers can get their margins impacted.
    • Inflation can increase, which is one of the key concerns for all.

    Who benefits from a falling rupee:

    • IT services exporters, since a large share of their revenue is billed in dollars and converted into rupees.
    • Pharmaceutical exporters with significant US and European revenue exposure.
    • NRIs remitting money home can send more now.
    • Domestic manufacturers compete with imports, since costlier foreign goods make local alternatives relatively more attractive.

    Traders watching IT, pharma, and export-facing stocks often track the rupee alongside quarterly earnings, since currency movements can shift margins meaningfully even when a company’s underlying business has not changed. A platform with live sector data and an options chain, such as Pocketful, makes it easier to track how a weakening rupee is showing up in real time across export-heavy stocks rather than waiting for the next earnings call to find out.

    Read Also: Key Factors Affecting the Indian Stock Market Explained

    Will the Rupee Keep Falling

    The rupee may remain under pressure in the coming months. Current estimates place the exchange rate between ₹93 and ₹98 per dollar. But it is important to know that much will depend on global oil prices and the progress of a US-India trade agreement.

    If crude oil prices cool and export conditions improve, the rupee could stabilise. This can worsen if there is any change in the conditions. This is where RBI would need to step in as well. It usually starts with selling dollars from the foreign exchange reserves. 

    The RBI aims to reduce excessive volatility and maintain stability. While these interventions help slow down the impact, they definitely do not clear them out.

    Conclusion

    The Indian rupee falling through 2026 is the result of several forces arriving together. This is something that you should understand. As traders, it is important to analyse the market and also know the impact that it will have on the market.

    But that is not it. As the rupee falls, you will also find that things get expensive, or you may even face higher taxes or linked financial restrictions. The government policies are used to manage the rates. 

    Knowing all these and managing the investments is hard, and this is where you would need the support of the experts. This is where Pocketful can help you plan and invest better. So, start today and stay updated with the news as needed.

    S.NO.Check Out These Interesting Posts You Might Enjoy!
    1How Does the Stock Market Work in India?
    2Are Indian Stock Markets Overvalued?
    3What is a good rule for investing in stocks?
    4Different Types of Trading in the Stock Market
    5What Are The Challenges Traders Face When Trading In The Stock Market?

    Frequently Asked Questions (FAQs)

    1. Why is the rupee falling against the US dollar?

      The fall in the rupee against the US dollar is mainly due to crude oil and policies. This may change based on policies as well.

    2. How does a weak rupee affect everyday life?

      A weaker rupee makes imports more expensive. This can add to the prices of the products, which can put pressure on your buying capacity.

    3. Is a falling rupee good for exporters?

      In many cases, yes. Exporters earn in foreign currencies like the US dollar. So, when the rupee is weaker, they get more rupees from their earnings when they convert.

    4. What is the RBI doing to support the rupee?

      RBI takes regular steps to ensure that the rupee is moving in the right direction. It implements policies or even imposes restrictions as needed.

    5. Should investors worry if the rupee keeps falling?

      Not always. Investors need to understand the market. But if the rupee keeps falling, it can impact the value invested as well. Therefore, it is important to keep track of the same.

  • AlphaGrep Multi Asset Allocation Fund NFO 2026

    AlphaGrep Multi Asset Allocation Fund NFO 2026

    If you have tracked the mutual fund space, you have probably come across a new name, AlphaGrep. The company has just stepped into the retail mutual fund business with its first offering, the AlphaGrep Multi Asset Allocation Fund. 

    The NFO opened on July 6 and will close on July 20, 2026.

    This looks like any other multi-asset fund. In practice, the story is a bit more interesting. Let us explore in detail. 

    Before we jump into the NFO, it is important for us to know what are Multi-Asset Allocation Funds

    SEBI’s rulebook for multi-asset allocation funds requires exposure to at least three asset classes, with a minimum of 10% parked in each. It is a type of hybrid mutual fund. 

    AlphaGrep – An Overview 

    Most Indian investors are meeting AlphaGrep for the first time through its recently launched Multi Asset Allocation Fund. 

    AlphaGrep was founded in 2010 by Mohit Mutreja and Parshant Mittal, both graduates of the University of Pennsylvania’s Management and Technology programme at Wharton

    The two returned to India with an idea to build a quant-focused proprietary trading company from Indian soil that could compete on the same technological footing as the big global players. Then they started as a small team of five in a single room in Mumbai.

    Today, AlphaGrep operates as a global, multi-asset proprietary trading firm, with a headcount north of 400 spread across offices in Mumbai, Bengaluru, Gurugram, London, Singapore, Chicago, Dubai and Shanghai, among others.

    The core of the business remains using mathematics, statistics and low-latency trading infrastructure to spot small, fleeting inefficiencies across markets and capture them systematically.

    The mutual fund license came in 2025, and AlphaGrep Mutual Fund launched its first scheme, the Multi Asset Allocation Fund, in July 2026. The reasoning the founders have given publicly is that their AIF and PMS offerings, while successful, only reach a relatively narrow set of wealthy or institutional investors because of ticket size restrictions. A mutual fund, by contrast, opens the door to lakhs of retail investors who can start with as little as ₹500.

    Key NFO Details – At a Glance 

    FeatureDetails
    NFO price₹10 per unit
    Minimum investment₹500 (lump sum and SIP)
    Benchmark35% NIFTY 200 TRI + 45% NIFTY Composite Debt Index + 20% MCX iCOMDEX Composite Index
    SIP₹500, minimum 6 instalments
    Fund Manager Mr. Ravneet Singh
    Exit load1% if redeemed within 15 days, nil after that
    Total Expense RatioUp to 1.85% + statutory levies (as applicable)
    Risk ratingVery High
    PlansRegular and Direct
    OptionsGrowth and IDCW
    ListingNot listed on any exchange

    Scheme Allocation 

    InstrumentMinimum Maximum 
    Equity & Equity-related instruments 35%80%
    Debt & Money Market Instruments10%80%
    Gold/Silver/ Commodity ETFs/ Exchange Traded Commodity Derivatives 10%60%
    Units issued by InvITs0%10%

    In simple terms, 

    • Equity will get at least 35% of the fund’s money, and can go up to 80%.
    • Debt and money market instruments can range anywhere from 10% to 80%.
    • Gold, silver, or other commodity ETFs and derivatives can make up 10% to 60% of the portfolio.
    • InvITs are optional. The fund can hold 0%, or up to a maximum of 10%. 

    Read Also: NFO Alert: PGIM India Large & Mid Cap Fund

    Taxation

    Tax on dividend income

    Resident investors pay tax on dividend income as per their income tax slab rate. 

    Non-resident investors pay either 20% or the slab rate, whichever applies based on their income. The mutual fund itself doesn’t pay any tax on this (NIL).

    Capital gains tax

    1. LTCG:

    For long-term capital gains, both resident and non-resident investors are taxed at 12.5%. 

    2. STCG:

    For short-term capital gains, both resident and NRI investors are taxed as per their applicable income tax slab rate. Again, the mutual fund pays no tax on capital gains (NIL).

    How is this fund different from other Multi Asset Allocation Funds?

    Between 2022 and 2026, most multi-asset allocation funds in the industry kept their equity allocation somewhere between 56% and 65%, with commodities getting a much smaller slice compared to equity. Looking at how these funds typically operate, a few patterns stand out:

    • Human bias: A lot of the allocation calls come from sentiment, not hard signals.
    • Inconsistent process: Every fund manager sees the market differently, so outcomes vary from fund to fund.
    • Diversification that doesn’t really work: Even funds with very different stated strategies often end up looking quite similar to each other.
    • Macro views that don’t always show up in the portfolio: A manager might talk about being cautious on equity, but the actual allocation does not always reflect that view.

    AGMAAF tries to fix this by keeping the whole process systematic and model-driven, so the same signals lead to the same decisions every time. 

    The only place where human judgement comes in is picking debt instruments, and even there, it is limited to a high-quality AAA/AA+ universe. Beyond that, the allocation is built to shift on its own as market conditions change, rather than waiting for a manager to decide.

    Things to keep in mind before investing

    • No track record: This is a brand-new scheme. There is no NAV history, no past returns, nothing to judge performance against. You are betting on the process and the team, not on results.
    • The 15-day exit load: Many equity and hybrid funds use a one-year window. However, the fund has a 15-day exit load, which means if you redeem your funds within 15 days of investing, an exit load will apply.
    • Commodity exposure adds volatility: Gold, silver and commodity derivatives can swing sharply because of global cues and currency movements that have nothing to do with what’s happening in Indian equity or debt markets.

    Who Should Invest? 

    • First-time mutual fund investors who want to diversify their portfolio 
    • Long-term investors with a 5+ years investment horizon 
    • HNIs looking for an institutional-grade quant approach 
    • Also, this fund could suit someone who’s comfortable with a rules-based, systematic approach and specifically wants equity, debt and commodity exposure in a single scheme instead of managing three separate funds. 

    But go in with your eyes open since there is no history to look at, and the commodity and InvIT exposure bring in risks 

    Conclusion 

    AlphaGrep’s Multi Asset Allocation Fund brings a different, quant-driven take on a category that is usually run by discretionary calls. Whether that process delivers better risk-adjusted returns than a simpler allocation approach is something only time will tell. 

    If you are comfortable with the rules-based approach, the non-equity tax treatment and the commodity exposure, this could be worth tracking, ideally once the model has a bit of live history behind it.

    S.NO.Check Out These Interesting Posts You Might Enjoy!
    1What Is An IPO Mutual Fund? Should You Invest?
    2Mutual Fund Taxation – How Mutual Funds Are Taxed?
    3What is Solution Oriented Mutual Funds?
    4What is TREPS & Why Mutual Funds Invest in it?
    5Debt Mutual Funds: Meaning, Types and Features

    Frequently Asked Questions (FAQs)

    1. What is AlphaGrep Multi Asset Allocation Fund?

      It is an open-ended multi-asset allocation fund which invests across three asset classes, equity, fixed income and commodities. 

    2. What is the recommended investment horizon of this fund? 

      A minimum horizon of three years is suggested, and 5 years or more is preferred. 

    3. Does this fund carry risk? 

      Yes. The risk of the scheme is very high, and investors should consult their financial advisors before starting their investment journey.

    4. What is the investment objective of this fund? 

      The objective of this fund is to generate long-term capital appreciation by investing in a diversified portfolio. 

    5. What are the subscription dates of the NFO?

      The NFO dates are from 6th July, 2026 to 20th July, 2026. 

  • How to Calculate Margin Trading Interest Rates?

    How to Calculate Margin Trading Interest Rates?

    Using margin trading can boost your purchasing power; however, if you trade without understanding how margin trading interest rates are calculated, a portion of your profits could be consumed by interest costs. Therefore, it is essential to understand the full cost involved before opting for MTF. In this article, you will learn in simple language about margin trading interest rate calculations, easy formulas, examples, hidden charges, and practical ways to reduce interest expenses.

    What is Margin Trading Interest? 

    With the Margin Trading Facility (MTF), you can purchase shares without paying the full amount upfront. You contribute a portion of the purchase cost, while your broker funds the remainder. Interest is charged based on the applicable margin trading interest rate only on the amount funded by the broker, not on the total value of the trade.

    Most brokers calculate MTF interest on a daily basis; this means interest accrues daily on the funded amount for as long as your MTF position remains open. However, the frequency of interest debits (e.g., daily, weekly, or monthly) may vary depending on the specific broker’s policy. Therefore, it is advisable to review the interest terms and charges before using the MTF.

    Example: Suppose you bought shares worth ₹1,00,000.

    DescriptionAmount
    Total shares purchased₹1,00,000
    Your Investment₹25,000
    Broker-Funded Amount₹75,000

    How Does Margin Trading Interest Actually Work? 

    You should understand when interest is charged in MTF, on what amount, and for how long.

    Step 1 – Buy shares using margin

    First, you purchase shares via MTF. You pay a portion of the purchase cost, while the broker funds the remaining amount.

    Step 2 – Broker funds the remaining amount

    Once the order is executed, the broker funds the specified amount for you. Interest on margin trading applies to this funded amount.

    Step 3 – Interest accrues on the funded amount

    After the position is created, interest begins to accrue on the funded amount in accordance with the broker’s policy. This interest continues to accumulate as long as the MTF position remains open.

    Example: If the broker has funded ₹80,000, interest will be calculated only on that ₹80,000, not on the total trade value.

    Step 4 – Interest stops when the position is closed

    When you sell your MTF position and repay the amount funded by the broker, the accrual of interest on that position ceases.

    Read Also: What is Margin Funding?

    Margin Trading Interest Formula 

    To calculate MTF interest, you need only three things: the amount funded by the broker, the annual interest rate, and the holding period. With these three details, you can easily calculate your estimated interest.

    Margin Trading Interest Formula

    Interest = (Funded Amount × Annual Interest Rate × Holding Days) ÷ 365

    Or

    Daily Interest = (Funded Amount × Annual Interest Rate) ÷ 365

    Terms used in the formula

    TermMeaning
    Funded AmountAmount funded by the broker
    Annual Interest RateAnnual MTF interest rate decided by the broker
    Holding DaysFor the duration the MTF position remained open
    Daily InterestOne day’s interest

    Margin Trading Interest Calculation 

    Suppose you used Pocketful’s Margin Trading Facility (MTF). Pocketful currently offers an MTF interest rate of 5.99% per annum (approximately 0.0164% per day).

    Assume:

    • Funded Amount: ₹1,00,000
    • Interest Rate: 5.99% per annum
    • Daily Interest Rate: 0.0164%
    • Holding Period: 10 days

    Step 1: Interest for one day

    ₹1,00,000 × 0.0164% = ₹16.40 per day

    Step 2: Total interest for 10 days

    ₹16.40 × 10 = ₹164

    If you held a funded amount of ₹1,00,000 in MTF via Pocketful for 10 days, you would incur margin trading interest of approximately ₹164. This amount covers only the interest; brokerage, GST, and other applicable charges may be added separately.

    What Other Charges Increase Your Overall MTF Cost? 

    Margin trading interest isn’t the only cost you face with a Margin Trading Facility (MTF). Other charges may also apply when placing a trade.

    Charge Why does it seem so?
    Interest ChargesInterest is charged on the amount funded by the broker.
    BrokerageBrokerage charges apply to orders for buying and selling shares.
    GSTGST is levied on brokerage, interest, and other applicable services.
    Exchange Transaction ChargesFees charged by the stock exchange (NSE/BSE).
    Stamp DutyStamp duty is applicable in accordance with state government regulations when purchasing shares.
    SEBI Turnover FeesFees prescribed by SEBI on trade turnover.
    DP ChargesA Depository Participant (DP) charge may apply when selling delivery shares.
    Pledge/Unpledge ChargesThis fee may apply if pledging or unpledging shares is required as part of the broker’s MTF process.

    Factors That Affect Margin Trading Interest Rates 

    MTF interest is not the same for every trade. It depends on certain key factors; understanding them allows you to better estimate the total cost of your trade.

    • MTF Interest Rate: Each broker sets its own MTF interest rate. Therefore, it is always beneficial to compare interest rates before initiating a trade.
    • Funded Amount: The interest payable increases in proportion to the amount funded by the broker. Hence, it is advisable to utilize margin only as needed.
    • Holding Duration: The longer an MTF position remains open, the longer the interest accrues. A shorter holding period helps keep interest costs low.
    • Broker’s Charges: In addition to interest, brokers levy brokerage fees and other charges. Therefore, rather than making a decision based solely on a low interest rate, you should consider the total cost.
    • Eligible MTF Stocks: Not all stocks are available for MTF. Funding and associated rules are based on the broker’s list of eligible MTF stocks, which can also impact your trading costs.

    What should you look for when comparing margin trading interest rates?

    Compare Why is it necessary?
    MTF Interest RateLower interest rates can reduce the total cost of holding.
    MTF Stock ListFirst, check whether the stocks you wish to trade are available for MTF.
    Maximum Funding LimitDifferent brokers offer varying funding limits, which can affect your purchasing power.
    Trading PlatformThe fast and easy platform helps manage orders.
    Overall PricingMake sure to also check the brokerage and other applicable charges, in addition to the interest, so that you can get an accurate estimate of the total cost.

    Margin Trading Interest Calculation: Pocketful vs Other Brokers 

    Even with the same funded amount and holding period, interest costs can vary due to different MTF interest rates.

    Example Assume:

    • Funded Amount: ₹1,00,000
    • Holding Period: 30 days
    • Pocketful MTF Interest Rate: 5.99% p.a. (approx. 0.0164% per day)
    • Other Broker Interest Rate (Example): 12% p.a. (approx. 0.0329% per day)
    Particular Other Broker (12% p.a.)Pocketful (5.99% p.a.)
    Funded Amount₹1,00,000₹1,00,000
    Holding Period30 Days30 Days
    Daily Interest₹32.88₹16.40
    Total Interest for 30 Days₹986.30₹492.00
    Estimated Difference₹494.30 less

    Read Also: MTF Strategy for Beginners in India

    Conclusion

    Before using MTF, you should consider not only the potential profits but also the interest costs. Having a clear understanding of how to calculate margin trading interest rates allows you to estimate the total cost of the trade in advance. This facilitates better decision-making and helps avoid unnecessary interest expenses. 

    S.NO.Check Out These Interesting Posts You Might Enjoy!
    1Margin Against Shares: How Does it Work?
    2Margin Pledge: Meaning, Risks, And Benefits
    3What is Intraday Margin Trading?
    4Is Margin Trading Facility (MTF) Safe in India?

    Frequently Asked Questions (FAQs)

    1. How is margin trading interest calculated?

      Based on the funded amount, interest rate, and holding period.

    2. Is interest charged on the total trade value?

      No, mtf charges are only on the funded amount.

    3. Is MTF interest charged daily?

      Yes, mtf is usually daily.

    4. What affects margin trading interest?

      Interest rate, funded amount, and holding period.

    5. Can I reduce MTF interest costs?

      Yes, by holding positions for a shorter period of time.

  • What Is Position Sizing?

    What Is Position Sizing?

    Most new traders spend all their energy picking the “right” stock or the “right” setup. Entry point, chart pattern, indicator confirmation and hours go into all of that. And then, almost as an afterthought, they decide how much money to put into the trade. Usually it is whatever feels right in the moment, or worse, whatever their available margin allows.

    You can have a fantastic strategy with a 70% win rate and still blow up your account if you size your trades badly. On the flip side, a simple strategy with disciplined position sizing can keep you in the game long enough to gain in a trade. 

    This is the part of trading that does not get talked about enough, so let us decode this.

    What is Position Sizing 

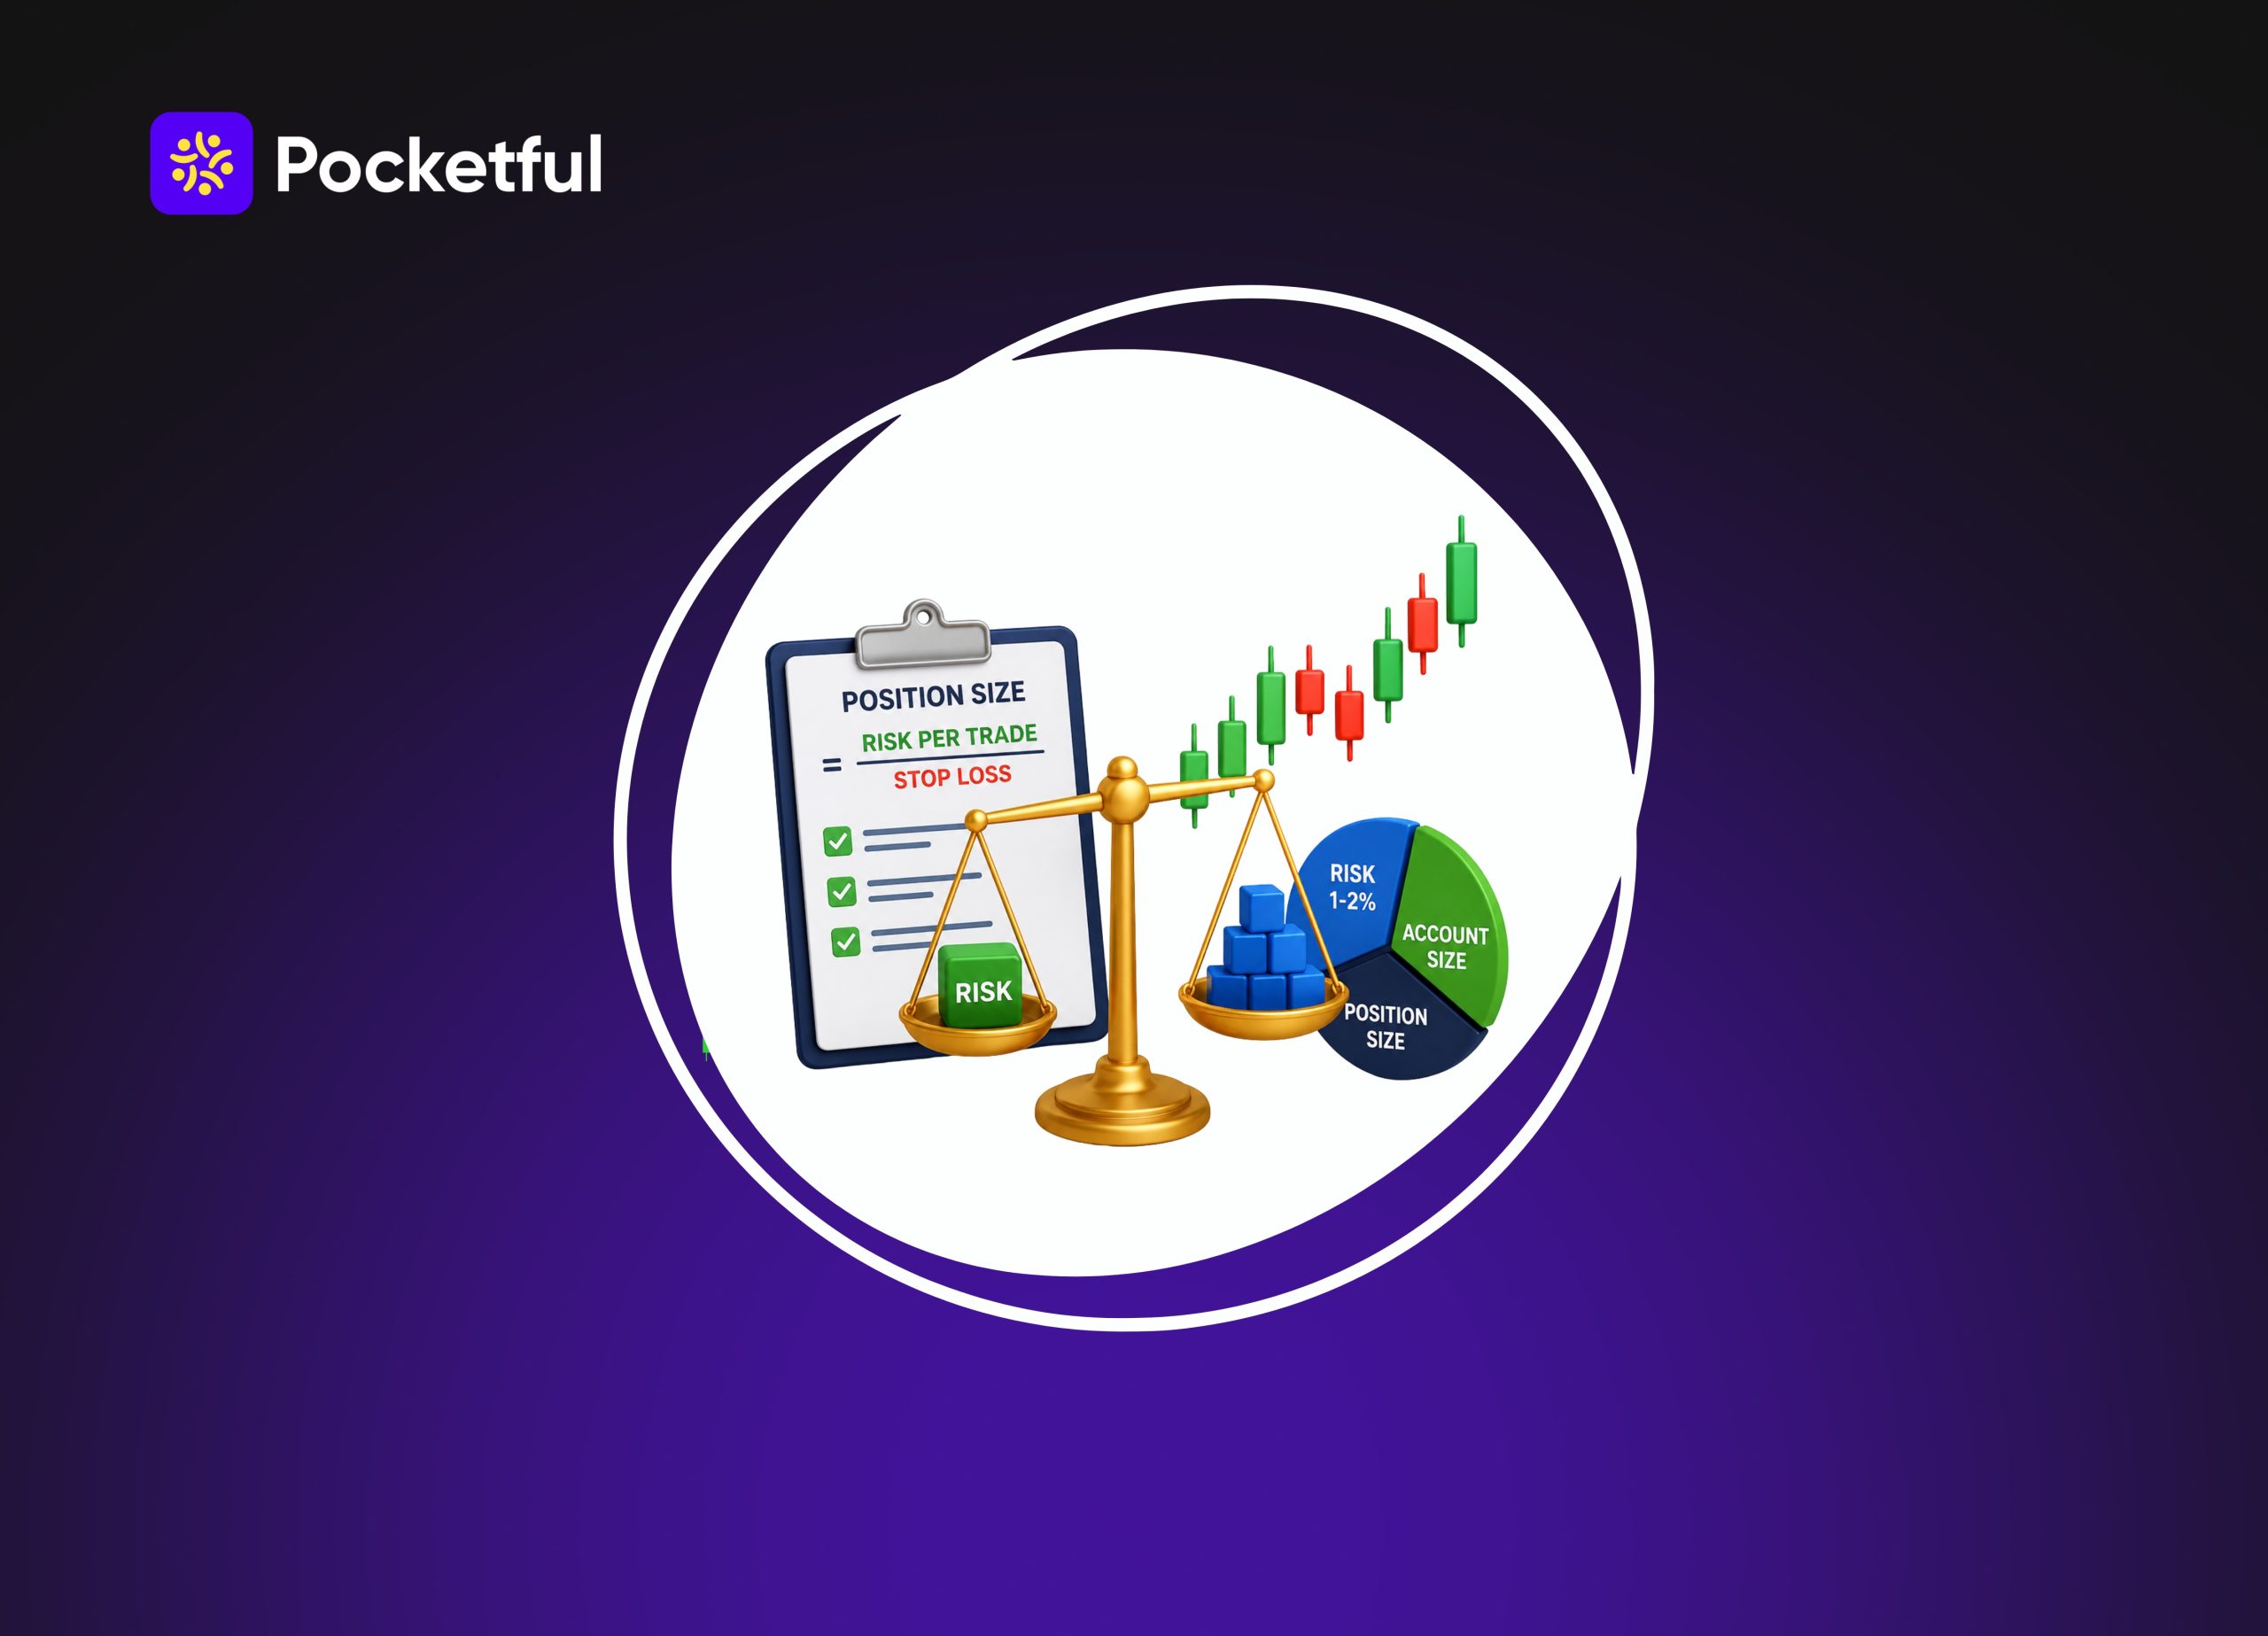
    It is deciding how many shares, lots, or contracts to buy or sell in a single trade, based on your account size and how much you are willing to lose if the trade goes wrong.

    It is not about how much you want to make, it is about how much you can afford to lose.

    Example: 

    Think of it this way: 

    If you have ₹5 lakh in your trading account and you put ₹4 lakh into one stock, a 10% drop wipes out 8% of your entire capital in one shot. In this scenario, good position sizing keeps any single trade from being able to hurt you badly. 

    Formulas are fine on paper, but they click properly only when you understand them through a real scenario.

    Suppose your trading account has ₹3,00,000 in it, and you have decided, like most sensible traders do, that no single trade should risk more than 1.5% of that capital. 

    You did the math, and that is ₹4,500. This is your ceiling. Whatever happens, you are not comfortable losing more than this on one trade.

    Let us say there is a stock at ₹850, and your stop-loss, based on support levels or whatever your chart is telling you, comes to ₹820. 

    That is a ₹30 gap between your entry and your exit if things go wrong.

    Now just divide: ₹4,500 / ₹30 = 150 shares.

    This is your position size. If the trade fails and hits your stop loss, you are out ₹4,500

    Here is where most beginners go wrong, though. They look at ₹850 and think “I can afford 300 of these,” and just buy that many because their capital allows it. 

    Sounds harmless, right? Except now their real risk on the same stop-loss has jumped to ₹9,000, which is 3% of their account. This is exactly how disciplined-looking trading plans fall apart 

    Methods of Position Sizing 

    1. Fixed Rupee Amount

    You decide to put, say, ₹20,000 into every trade regardless of the stock. But it does not account for how volatile the stock is. A ₹20,000 position in a range-bound FMCG stock carries very different risk than the same amount in a small-cap that swings 5% a day.

    2. Percentage of Capital 

    Here you risk a fixed percentage of your total account on every trade, say 2%. As your account grows, your position sizes naturally grow with it, and if you hit a rough patch, the % is reduced too. 

    3. Risk-per-Trade 

    This is probably the most practical method for active traders. You first decide how much rupee amount you are willing to lose on a trade, then work backwards from your stop-loss to figure out how many shares that translates to.

    Say you have ₹5,00,000 in capital, you are willing to risk 1% per trade (₹5,000), and you are buying a stock at ₹500 with a stop-loss at ₹480. 

    Your risk per share is ₹20. Divide ₹5,000 by ₹20, and you get 250 shares. That is your position size.

    Read Also: Partially Filled in Trading

    Common Mistakes to Avoid 

    • Over-leveraging: Using more capital or margin than your account can absorb turns normal market moves into loss-making events. If the trade goes against you and your margin shrinks, you are looking at a margin call, and if you cannot meet it, the broker liquidates your position for you, often at the worst possible price.
    • Skipping stop-losses: Position sizing calculations are only meaningful if you respect the stop-loss you create around them. So many traders size their position correctly, then move or ignore the stop-loss when the trade starts going wrong, turning a small planned loss into a much bigger unplanned one.
    • Increasing size after a loss: That overwhelming feeling to “win it back” after a loss is another classic trap. Commonly called revenge trading. It feels logical in the moment but almost always leads to bigger losses, because you are now making decisions from a place of emotion rather than a plan.

    A Simple Rule of Position Sizing 

    Most experienced traders settle on risking somewhere between 1-2% of their capital per trade. 

    Some use a 3-5-7 structure, which means capping any single trade at 3%, total exposure across all open trades at 5%, and aiming for winning trades to be at least 7% bigger than losing ones on average. 

    None of these numbers is magic, but having some consistent rule beats getting confused every single time.

    Conclusion 

    Nobody brags about their risk-per-trade calculation the way they brag about a winning trade. But it is the difference between traders who survive long enough to get good at this and those who do not. Get your entries and exits reasonably right, size your positions rationally, and the rest of trading gets a lot less stressful.

    S.NO.Check Out These Interesting Posts You Might Enjoy!
    1What is the Best Time Frame for Swing Trading?
    2MCX Trading: What is it? MCX Meaning, Features & More
    3Silver Futures Trading – Meaning, Benefits and Risks
    4What is Crude Oil Trading and How Does it Work?
    5What is Spread Trading?
    6What is Tick Trading? Meaning & How Does it Work?
    7What is Algo Trading?
    8What Is Day Trading and How to Start With It?
    9What is Pyramid Trading?
    10What is Futures and Options Trading in India

    Frequently Asked Questions (FAQs)

    1. How much should I risk per trade? 

      Most traders stick to somewhere between 1-2% of their total capital per trade. 

    2. What is the formula for calculating position size? 

      Position Size = (Account Size * Risk %per trade) / (Entry Price – Stop-Loss Price)

    3. Does position sizing work the same way in F&O as in stocks?

      No. Leverage and lot sizes add another layer; the risk per lot in futures or options can be much higher, so sizing needs extra care there.

    4. What happens if I ignore stop-losses after sizing my position correctly? 

      The whole point of position sizing gets undone. If you move or skip your stop-loss mid-trade, a small planned loss can turn into a much bigger unplanned one.

    5. What is ATR and why does it matter for position sizing? 

      ATR, or Average True Range, tells you how much a stock usually moves in a day. Using it to set your stop-loss means volatile stocks automatically get smaller positions and stocks with lesser swings get slightly bigger ones, thus keeping your risk consistent.

  • What Is Net Worth? Meaning, Formula & How to Calculate It

    What Is Net Worth? Meaning, Formula & How to Calculate It

    Financial planning starts with understanding one simple concept. It is the exact difference between what individuals own and what they owe. This financial indicator is extremely important because it reveals true financial health. Earning a high salary does not guarantee wealth if monthly expenses remain very high.Knowing this exact figure helps in financial planning by setting clear baselines. It gives people a realistic starting point to plan for a secure future. It also makes saving and investing much more focused and effective.

    What Is Net Worth?

    Net worth is the total value of all assets minus the total value of all liabilities. This simple calculation provides a transparent look into financial stability.

    Net Worth is the true wealth an individual or entity holds at a given time. For individuals, it means personal savings and property minus personal loans. For businesses, this is often called shareholders equity or book value.

    A positive number reflects excellent financial health and proper money management. A negative number shows that debts are currently higher than owned assets.

    This metric is highly useful because it measures financial stability over the long term. It helps track wealth over time by showing actual progress year by year. Tracking this number ensures that individuals are actually moving forward financially.

    It is also extremely useful for retirement planning. It shows exactly how much money is available to support a person after they stop working. Finally, this figure is important while applying for loans and investments. Banks always check this financial stability before approving large loans.

    Net Worth Formula

    The math behind finding this number is very straightforward and easy to apply. The standard Net Worth Formula is simply Total Assets minus Total Liabilities. Anyone can use this calculation to find their true financial position.

    To understand what is net worth in real life, consider a simple example of an Indian investor. Imagine a person has various investments and properties, but also has some pending loans.

    Net Worth = Total Assets – Total Liabilities

    Here is a breakdown of how the formula works using a simple table.

    Item CategoryItem NameValue (Rs.)
    AssetsResidential Flat50,00,000
    AssetsMutual Funds10,00,000
    Total Assets60,00,000
    LiabilitiesHome Loan30,00,000
    LiabilitiesCar Loan5,00,000
    Total Liabilities35,00,000
    Final ResultTotal Assets minus Total Liabilities25,00,000

    In this example, subtracting Rs. 35 Lakhs from Rs. 60 Lakhs gives a positive balance of Rs. 25 Lakhs. This final number represents the true wealth of the investor.

    Read Also: Formulas used to Calculate Profit and Loss in Nifty Options

    How to Calculate Net Worth

    Finding the exact net worth meaning for a personal portfolio requires a simple step by step process. Following these steps ensures that no important financial details are missed.

    Step 1: List All Your Assets

    Begin by writing down the current value of everything owned. This step requires gathering bank statements and investment proofs.

    • Cash and Bank Balance: This includes physical cash kept at home for emergencies. It also covers money sitting in savings accounts or current accounts.
    • Investments: Add up the current value of all fixed deposits and mutual funds. Direct equity stocks and bonds must also be included here.
    • Real Estate: Include the current market price of any residential house. Commercial shops or empty plots of land should also be added.
    • Vehicles: Write down the resale value of cars and two wheelers. Do not use the original purchase price for this calculation.
    • Retirement Accounts: Include the Employee Provident Fund and Public Provident Fund balances. The National Pension System balance is also a major asset for many.
    • Valuable Personal Assets: Add the value of physical gold and expensive jewellery. Rare art or other high value collectibles can also be listed.

    Step 2: List All Your Liabilities

    Next, write down every single debt that needs to be paid back. This includes both large bank loans and small personal borrowings.

    • Home Loan: Note down the pending principal amount of the house loan. Do not include the future interest payments.
    • Personal Loan: Include any unsecured loan taken for personal use or emergencies. These usually carry high interest rates and reduce wealth quickly.
    • Car Loan: Add the remaining balance on any vehicle loans. This is a common liability for young professionals.
    • Education Loan: Write down the money borrowed for higher studies. This is often the first major liability for many people.
    • Credit Card Outstanding: Include all unpaid credit card bills, even if they seem very small. Ignoring these can severely damage financial health.
    • Other Debts: Add any money borrowed from friends, relatives, or local lenders. Every single financial obligation must be captured.

    Step 3: Subtract Liabilities from Assets

    Take the total value from the first list and subtract the total from the second list. The final result gives a perfectly clear financial picture.

    What Are Assets?

    Assets are valuable items that individuals own and can convert into cash if needed. Proper classification helps in understanding financial liquidity.

    • Liquid Assets: These are funds that can be accessed immediately without any delay. Savings account balances and cash in hand fall into this group.
    • Financial Assets: These represent secure financial instruments used for saving money. Bank fixed deposits, corporate bonds, and government securities are excellent examples.
    • Physical Assets: These are tangible items that hold intrinsic value and can be touched. Real estate property, vehicles, and physical gold are the most common physical assets in India.
    • Investment Assets: These are purchased specifically to grow wealth over time through capital appreciation. Equity shares, mutual funds, and exchange traded funds belong in this category.

    What Are Liabilities?

    Liabilities represent the financial obligations or debts owed to banks or other people. They act as a drain on wealth because they usually require regular interest payments.

    Common Types of Liabilities include secured loans like home loans and car loans. These loans are backed by physical collateral, making them slightly cheaper.

    They also include unsecured loans like personal loans and credit card debts. Unsecured loans do not require collateral but often carry much higher interest rates. Short term bills and long term mortgages all fall under this broader category.

    Factors That Affect Your Net Worth

    Several internal and external factors influence financial health on a daily basis. Understanding these variables helps investors in making good decisions for their money in the long run.

    • Income Growth: With expanding business and rise in salary a person has more cash flow. With this extra cash a person can invest in assets or clear their debts easily.
    • Investment Performance: The stock market and real estate prices fluctuate every second. Good returns on mutual funds or property will naturally increase overall wealth.
    • Debt Level: Taking on new loans decreases financial standing immediately. Paying off high interest loans quickly has a massive positive impact on overall wealth.
    • Inflation: With rising inflation the price of day to day product rises which certainly reduces the purchasing power of the saved money. If the invested amount does not beat the rising inflation, wealth slowly decreases with time. 
    • Spending Habits: If a person spends money carefully on a day to day basis, there is more cash available for investment. If the money is spent on depreciating assets it destroys the wealth over time.
    • Major Asset Appreciation: Asserts such as land and gold increase in value with time. When these major assets appreciate, they significantly boost overall financial figures.

    Read Also: What is Capital Gains Tax in India?

    Common Mistakes While Calculating Net Worth

    Generally investors sometimes make mathematical or logical errors which can distort the exact financial output. You can avoid these mistakes by learning the following steps as it can give you an accurate assessment of your wealth.

    • Overestimating Asset Values: Many individuals guess the value of their property incorrectly based on emotions. One should use conservative and realistic market estimating techniques rather than just guessing. 
    • Ignoring Small Debts: Credit card payments or small loans can sometimes be forgotten. This could lead to false estimation of wealth. 
    • Forgetting Retirement Investments: Employees often ignore their Employee Provident Fund or Public Provident Fund balances. These accounts hold significant wealth and must always be included.
    • Using Purchase Price Instead of Current Market Value: A car bought for Rs. 10 Lakhs last year is not worth the same amount today. Assets should always be recorded at their current resale price.
    • Not Updating Calculations Regularly: Financial situations change every single month due to market movements and salary credits. Failing to track these numbers at least once a year makes the data useless for planning.

    Benefits of Tracking Your Net Worth

    Regular watch on the financial progress gives multiple advantages and it ultimately helps in building wealth over time.  

    • Better budgeting: Knowing the final wealth number helps in allocating funds at the right place and reducing unwanted expenses. 
    • Improved investment planning: A clear view of all assets shows where money is heavily concentrated. By this you can diversify your investments across multiple areas. 
    • Easier retirement planning: Tracking wealth makes sure that you are removing in the right direction to achieve your targets. It shows exactly how much more capital needs to be accumulated for a comfortable future.
    • Better debt management: Seeing the total debt figure in one place can be a strong wake up call. It motivates individuals to clear expensive loans much faster.
    • Goal tracking: By tracking your goals you know exactly how much more is required for your financial objectives. 
    • Financial confidence: Seeing wealth grow year after year reduces money related stress as you get a sense of security and control regarding the future.

    Conclusion

    Building wealth is a time taking procedure that happens during a period of time but most importantly you require patience and discipline for this. Every small step towards reducing debt and increasing investments makes a significant difference over time. Maintaining a clear view of financial health allows individuals to make smarter choices for a secure tomorrow.

    For more market news and insights, download Pocketful offering users zero brokerage on delivery trades and an easy to use platform designed for both beginners and experienced investors.

    S.NO.Check Out These Interesting Posts You Might Enjoy!
    1What is the Best Time Frame for Swing Trading?
    2MCX Trading: What is it? MCX Meaning, Features & More
    3Silver Futures Trading – Meaning, Benefits and Risks
    4What is Crude Oil Trading and How Does it Work?
    5What Is Day Trading and How to Start With It?

    Frequently Asked Questions (FAQs)

    1. What is the simple meaning of net worth? 

      It is the total value that a person has after subtracting the debt or liabilities. This tells us the clear picture of an individual or business at a certain point of time.

    2. Can this number be negative? 

      Yes, it can be negative if a person has more debts than assets. This usually happens early in a career due to education loans or large home loans.

    3. How often should someone calculate this figure? 

      One should definitely calculate and review this thing at least once in a financial year. People also check it quarterly to track their financial goals. 

    4. If a person has a high salary does it mean high wealth? 

      Generally high salary does not mean high wealth, if someone with a high salary spends all their money and saves nothing, wealth will be zero. Wealth means what is kept and not what is earned. 

    5. Should vehicles be included in assets?

      Yes, automobiles such as cars and bikes are included in assets but only the vehicle’s current resale value is considered. Vehicles are depreciating assets, meaning their value decreases over time.

  • What is VPA in UPI? Meaning, Full Form & How It Works

    What is VPA in UPI? Meaning, Full Form & How It Works

    Paying via UPI is second nature to us by now, but honestly, how many of us actually know what a vpa in upi stands for? That’s exactly why people keep searching for what a vpa id means, what upi vpa means, or asking: is vpa and upi id same? If you want a straight, no-nonsense guide on vpa for upi, this article breaks down everything what it is, how it works, and how to set yours up easily.

    What is VPA in UPI? 

    A VPA (Virtual Payment Address) is a unique payment address used to send and receive money via UPI. It is linked to your bank account and serves as a convenient alternative to the account number and IFSC code; consequently, you do not need to share your bank details during UPI payments.

    Simply put, a VPA ID is a digital address used to facilitate UPI transactions. A VPA for UPI is generated for you when you link your bank account to a UPI app.

    Every VPA (Virtual Payment Address) consists of two main parts. Once you understand this, it becomes easy to identify any UPI ID.

    Understanding the Structure of a VPA 

    Example Suppose your VPA is: abc123@bankname 

    Part of VPAWhat does it mean
    abc123This is the username. In some apps, you can choose it yourself, whereas many apps generate it automatically.
    It serves to separate the username and the UPI handle.
    banknameThis is the UPI handle, which identifies the bank or UPI service provider (PSP).

    If someone needs to send you ₹1,000, they simply need to enter this VPA  they do not need to know your bank account number or IFSC code. Before making the payment, the UPI app also displays your identity (name), thereby reducing the risk of sending money to the wrong person.

    Difference between VPA and bank details

    Bank DetailsVPA 
    The account number and IFSC code are required.Only the VPA is required.
    Long pieces of information have to be shared.It is short and easy to remember.
    Bank details come to light.Bank details remain private.

    How to Create Your Virtual Payment Address 

    Setting up your VPA is incredibly easy. While the screens might look a bit different depending on the app you choose, the basic steps are exactly the same everywhere.

    • Download a UPI app: First, grab any trusted app like PhonePe, Google Pay, Paytm, BHIM, or your bank’s official app. Just ensure you use the phone number linked to your bank account.
    • Verify your mobile number: Open the app and select your number. It will send a quick automated SMS to verify your device. You can move forward only after this check is complete.
    • Link your bank: Tap on “Add Bank Account” and choose your bank. If your number matches, the app automatically finds your account. Just select it to finish.
    • Create a VPA (UPI ID): Once the bank account is linked, a VPA is generated for you. Many apps create this automatically, while others offer the option to choose a VPA of your preference.
    • Set a UPI PIN: Next, you need to create a UPI PIN. Most banks require debit card details for this. However, many banks now also allow you to set or reset your UPI PIN using an Aadhaar-based OTP. Since this feature is not available with all banks, the options available to you will depend on your specific bank and UPI app.
    • VPA is ready for use: Once the UPI PIN is set, your VPA becomes fully active. You can now use this VPA to send and receive money, as well as make payments by scanning QR codes.

    Read Also: NEFT vs RTGS vs UPI vs IMPS: A Comparative Study

    How Does VPA Work in UPI? 

    Whenever you send money to a VPA, UPI uses that VPA to route the funds to the correct bank account. The entire process is completed in just a few seconds.

    • It starts with entering the VPA: To send money, you first enter the recipient’s VPA or scan their QR code. This VPA tells UPI which bank account should receive the funds.
    • Verify by checking the name: After entering the VPA, the name associated with that account appears on the screen. You should proceed only if the name is correct; this significantly reduces the risk of sending money to the wrong person.
    • The UPI PIN authorizes the transfer: Next, enter the amount you wish to send and input your UPI PIN. Once the correct PIN is entered, the bank approves the transaction, and the payment process begins.
    • Money is transferred in seconds: Upon a successful payment, the funds are credited directly to the recipient’s bank account. Additionally, both the sender and the recipient receive a transaction confirmation.

    Is VPA and UPI ID Same? 

    Yes, VPA is just the full form, which stands for Virtual Payment Address. It is the technical word for your UPI ID. Most apps like Google Pay or PhonePe show it as “UPI ID” on their screens simply because that sounds easier to understand. But at the end of the day, both mean the exact same address used to transfer money. 

    Why is VPA Important in UPI Transactions? 

    VPAs make UPI payments easier because there is no need to share full bank details for every transaction.

    • No need to memorize bank details: Previously, sending money online required entering an account number and IFSC code. With the introduction of VPAs, payments can be made using just a UPI ID, making the process significantly simpler than before.
    • Reduced risk of entering incorrect information: There is a possibility of making errors when typing long account numbers or IFSC codes. Since a VPA is short and simple, the likelihood of such mistakes during payment is minimized.
    • Works across different UPI apps: A VPA isn’t locked to just one platform. Even if the recipient uses a totally different UPI app, money can easily be sent to their VPA as long as their bank account is linked to UPI.
    • Name verification before payment: When typing a VPA, most UPI apps show the bank account holder’s real name before you pay. This makes it super easy to check the right person, reducing any risk of wrong transfers.

    Where Can You Find Your Existing VPA? 

    If you do not remember your VPA (UPI ID), you can easily view it in the UPI app’s profile or bank account settings. Its location may vary slightly across different apps.

    UPI appWhere can I view my VPA (UPI ID)?
    Google PayProfile → Bank Account → Manage UPI IDs
    PhonePeProfile → Bank Accounts → Select your bank account → UPI ID
    PaytmProfile → UPI & Payment Settings → Manage UPI IDs
    BHIMProfile → Bank Account → UPI ID / VPA
    Bank’s UPI appLook for the UPI ID / VPA option in the UPI or Bank Account section.

    Can You Have More Than One VPA? 

    Yes, it is possible to have more than one VPA (UPI ID) linked to a single bank account. However, this feature depends on your bank and the UPI app being used.

    Examples:

    • abc@bankname
    • abc.pay@bankname
    • abc123@provider

    All these VPAs can be linked to the same bank account. This makes it easy to manage different activities such as personal and business payments using separate VPAs.

    Read Also: How to Register a UPI Complaint?

    Benefits of Using VPA for UPI Payments 

    Using a VPA makes UPI payments not only easier but also more convenient.

    • No need to share bank details: To receive money using a VPA, you only need to share your UPI ID. This eliminates the need to disclose your account number and IFSC code.
    • Payments become easier: Instead of entering lengthy bank details, you can make a payment in seconds simply by entering the VPA. This simplifies the entire process.
    • Enhanced privacy: When you share your VPA, your banking information is not revealed. This keeps your personal bank details secure.
    • Works across different UPI apps: A VPA is not limited to a single app. You can easily send money to someone’s VPA even if they are using a different UPI app.
    • 24/7 payment facility: Money can be sent or received at any time using a VPA; there is no need to wait for banking hours.
    • Easy to remember: In most cases, a VPA is shorter and easier to remember than a bank account number, making repeated payments more convenient.

    VPA Safety Tips How to Keep Your Money Safe

    Look, using a VPA is super safe, but honestly, it just takes one tiny mistake to lose your money. Fraudsters are getting smart, so you need to be smarter. Here is what you should always keep in mind before hitting that pay button.

    • Keep your UPI PIN a secret: Your PIN is the lock to your bank account. Never share it with anyone period. No bank officer, support agent, or customer care person will ever call you asking for it. If they do, they’re lying.
    • Spot the name before you send: The best thing about VPAs is that when you type one in, the app automatically shows the real name of the person. Look at that name carefully. If it looks fishy or doesn’t match who you’re paying, stop and check the VPA again.
    • A big rule: You don’t need a PIN to get paid: This is the most common trap people fall into. If someone tells you to enter your UPI PIN or scan a QR code to receive money from them, they are trying to rob you. PINs are only for sending money.
    • Don’t hurry with unknown VPAs: Sending money to a random account you don’t know? Double-check first. Once that transaction goes through and the money leaves your account, getting it back is a huge headache.
    • Don’t ignore app updates: I know those update notifications are annoying, but please don’t skip them. Those updates fix security bugs and add new fraud detection layers that keep hackers away.
    • See something wrong? Scream immediately: If you notice even a single rupee moving out of your account without your permission, don’t wait around. Block your account and report it to both your bank and the UPI app support team right away.

    Read Also: Best UPI Apps in India

    Conclusion

    VPAs have honestly made UPI payments a whole lot simpler. Once you understand how it actually works, sending or getting money becomes second nature. Just keep your UPI PIN safe to yourself, verify who you are paying before hitting that button, and stick to trusted IDs. Do this, and your digital transactions will always stay completely safe.

    Frequently Asked Questions (FAQs)

    1. What is VPA in UPI?

      A VPA is your UPI payment ID, used to send and receive money.

    2. Are VPAs and UPI IDs the same?

      Yes, both represent the same payment address.

    3. How do I create a VPA?

      A VPA is created when you link a bank account to a UPI app.

    4. Can I change my VPA?

      Yes, some UPI apps offer this feature.

    5. Is sharing a VPA safe?

      Yes, but never share your UPI PIN.

  • What is the Nifty IT Index?

    What is the Nifty IT Index?

    If you’ve been tracking Infosys or TCS results every quarter and wondering how the broader tech sector is doing, the Nifty IT Index is the number you should be watching. Ten companies. One index. It tells you whether Indian IT is having a good run or a rough patch, without you having to check 10 different stock prices. This article breaks down what the index is, what’s inside it right now, and what actually makes it move.

    The Basics First

    The Nifty IT Index is a sectoral index of the National Stock Exchange (NSE) that tracks the performance of leading information technology companies listed on the exchange.

    It includes some of India’s largest IT and technology service companies that derive a significant portion of their revenues from software services, consulting, business process management, cloud solutions, and digital technologies. The index currently consists of 10 major companies from the Indian IT sector and is maintained by NSE Indices.

    Simply put, if India’s IT sector performs well, the Nifty IT Index generally moves higher. If the sector faces challenges such as lower global demand or slower technology spending, the index may come under pressure.

    What’s Inside the Nifty IT Index

    Ten stocks make up the entire index. All of them are software, IT services, or IT-enabled businesses listed on the NSE. Here’s the official composition as per NSE Indexogram data dated June 30, 2026:

    Infosys leads the index at 30.41%, followed by TCS at 20.48%. Together they account for over 50% of the index weight. HCL Technologies and Tech Mahindra follow at 11.16% and 10.84% respectively both significantly higher than what many investors expect.

    CompanyWeightage (%)
    Infosys Ltd.30.41
    Tata Consultancy Services Ltd.20.48
    HCL Technologies Ltd.11.16
    Tech Mahindra Ltd.10.84
    Wipro Ltd.5.94
    Persistent Systems Ltd.5.71
    Coforge Ltd.4.88
    LTIMindtree Ltd.3.99
    MphasiS Ltd.3.48
    Oracle Financial Services Software Ltd.3.12

    This concentration matters in practice. On a day when Infosys drops 4% after a weak quarterly result, the nifty IT index falls roughly 1.2% from that one stock alone, even if everything else holds flat. Understanding this helps you make sense of sharp intraday index moves without panicking.

    NSE applies weightage caps at every rebalancing; no single stock can exceed 33%, and the top three stocks combined cannot cross 62% of the total index weight. These limits prevent one company from dominating so heavily that the index stops being a sector tracker and becomes a single-stock proxy.

    Index Returns as of June 30, 2026

    This part is worth sitting with for a moment. The official NSE return data from the Indexogram report paints a clear picture of where the index stands:

    PeriodPrice Return (%)
    QTD (Quarter to Date)-9.51
    YTD (Year to Date)-30.58
    1 Year-32.48
    5 Years (CAGR)-2.05
    Since Inception (CAGR)20.03

    The 1-year return of -32.48% and YTD of -30.58% reflect the significant pressure on Indian IT stocks through 2025-26. US tech spending cuts, a stronger rupee eating into dollar-denominated revenues, and repeated earnings downgrades from majors like TCS and Infosys drove the index down sharply from its highs.

    The 5-year CAGR of -2.05% tells you the index has essentially gone nowhere on a 5-year basis. But the since-inception CAGR of 20.03% puts that in context this index has compounded at 20% annually since 1996, making it one of the strongest long-run performers among NSE’s sector indices. Short cycles of underperformance are part of that story.

    The nifty IT index also has a standard deviation of 23.57% over 1 year, which signals meaningful volatility. It has a Beta of 0.76 against Nifty 50 over 1 year and 0.95 over 5 years  meaning it moves slightly less than the broader market in short windows but tracks it closely over longer periods.

    How the Index Value Is Calculated

    The nifty information technology index uses the periodic capped free-float methodology. Here’s what that actually means.

    Free-float means only publicly tradeable shares are counted. Promoter holdings, government-locked shares, and strategic cross-holdings are excluded. So the index measures what the open market is actually pricing not the full issued share capital.

    Periodic capping means the weightage caps described earlier are applied at each rebalancing point, not continuously. Between rebalancing dates, weightages drift with price changes. At the next review, they get reset.

    The formula:

    Index Value = (Current total free-float market cap of all 10 stocks ÷ Base market capitalisation) × Base Value

    As the 10 stocks trade throughout the day, their combined free-float market cap changes every second. The index divides that by the fixed base market cap and multiplies by the base value to give you the live index level.

    Corporate actions, bonus issues, stock splits, rights offerings are adjusted for so they don’t create artificial jumps or drops in the index level on the day they happen.

    Who Gets Into the Nifty IT Index

    Not every IT company listed on the NSE qualifies. The selection criteria from NSE’s official methodology:

    • The company must be part of the Nifty 500 at the time of review. If eligible IT stocks within Nifty 500 fall below 10, NSE can pull from the top 800 universe ranked by average daily turnover and market capitalisation over the previous 6 months.
    • The company must be classified under the IT sector as per NSE’s industry classification.
    • Trading frequency must be at least 90% in the last six months — meaning the stock should have traded on at least 9 out of 10 trading days.
    • Minimum listing history of 1 month as on the cutoff date.
    • Final selection of 10 companies is based on free-float market capitalisation. Preference is given to companies already available in NSE’s Futures & Options segment.

    The rebalancing cut-off dates are January 31 and July 31 each year. NSE uses average data from the six months ending on those dates. Four weeks’ prior notice is given to the market before any constituent change takes effect so there’s no surprise on the change date.

    A three-tier governance structure manages the index, the Board of Directors of NSE Indices Limited, the Index Advisory Committee (Equity), and the Index Maintenance Sub-Committee. Changes don’t happen arbitrarily; they go through this framework.

    Index Fundamentals (June 30, 2026)

    MetricValue
    P/E Ratio17.26
    P/B Ratio4.72
    Dividend Yield3.48%

    A P/E of 17.26 is notably lower than where Indian IT stocks were trading in 2021–22 when many names were at 30–40x earnings. The correction has brought valuations back to more reasonable territory. A dividend yield of 3.48% is relatively high for an equity index, reflecting that the sharp price fall has pushed yields up. These numbers matter when deciding whether the current level represents fair value or whether there’s more downside risk.

    What Actually Moves This Index

    1. The Dollar-Rupee Exchange Rate

    India’s big IT firms, Infosys, TCS, HCL, and Wipro, earn the bulk of their revenue in US dollars from North American and European clients. Every dollar they earn gets converted to rupees when reported in Indian accounts. A weaker rupee means more rupees per dollar, so earnings look better even if business volume hasn’t changed. When the rupee strengthens, the same dollar revenue shrinks in rupee terms. Currency movement is a variable that directly feeds into margins, and the Nifty Technology Index reflects it.

    2. US and European Tech Spending

    This is the primary driver. Indian IT is a service export industry. When US companies tighten budgets, IT is among the first spending categories cut or deferred. The 2022–23 slowdown showed this clearly: rising US inflation pushed the Fed to hike aggressively, enterprises pulled back on outsourcing and digital transformation spend, and Indian IT companies reported slower deal wins for six consecutive quarters. The it index followed all the way down.

    3. RBI and Fed Rate Cycles

    Rate decisions on both sides affect the index. RBI rate cuts lower borrowing costs domestically and encourage technology investment. US Fed rate hikes tighten corporate budgets and reduce the appetite for outsourcing new projects. The Fed’s cycle tends to have a more direct impact, given how large North American revenues are for the top four IT companies in the index.

    4. FII Flows Into Indian IT

    Foreign institutional investors hold large positions in TCS, Infosys, and HCL. When global risk sentiment shifts, recession fears, geopolitical tension, US rate signals. FIIs reduce emerging market holdings, and Indian IT gets sold first because it’s among the most liquid. These outflows create sharp short-term index moves that don’t necessarily reflect underlying business changes.

    5. Government Spending on Technology

    Domestic revenue from government contracts, defence technology, railway IT systems, and public health digitisation has grown meaningfully for some IT companies. The Union Budget 2024-25 allocated ₹1,16,342 crore toward IT and telecom, signalling continued public sector demand. This doesn’t move the index on a single day, but it shapes the medium-term revenue visibility for companies that have strong government client exposure.

    How to Get Exposure to the Nifty IT Index

    You can’t buy the index itself. But there are several practical routes.

    Buying individual stocks is the most direct. You pick TCS, Infosys, HCL Tech, or any other constituent and hold them in your Demat account. The trade-off is that you’re making active stock calls rather than tracking the sector as a whole, and managing 10 positions individually takes more effort.

    IT sector mutual funds give you active management. A fund manager decides which technology stocks to overweight; they may hold names outside the 10-stock index basket too, so performance will diverge from the Nifty IT index. Worth it if you believe active management adds value in this sector.

    Index funds replicating the Nifty IT index hold exactly the same 10 stocks in the same proportions. No active calls. Lower expense ratios. If your view is simply “I want clean IT sector exposure,” this is the most efficient route.

    IT ETFs work like index funds but trade on the exchange during market hours at live prices rather than end-of-day NAV. Useful for investors who want to enter or exit at specific price points intraday.

    Futures and options contracts exist for the Nifty IT Index for those who want to hedge existing IT holdings or take directional leveraged positions. Not a product for long-term retail investors without derivatives experience.

    Things to Think About Before Investing

    Ten stocks in one sector. That is the entire index. There’s no cushion from other parts of the economy when IT goes through a rough period, and the current data shows what a rough period looks like. YTD returns of -30.58% with no diversification buffer are a real experience that investors in IT sector funds faced through 2025–26.

    Infosys at 30.41% and TCS at 20.48% together make up over half the index. A bad earnings quarter from either company moves the index meaningfully. That’s not sector diversification in the traditional sense; it’s concentrated exposure to two businesses.

    The P/E of 17.26 is low by historical IT standards, which could mean the sector is attractively valued after the correction. Or it could mean earnings expectations are still being revised downward. Both interpretations are valid, and which one you believe should inform whether this is a time to enter or wait.

    Currency exposure is embedded in every IT investment. You’re taking a view on rupee-dollar dynamics, whether you’re thinking about it or not.

    How to Invest in IT Sector Funds Through Pocketful

    Step 1: Create Your Account

    Download the Pocketful app and sign up.

    • Enter your mobile number and verify with OTP
    • Set your login credentials
    • Access your dashboard

    Step 2: Complete Your KYC

    The entire process is online and paperless.

    • Add PAN and Aadhaar details
    • Enter bank account information
    • Complete digital verification

    Step 3: Pick Your IT Fund

    Browse IT sector mutual funds, stocks and ETFs on the platform.

    • Compare expense ratios and rolling returns vs the Nifty Technology Index benchmark
    • Check fund portfolio overlap with the Nifty IT Index
    • Choose a direct plan for a lower cost

    Step 4: Start Investing and Track

    • Start a SIP or lump sum in your chosen IT fund
    • Track NAV movement and portfolio performance from the dashboard
    • Review against the index benchmark every 6–12 months

    Conclusion

    The Nifty IT Index has been tracking India’s technology sector since 1996, compounding at 20% annually since inception despite going through multiple severe corrections along the way. The current setup- 10 stocks, Infosys and TCS making up over half the weight, YTD returns deep in negative territory, reflects both the structural strength of Indian IT and the cyclical pressures the sector faces right now. Before investing in any fund benchmarked against the Nifty Information Technology Index, knowing the return data, the concentration, and what drives the index up and down helps you hold through the rough patches rather than exit when it hurts most.

    Start investing in IT sector mutual funds through Pocketful, with zero commission on mutual fund investing, so more of your returns stay with you.

    S.NO.Check Out These Interesting Posts You Might Enjoy!
    1What Is iNAV in ETFs?
    2How to Pledge ETFs for Margin in India
    3What are Bond ETFs?
    4What Is Nifty ETF?
    5What Is Nifty 50? How To Invest In It?

    Frequently Asked Questions (FAQs)

    1. How many stocks are in the Nifty IT Index? 

      Ten. All of them are IT sector companies listed on the NSE. The composition is reviewed in June and December each year.

    2. Can I invest directly in the Nifty IT Index? 

      No. You invest through index funds, ETFs, sector mutual funds that track or invest in the same stocks, or by buying individual constituents directly.

    3. Is this the same as Nifty 50? 

      No. Nifty 50 has 50 stocks across 13 sectors. The Nifty IT Index has 10 stocks, all from the IT sector only. They’re entirely different indices.

    4. When does the IT index get rebalanced? 

      Twice a year, in June and December. Changes take effect from the last Thursday of the review month.

  • Open Free Demat Account

    Join Pocketful Now

    You have successfully subscribed to the newsletter

    There was an error while trying to send your request. Please try again.

    Pocketful blog will use the information you provide on this form to be in touch with you and to provide updates and marketing.