Blog

  • Buying vs Selling Options: Which Is Riskier?

    Buying vs Selling Options: Which Is Riskier?

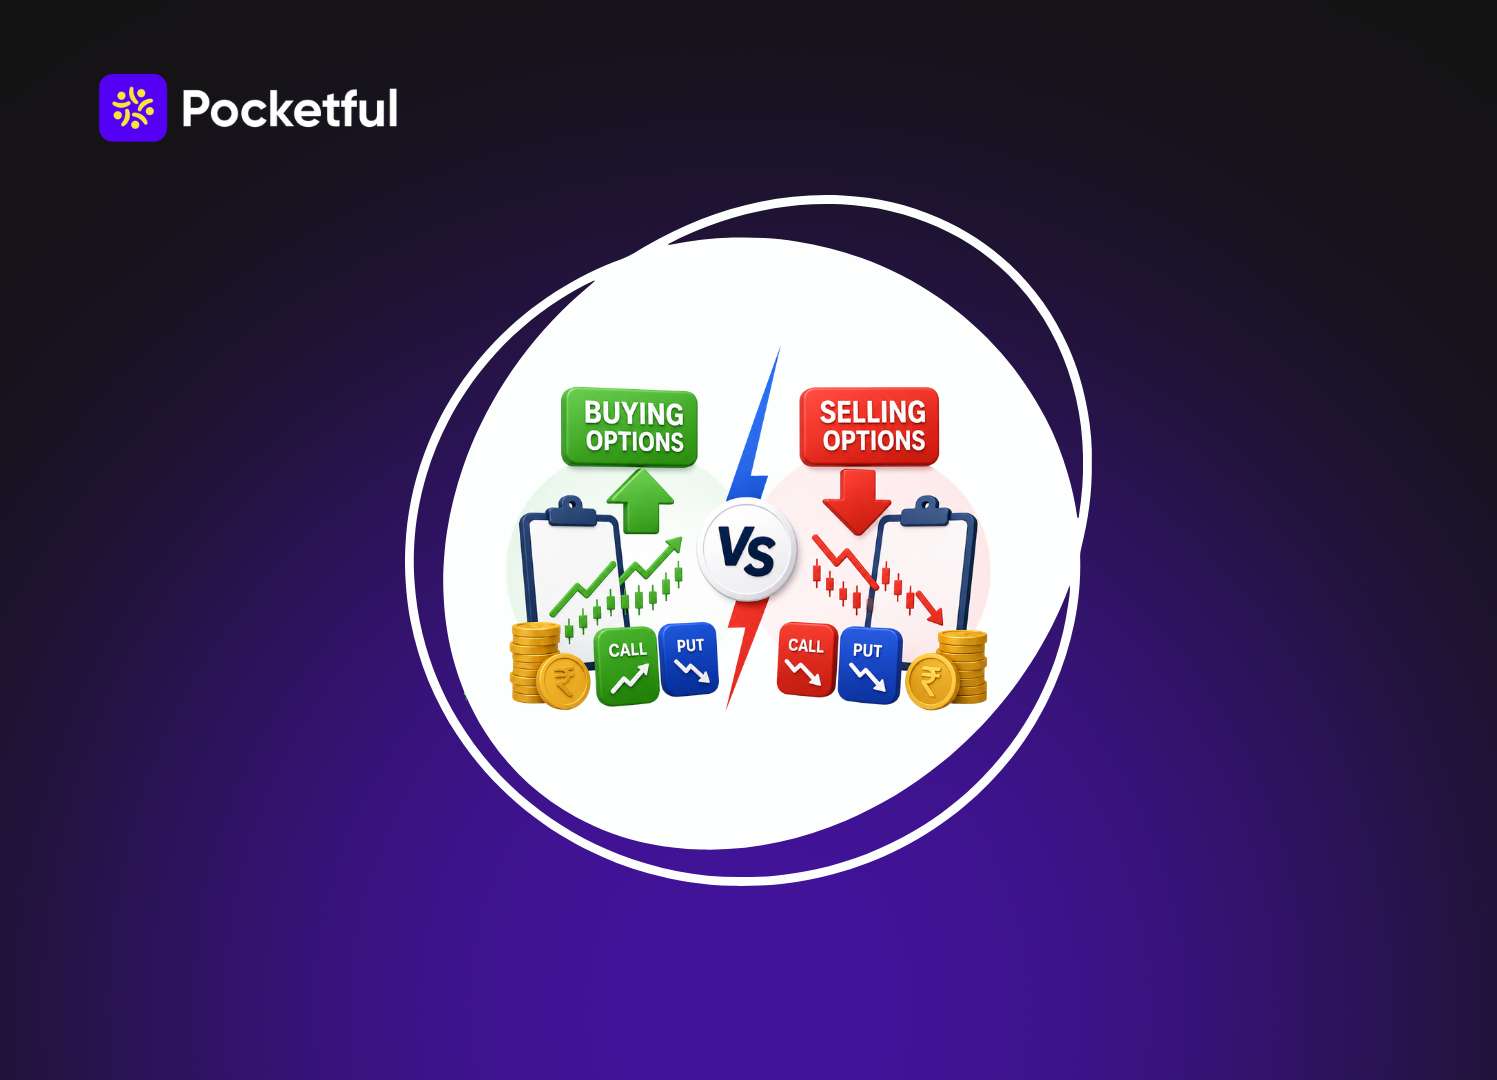
    Every trader who moves from equity into derivatives eventually runs into the same question: is option buying and selling equally risky, or not? The honest answer is that they are risky in almost opposite ways. 

    Option buying caps your loss but stacks the odds against you over time. Option selling flips that trade-off, handing you better odds of profit in exchange for a loss that can, in theory, run far beyond what you put in.

    This guide breaks down option buying vs option selling in plain terms, compares the actual numbers, and explains why option selling is costly in ways that are not obvious until a trader has already been burned by it.

    What Is Option Buying

    When you buy a call or a put, you pay a premium upfront for the right, not the obligation, to buy or sell the underlying stock or index at a fixed strike price before expiry. That premium is the maximum you can lose in the simplest terms. 

    This is what makes option buying attractive to newer traders. You know your downside before you place the trade. If Nifty falls the wrong way after you buy a call, you lose the premium and nothing else. There is no margin call, no unlimited loss, and no overnight panic about how far the market can move against you.

    The catch lies in the odds of the trade working in your favor. Options lose value every single day through time decay, a factor known as theta. A bought option is fighting the clock from the moment you buy it. 

    Even if your view on direction is correct, you can still lose money if the move happens too slowly or the option’s implied volatility falls after you buy it. Data compiled by SEBI on individual investor trading in the equity derivatives segment has repeatedly shown that a large majority of retail option buyers lose money over a financial year, precisely because time decay works against them by default.

    Example: Option Buying

    Suppose Nifty is at 25,000. You expect it to rise, so you buy a 25,100 Call Option at a premium of ₹100.

    • Lot Size: 65
    • Premium Paid: ₹100 × 65 = ₹6,500

    If the premium rises to ₹150, your profit is:

    (₹150 − ₹100) × 65 = ₹3,250

    If the market doesn’t move and the option expires worthless, your maximum loss is only the premium paid, i.e., ₹6,500.

    Simple takeaway: Option buyers can lose only the premium they pay, but the market needs to move in the expected direction before time decay reduces the option’s value.

    Profit/Loss shown is before brokerage, taxes, and other applicable charges. 

    What Is Option Selling

    Option selling, also called option writing, works the other way. You collect the premium upfront and take on the obligation to buy or sell the underlying if the option is exercised against you. Your maximum profit is capped at the premium received. Your maximum loss, in the case of an uncovered or naked position, is theoretically unlimited on a call and very large on a put.

    Time decay, the same force that hurts option buyers, works in the seller’s favor. Every day that passes without an adverse move, the option loses value, and that lost value is the seller’s profit. This is why professional traders and institutions dominate the option-selling side of the market. Probability tends to favor the seller, since most options expire worthless or below the buyer’s break-even level.

    The trade-off is capital and exposure. Option selling requires posting margin, sometimes a large amount of it, because your exchange and broker need protection against the possibility of a large adverse move. A single sharp, unexpected event, like a surprise rate decision or a geopolitical shock, can wipe out weeks or months of collected premium in one session.

    Example: Option Selling

    Suppose Nifty is trading at 25,000. You believe it will stay below 25,200, so you sell the 25,200 Call Option at a premium of ₹120.

    • Lot Size: 65
    • Premium Received: ₹120 × 65 = ₹7,800
    • Margin Required: Approximately ₹1.3 lakh (varies by broker and market conditions)

    Scenario 1: Trade Works

    The market stays below 25,200, and the option premium falls to ₹30.

    Profit = (₹120 − ₹30) × 65 = ₹5,850

    Scenario 2: Trade Goes Against You

    Nifty rallies sharply, and the option premium rises to ₹320.

    Loss = (₹320 − ₹120) × 65 = ₹13,000

    If you don’t exit and the market continues to rise, the loss can keep increasing, which is why option selling is considered a high-risk strategy despite the higher probability of earning the premium.

    Note: Profit/Loss shown is before brokerage, taxes, and other applicable charges.

    One important point: There is no single “real-life” calculation because option premiums and margin requirements change every second based on Nifty’s level, volatility (IV), and time left to expiry. The numbers above are realistic illustrations, not live market quotes.

    Buying and Selling Options: The Core Risk Difference

    The clearest way to see the difference in buying and selling options is to compare the shape of the payoff, not just the odds of winning.

    FactorOption BuyingOption Selling
    Maximum lossLimited to premium paidCan be very large or unlimited
    Maximum profitCan be large or unlimitedLimited to premium received
    Time decayWorks against youWorks in your favor
    Win probabilityGenerally lowerGenerally higher
    Capital requiredPremium onlyMargin, often substantial
    Stress under a big moveFixed, known in advanceCan escalate fast

    This table is the reason the honest answer to option buying vs option selling is not a single word. Buying risks a small, known amount frequently. Selling risks a small win frequently, in exchange for a rare but potentially severe loss. Statistically, sellers win more often, but the losses they eventually take can erase many winning trades at once.

    Read Also: Best Option Selling Strategy in India

    Why Option Selling Is Costly When It Goes Wrong

    Why option selling is costly comes down to three specific mechanics that many new traders underestimate.

    • Unlimited or Near-unlimited Loss Potential: A naked call seller has no ceiling on loss if the underlying keeps rising. A naked put seller can lose up to the strike price if the stock collapses toward zero. Compare that to a buyer, whose loss is capped the moment the trade is placed.
    • Margin Calls and Forced Liquidation: When a sold position moves against you, your broker’s risk system will ask for additional margin, and if you cannot provide it, your position gets squared off, often at the worst possible price during a fast market move. This is very different from option buying, where there is no margin call because your loss is already paid upfront.
    • Gamma Risk Near Expiry: As expiry approaches, an option’s price becomes extremely sensitive to small moves in the underlying, a factor known as gamma. Sellers who hold positions close to expiry can watch a small adverse move balloon into a large loss within minutes, especially in weekly index options where this effect is magnified.

    None of this means that option selling should be avoided. It means option selling is a business that runs on strict position sizing, hedging, and margin discipline, not on collecting premiums and hoping nothing goes wrong.

    Which Side Is Actually Riskier

    If risk means how much you can lose on a single trade, option selling is clearly riskier, since the potential loss is far larger than the fixed premium a buyer risks.

    If risk means how often you lose money, option buying is riskier, since decay and unfavorable odds mean most bought options expire worthless, and studies of retail trading behavior consistently show buyers losing more frequently over time.

    The most accurate framing is this: option buying risks small amounts often, and option selling risks large amounts rarely. Neither side is safe by default. Both require a plan.

    How Traders Manage Risk on Both Sides

    Serious traders rarely operate as a pure buyer or a pure seller. They combine both sides into spreads that cap risk while still collecting or paying only what the strategy requires.

    • Covered calls let you sell calls against stock you already own, removing the unlimited upside risk of a naked call
    • Credit spreads cap a seller’s maximum loss by simultaneously buying a further strike option as protection
    • Debit spreads reduce a buyer’s cost and improve the odds of profit compared to buying a single option outright
    • Stop losses and defined exit rules matter more for sellers, since an unmanaged sold position is the single fastest way to a large drawdown
    • Position sizing relative to margin available keeps a single bad trade from threatening the entire trading account

    Platforms with a built-in options chain and live Greeks, such as Pocketful, make this kind of risk assessment easier, since traders can see delta, theta, and implied volatility for every strike before placing a trade rather than guessing at exposure after the fact. 

    Read Also: 5 points to be considered before buying or selling any stocks

    Conclusion

    Option buying vs option selling is not a contest with one clear winner. Buying limits your loss to a known number but statistically loses more often due to time decay. Selling improves your odds of winning on any single trade but exposes you to losses that can be severe and fast-moving when the market turns. 

    The safest approach for most traders sits between the two extremes: using defined-risk spreads, respecting margin requirements, and treating option selling with the same seriousness as running a business rather than collecting easy premium. Whichever side of the trade you take, know your maximum loss before you place the order, not after.

    And if you are not sure and still looking for an option that supports you, then you need to have a platform that offers you insights, tools, and support. This is where registering with Pocketful can be really helpful to you.

    S.NO.Check Out These Interesting Posts You Might Enjoy!
    1GIFT Nifty vs Nifty 50: Key Differences
    2Margin Trading vs Short Selling – Key Differences
    3Differences Between MTF and Loan Against Shares
    4Difference Between Trading and Investing
    5ETF vs Index Fund: Key Differences You Must Know

    Frequently Asked Questions (FAQs)

    1. Is option buying or option selling riskier for beginners? 

      Option selling is generally riskier for beginners because losses can exceed the margin a new trader expects, especially on naked positions. Option buying limits loss to the premium paid, which makes it easier to understand and survive early mistakes, even though it wins less often.

    2. Why do most retail traders lose money buying options?

      Time decay reduces an option’s value every day, so a buyer needs the underlying to move quickly and strongly enough to overcome that decay before expiry. Data from SEBI’s studies on individual investor derivative trading has repeatedly shown that most retail buyers lose money over a financial year for exactly this reason.

    3. Can option selling cause unlimited losses? 

      Yes, on an uncovered or naked call, since there is no ceiling on how high the underlying can rise before expiry. A naked put seller’s loss is capped only by the stock falling to zero, which is still a very large potential loss relative to the premium collected.

    4. Is option selling suitable for small trading accounts? 

      Option selling requires posting margin, which is usually far larger than the premium collected, so small accounts often cannot sell options safely without using defined-risk strategies like credit spreads that cap the maximum possible loss.

    5. What is the safest way to combine option buying and selling? 

      Spread strategies that combine a bought and a sold option at different strikes, such as credit spreads or debit spreads, cap the maximum loss on both sides while still allowing a trader to benefit from time decay or directional movement, making them a more balanced approach than trading either side alone.


  • Top 10 Richest Companies in the World

    Top 10 Richest Companies in the World

    Nearly every industry today intersects with a small group of companies that dominate global markets. Several of the applications on your phone, the chip powering your laptop, and the cloud servers storing your data likely trace back to one of the richest companies in the world. These firms are not distant, abstract corporations, they are deeply embedded in everyday technology and infrastructure. Many people searching for the world richest company name are simply trying to identify which single company sits at the very top of this list.

    This ranking is based on market capitalization, using current 2026 data. The following sections outline the top 10 companies, the factors behind their positions, and considerations to keep in mind before assuming today’s leaders will remain unchallenged.

    What Actually Decides Who’s “Richest”?

    Quick clarification before we get into it. When people type in world’s richest company, they usually mean market cap, not revenue, and definitely not profit, even though folks mix those up all the time.

    Market cap itself isn’t some complex formula. Share price times shares outstanding. Done. It’s basically the market placing a bet on what a company is worth today, nothing more permanent than that.

    Compare that to:

    • Revenue: everything a company sells, before a single expense gets subtracted
    • Net profit: what actually remains once bills, taxes, and overhead are paid
    • Assets: the cash, buildings, and equipment a company owns outright

    A supermarket chain can move enormous volumes of revenue and still land well below a tech company selling a fraction of that. Feels counterintuitive, sure. But it’s exactly why chipmakers and cloud businesses have taken over this ranking.

    Top 10 Richest Companies in the World

    RankCompanySectorApprox. Market CapHeadquarters
    1NVIDIASemiconductors / AI$4.8 TrillionUSA
    2AppleConsumer Tech$4.3 TrillionUSA
    3Alphabet (Google)Internet / AI$4.2 TrillionUSA
    4MicrosoftCloud / Software$2.8 TrillionUSA
    5AmazonE-commerce / Cloud$2.5 TrillionUSA
    6TSMCChip Manufacturing$2.3 TrillionTaiwan
    7SpaceXAerospace$2.1 TrillionUSA
    8BroadcomSemiconductors$1.8 TrillionUSA
    9Saudi AramcoOil & Energy$1.7 TrillionSaudi Arabia
    10Meta PlatformsSocial Media / AI$1.4 TrillionUSA

    These figures move around constantly, so don’t treat them as fixed. This is a mid-2026 snapshot. Apple and Alphabet, for instance, have swapped the number two spot back and forth more than once already this year.

    Overview of Top 10 Richest Companies in the World

    1. NVIDIA – The World No 1 Company by Market Cap

    Rewind three or four years and NVIDIA wasn’t even close to this list. Watching it climb this fast caught plenty of longtime market watchers off guard, honestly.

    What happened is simple to explain, harder to overstate. NVIDIA built its chips for gaming graphics originally. Turns out those same GPUs are almost perfectly suited for training AI models. Every cloud provider worth naming, every serious AI lab, leans on this hardware. That kind of demand doesn’t come cheap, and it’s dragged the valuation up near $4.8 trillion.

    2. Apple – Keeps Doing What It’s Always Done

    You’ve probably got an Apple product within reach as you’re reading this. That’s no accident. It’s decades of building things people genuinely don’t want to give up.

    Hardware only tells half the story though. Services – App Store fees, iCloud subscriptions, Apple Music bring in steady, high-margin cash every single quarter, phone upgrade cycle or not. Loyal customers paired with recurring income is tough to beat, and that combination keeps Apple firmly among the richest companies in the world.

    3. Alphabet – Rides the Search Engine and the AI Wave Together

    Google, YouTube, Android, Google Cloud all one company under the hood. Search ads remain the quiet moneymaker here, generating serious profit without much noise around it.

    Lately, AI is the bigger story. Alphabet has thrown real money behind Gemini and DeepMind, and that bet has clearly paid off through 2026. There have been stretches this year where Alphabet actually pulled ahead of Apple for second place.

    4. Microsoft – Blends Old Reliable With New Money

    Windows, Office, Xbox you’ve probably paid Microsoft at some point without giving it a second thought. Then there’s Azure, slugging it out with Amazon and Google for enterprise cloud deals.

    Its tie-up with OpenAI hasn’t hurt matters either. Between the cloud side and the AI angle, Microsoft’s valuation has pushed well past $2.5 trillion.

    5. Amazon – Grew Way Beyond Selling Books

    Easy to forget Amazon started as an online bookstore and nothing else. These days it’s practically the go-to example of a world best business company figuring out how to diversify the right way.

    E-commerce still grabs most of the attention, sure. But the real money comes from AWS, Amazon’s cloud division, which quietly runs a massive share of the internet’s backend that most people never think twice about.

    6. TSMC – Builds the Chips You Never Actually Buy

    You’ll never walk into a store and buy something branded “TSMC.” That’s kind of the point. Taiwan Semiconductor Manufacturing builds the chips inside NVIDIA’s GPUs, Apple’s processors, and a long list of devices you use daily.

    Pull TSMC out of the picture and a huge chunk of the tech industry grinds to a halt almost overnight. Not an exaggeration, chip manufacturing has gotten that concentrated. The company has also committed roughly $250 billion toward expanding its plants in the US.

    7. SpaceX – Just Went Public, and It Wasn’t Subtle

    SpaceX finally listed shares in mid-2026, and the debut made noise. Shares jumped fast enough that the valuation crossed $2 trillion within days of trading opening.

    What makes SpaceX different from everything else on this list is who it’s up against. It’s not just competing with other private companies anymore, it’s competing with national space programs and government satellite operations, and it now controls somewhere around 80% of the commercial launch market.

    8. Broadcom – Doesn’t Make Headlines, But It Makes AI Work

    Broadcom isn’t the company people bring up at dinner parties the way they do NVIDIA. Still, it’s become essential to how AI infrastructure actually gets built — custom chips for cloud providers, networking hardware, data center components.

    That slower, steadier climb landed it in the trillion-dollar club anyway, and it’s been rising faster than most people give it credit for.

    9. Saudi Aramco – Is the Odd One Out

    Scroll through this list and one company clearly doesn’t belong with the rest. Everyone else is tech. Saudi Aramco has held its spot near the top for years running on one thing: crude oil.

    Being state-owned, its cash flow from production and exports is massive. But unlike the tech names above, its valuation swings more with oil prices and regional politics than with typical stock market sentiment and this year’s conflicts in the region haven’t made that any calmer.

    10. Meta – Keeps Betting on What Comes After Social Media

    Facebook, Instagram, WhatsApp together they reach a genuinely staggering share of everyone online. Advertising across those apps still drives most of the money, and that part hasn’t shifted much.

    What has shifted is the AI push. Llama models, smart glasses, wearables  Meta is clearly trying to get ahead of whatever’s next instead of just riding on social media alone.

    Read Also: Top Assets by Market Cap Worldwide

    What’s Actually Driving These Companies to the Top?

    A few patterns keep showing up once you look past the individual companies:

    • AI investment – the single biggest growth driver on this whole list, hands down
    • Cloud computing – still printing reliable, high-margin revenue year after year
    • Global reach – selling in nearly every market cushions against local slowdowns
    • Brand loyalty – customers who don’t need much convincing to stick around
    • Cash flow – deep enough to fund continuous expansion without blinking
    • Constant reinvestment – staying ahead instead of coasting on past wins

    Eight out of ten companies here are tech firms. That says a lot about where investors are putting their confidence right now. Worth remembering, though, that sector dominance has flipped before more than once and nothing says it can’t happen again.

    How To Do Investing Through Pocketful

    If you want to start investing in International mutual funds or ETF the right way, Pocketful makes the entire process simple and structured. Here’s how you can get started:

    Step 1: Create Your Account

    The first step is to download the Pocketful app and sign up. The registration process is quick and takes only a few minutes.

    • Enter your mobile number and verify with OTP
    • Set your login credentials
    • Access your personal dashboard

    Step 2: Complete Your KYC

    KYC is mandatory before you can invest in any International mutual fund or ETF in India. On Pocketful, the entire KYC process is online and paperless.

    • Add your PAN and Aadhaar details
    • Enter your bank account information
    • Complete the verification process

    Step 3: Select a Mutual Fund

    Once your account is ready, you can browse International mutual funds or ETF based on your goal, risk appetite, and investment horizon. Pocketful lists funds across all major categories.

    • Choose from equity, debt, hybrid, or index funds
    • Filter by AMC, fund rating, or past performance
    • Compare expense ratios before finalising

    Step 4: Start Your SIP or Lump Sum Investment

    Decide how you want to invest through a monthly SIP or a one-time lump sum. SIPs can be started with as little as ₹100 per month.

    • Set your SIP amount and date
    • Choose the fund and confirm your investment
    • Track your SIP performance directly from the dashboard

    Pocketful gives you access to International mutual fund plans with zero commission.

    Read Also: Top 10 Richest People in the World

    Conclusion

    This ranking is a snapshot of just how much the global markets have been turned on their head by the likes of AI, cloud computing & digital platforms over the last few years. It’s taken nvidia years to build that stronghold on chip dominance , Amazon has been steadily pushing the boundaries with its cloud infrastructure and it’s taken Apple a long time to amass that loyal following of customers – and we all know that none of this is ever set in stone,it can all be taken away from them just as quick as it was built.

    Anyone delving into the top companies in the world for research, work or investment should look at this list as a one off snapshot, take it for what its worth on the day, rather than getting too hung up on some fixed pecking order – the truth is none of todays big shots were leading the pack 5 years ago & history proves that this list of the worlds most valuable companys is going to be in a state of flux in the years to come.

    S.NO.Check Out These Interesting Posts You Might Enjoy!
    1Top Highest Leverage Brokers in India
    2Top Investors In India And Their Portfolios
    3Best YouTube Channels for Stock Market in India
    4Best Trading YouTube Channels in India
    5Books for Beginners in Trading & Investing
    6Best Stock Market Traders in the World

    Frequently Asked Questions (FAQs)

    1. Which is the world’s richest company right now? 

      As of mid-2026, that’s NVIDIA, sitting above $4.8 trillion in market cap and still climbing on AI chip demand. If you’re looking up the world richest company name, NVIDIA is currently the answer, though the world richest company title has changed hands before and can shift again.

    2. Is market cap the only way to measure a company’s wealth? 

      Not really. Revenue, profit, assets, and cash flow each tell a different piece of the story, and depending on which one you lean on, the rankings can shift quite a bit.

    3. How often do Top 10 richest company rankings actually change? 

      More than most people would guess. Market cap tracks share prices day to day, so a company can gain or lose several spots in just a few weeks.

    4. Why are so many of the richest companies in the world based in the US? 

      Deep capital markets are a big part of it. US exchanges pull in investors from everywhere, and American tech firms tend to have enormous global customer bases. That mix pushes valuations higher than a lot of overseas competitors can reach, even with similar revenue numbers.

    5. Could a non-tech company break back into the top 10? 

      Sure, it’s happened before. Energy and banking giants have topped these lists in the past, and a shift in oil prices, interest rates, or regulation could move things fast. Saudi Aramco’s spot here proves tech doesn’t own a permanent monopoly on the top.

  • What is IPO Lot Size?

    What is IPO Lot Size?

    Imagine walking into a wholesale store to buy one packet of biscuits, only to find they are sold strictly in bulk boxes. The stock market follows a very similar rule when a fresh company steps in to raise funds from the public. Instead of letting people purchase a single share, the company groups them into fixed bundles. Anyone looking to invest must buy these complete bundles. Grasping this basic concept is a big step for anyone wanting to explore the stock market. It makes planning your budget much easier and helps you invest with absolute confidence. Let us dive into how this bundling system works and why it matters for everyday investors.

    What is IPO Lot Size Means

    To put it in simple words, an ipo lot size is the fixed minimum number of shares you must apply for when bidding. When a company lists on the stock exchange, it does not sell shares one by one, but groups them into fixed packets. This specific packet is called a lot.

    If you are wondering what is lot size in ipo, let us look at a quick example. If a company sets its lot size in ipo at 100 shares, you can only buy shares in multiples of 100. You can easily apply for 100 shares, 200 shares, or 300 shares, but you cannot apply for 150 shares.

    The minimum lot size in ipo is the smallest number of shares you can buy to join the bidding. You cannot apply for anything less than this limit. If you are thinking about how many lots can be applied in ipo, the answer depends on your investor category and specific offer rules.

    Why IPO Lot Size Matters

    Understanding this concept is highly helpful for every investor. Here are five main reasons why this system is important for you:

    • Standardises the application process: It makes the bidding process very simple and clean. Stock exchanges can process thousands of applications quickly when everyone bids in uniform packets.
    • Determines your minimum budget: Before you apply, you can exactly calculate the money you need. This helps you keep the right amount ready in your bank account.
    • Ensures fair share distribution: When demand is high, the registrar uses these lots for fair distribution. They use a computerized lottery to give shares equally among applicants.
    • Categorises different types of investors: This method helps the regulatory system separate small retail investors from wealthy individuals and large institutions.
    • Prevents market monopoly: By limiting maximum application sizes, the system ensures fairness. It stops a few wealthy buyers from taking all the shares of a good company.

    Minimum Vs Maximum Lot Size

    Now, let us look at the difference between the minimum and maximum limits. The minimum limit is the smallest packet of shares you must bid for. For retail investors, this is always exactly one lot, and you cannot bid for random numbers.

    On the other hand, the maximum limit is the highest number of shares you can apply for. For retail investors in India, the total bidding amount is capped at two lakh rupees. Therefore, your maximum limit in terms of lots depends on the cost of one lot.

    For instance, if one lot costs fifteen thousand rupees, you can bid for a maximum of thirteen lots. This keeps you safely within the retail category. If you apply for more, you will be shifted to a different investor group.

    How Lot Size is Decided in an IPO

    The number of shares in a single packet is not chosen randomly. The company and its financial advisors decide it together based on several important factors:

    • SEBI rules: The regulatory body ensures the minimum investment value stays in a reasonable range. This range is usually between ten thousand and fifteen thousand rupees for mainboard offers.
    • Price of a single share: If the share price is very high, the packet size is kept small. For example, if a share costs one thousand rupees, the lot size may be fifteen shares. If the share is fifty rupees, the packet size will be much larger.
    • Total number of shares offered: The company considers how many total shares it wants to issue. This depends largely on their required funding goals.
    • Type of the offer: Mainboard offers have different budget requirements than small and medium enterprise offers. Small business offers usually have much higher limits for investors.
    • Expected investor demand: The company studies the current market environment carefully. They check how much interest regular investors might have in their business.

    Read Also: How to Bid for an IPO in India

    How to Calculate Minimum Investment in IPO

    Calculating the minimum amount you need to invest is very easy. You do not need any complex tools to do this. The simple formula is multiplying the number of shares in one lot by the upper price band of the share.

    Why do we use the upper price band? When you apply for a public offer, you usually bid at the highest price. The banking system then blocks the maximum possible amount from your bank account.

    If the final price is decided at a lower rate, the extra money comes back. It is credited back to your bank account after the allotment process.

    For example, let us say the share price range is ninety five to one hundred rupees. The packet size is one hundred and fifty shares. Your calculation will be 150 shares multiplied by 100 rupees.

    This gives you fifteen thousand rupees. This is the exact minimum amount you must have in your account to submit one bid.

    Lot Size for Different Type of Investors

    Different groups of investors have different rules when bidding for a public offer. The market regulator defines clear boundaries for everyone. Here is a clear comparison to help you understand the limits for each category:

    Investor CategoryDefinitionInvestment LimitAllotment Method
    Retail Individual InvestorsRegular, everyday investors like you and me.Up to ₹2,00,000 maximum.Computerized lottery system.
    Small Non-Institutional InvestorsWealthy individuals applying for a larger share volume.Between ₹2,00,000 and ₹10,00,000.Lottery based proportional allotment.
    Big Non-Institutional InvestorsCorporate bodies and very wealthy individuals.Above ₹10,00,000 with no upper limit.Lottery based proportional allotment.
    Qualified Institutional BuyersProfessional institutions like mutual funds and insurance companies.Huge amounts, often in crores, with no upper cap.Proportional allotment based on total bids.

    As a retail investor, you must bid for at least one lot. This typically costs between ten thousand and fifteen thousand rupees. Non institutional investors have a higher entry point.

    Their minimum bidding size starts from the number of lots that cost just above two lakh rupees. Qualified institutional buyers bid in huge amounts with no upper caps.

    Current Example of Lot Size from Recent IPO

    Let us look at a real world example to make this highly clear. A very recent mainboard public offer in the Indian market is Xtranet Technologies Limited. This offer opened for bidding in late July 2026.

    The company set its share price range between 120 rupees and 127 rupees per share. The packet size for this public offer was fixed at 110 shares.

    IPO DetailsValue
    Company NameXtranet Technologies Limited
    Price Band₹120 to ₹127 per share
    Lot Size110 shares
    Minimum Investment (1 Lot)₹13,970 (110 shares * ₹127)
    Maximum Retail Investment (14 Lots)₹1,95,580 (1,540 shares)

    If you wanted to apply for this public offer as a retail investor, your minimum bidding quantity was one lot. The minimum investment amount was calculated at the upper price of 127 rupees. This means you needed exactly 13,970 rupees blocked in your bank account to submit a single bid.

    Read Also: What is Lot size in F&O ?

    Conclusion

    Applying for a public offer can be an exciting way to start your journey in the stock market. Knowing about share packets helps you manage your savings better. It also allows you to apply for bids with great confidence.Platforms like Pocketful make this entire process highly simple and tension free for you. With zero account opening fees and a very friendly interface, you can apply for public offers easily on Pocketful.

    Whether you want to explore new businesses or build a long term portfolio, having the right knowledge is the best way to move forward. Keep learning and enjoy a positive investing journey.

    S.NO.Check Out These Interesting Posts You Might Enjoy!
    1Anchor Investors in IPOs – Meaning, Role & Benefits
    2How to Cancel an IPO Application?
    3Why Invest in anKey Difference Between IPO and FPOIPO and its Benefits?
    4What is Face What is the IPO Cycle
    5What is NII in IPO?
    6What Is An IPO Mutual Fund? Should You Invest?
    7Why Invest in an IPO and its Benefits?
    8IPO Application Eligibility Criteria
    9What is IPO Valuation?
    10What Is a Hot IPO?

    Frequently Asked Questions (FAQs)

    1. Can you buy less than one lot in an IPO? 

      No. You must apply for at least the minimum lot size. Buying single shares is not allowed.

    2. Does applying for more lots guarantee allotment? 

      No. If an issue is oversubscribed, a lottery is used. Every retail applicant gets an equal chance to receive one lot.

    3. How do you apply for an IPO? 

      You can easily apply online using your UPI ID through investing platforms like the Pocketful app.

    4. Is the lot size same for all IPOs? 

      No. It varies for every company based on its share price and SEBI guidelines.

    5. When is the blocked money released? 

      If you do not get an allotment, the blocked funds return to your bank account within a few days

  • How to Activate Credit Card Online & Offline

    How to Activate Credit Card Online & Offline

    If you’re wondering how to activate credit card, the process is usually quick and can be completed through your bank’s mobile app, internet banking, ATM, customer care, SMS, or by visiting a branch. 

    Once activated, your credit card is ready for transactions, provided you’ve also generated your PIN if required. The exact process may vary slightly across banks, but most cards can be activated within a few minutes.

    This guide shares all the details you need for card activation and the safety tips.

    Key Highlights

    FeatureDetails
    Activation MethodsMobile app, Net Banking, ATM, SMS, Customer Care, Bank Branch
    Average Activation TimeInstant to 24 hours
    ChargesFree
    Documents RequiredCredit card, registered mobile number, OTP
    PIN GenerationAvailable through ATM, mobile app, or internet banking
    Activation RequiredYes, before using a new credit card

    What Does Credit Card Activation Mean?

    Credit card activation is the process of verifying that the card has reached its rightful owner before it can be used.

    Once your card is activated:

    • You can make online and offline purchases.
    • Contactless payments become available.
    • International transactions can be enabled, if supported.
    • The card becomes an active card ready for everyday use.
    • ATM transactions become available after PIN generation.

    Why Do Banks Require Credit Card Activation?

    Banks keep new credit cards inactive until the customer verifies ownership. This additional layer of security helps reduce fraud and protects customers if a card is lost during delivery.

    Some key reasons include:

    • To avoid any illegal use or misuse.
    • Ensure that the card is with the rightful holder or owner.
    • Reduces fraud during delivery.
    • Protects sensitive financial information.
    • Complies with banking security guidelines.
    • Gives customers control before the card becomes usable.

    Ways to Activate Credit Card

    MethodOnline/OfflineApproximate TimeBest For
    Mobile Banking AppOnlineInstantMost users
    Internet BankingOnlineInstantExisting account holders
    ATMOffline2 to 5 minutesCustomers visiting an ATM
    Customer CareOffline5 to 10 minutesUsers needing assistance
    SMSOnlineInstantBanks offering SMS activation
    Bank BranchOffline15 to 30 minutesCustomers preferring in-person support

    How to Activate Credit Card Online

    Online activation is the fastest and most convenient method. Most banks allow customers to activate their cards through digital banking services without visiting a branch.

    Activate Through the Mobile Banking App

    1. Download and open your bank’s official mobile banking app.
    2. Log in using your credentials.
    3. Go to the Cards or Credit Cards section.
    4. Select your new credit card.
    5. Choose Activate Card.
    6. Verify your identity using an OTP or biometric authentication.
    7. Complete the activation process.
    8. Generate your credit card PIN if prompted.

    Activate Through Internet Banking

    1. Visit your bank’s official internet banking portal.
    2. Log in securely.
    3. Navigate to the Credit Card section.
    4. Select the newly issued card.
    5. Click Activate Card.
    6. Complete OTP verification.
    7. Confirm the request.

    Activate Through SMS

    1. Open the messaging app on your registered mobile number.
    2. Type the activation message in the format specified by your bank.
    3. Send it to the designated number.
    4. Wait for the confirmation message.

    Since SMS formats vary across banks, always check your welcome kit or the bank’s official website before sending the message.

    How to Activate Credit Card Offline

    If you are not comfortable using digital banking, you can activate your credit card through offline methods.

    Activate Through an ATM

    1. Visit your bank’s ATM.
    2. Insert your new credit card.
    3. Choose the PIN Generation or Card Services option.
    4. Verify your identity using the OTP. It is received on your registered mobile number.
    5. Create your preferred ATM PIN.
    6. Complete the process.

    Activate Through Customer Care

    1. Call your bank’s official customer care number.
    2. Verify your identity.
    3. Provide the required card details.
    4. Follow the instructions shared by the executive or IVR.
    5. Receive confirmation once activation is complete.

    Visit the Bank Branch

    1. Carry your new credit card.
    2. Bring a valid identity proof if required.
    3. Request card activation.
    4. Complete identity verification.
    5. The bank executive will activate your card.

    Read Also: Best Credit Cards in India

    How to Activate SBI Credit Card

    If you’ve recently received an SBI Card, there are several convenient ways to activate SBI credit card.

    Through the SBI Card Mobile App

    • Log in to the SBI Card App.
    • Select your newly issued card.
    • Tap Activate Card.
    • Share the OTP you received on your number.
    • Complete the activation.

    Through the SBI Card Website

    • Log in to your SBI Card online account.
    • Navigate to the card management section.
    • Select the activation option.
    • Complete OTP verification.
    • Your card will be activated instantly.

    Through Customer Care

    You can also activate SBI credit card by contacting SBI Card customer support and completing the verification process.

    Through an ATM

    Generate your ATM PIN at an SBI ATM or other supported ATM. In many cases, this also completes the activation process.

    Once you activate SBI credit card, do a transaction to confirm that it is working.

    How Long Does Credit Card Activation Take?

    The activation time can be anywhere between instant to 24 hours based on the method.

    Activation MethodEstimated Time
    Mobile Banking AppInstant
    Internet BankingInstant
    SMSInstant to a few minutes
    ATMInstant
    Customer Care5 to 10 minutes
    Bank BranchSame day

    Common Problems During Credit Card Activation

    Activating a credit card is really simple. But at times you can face issues as below.

    ProblemPossible ReasonSolution
    OTP not receivedNetwork issue or incorrect registered mobile numberWait a few minutes, request a new OTP, or update your mobile number with the bank.
    Activation failedIncorrect card details enteredVerify the card number, expiry date, and other details before trying again.
    Card not visible in the appCard not yet linked to your accountRefresh the app or contact customer support.
    Technical errorTemporary server issueTry again after some time or use another activation method.
    Card blockedMultiple incorrect attemptsContact the bank to unblock or reissue the card if required.
    Invalid credentialsIncorrect internet banking login detailsReset your password or log in using the correct credentials.

    If the issue continues, connect with the bank support. Use the official number only. You can visit the bank as well. 

    Safety Tips While Activating Your Credit Card

    Activating your credit card is a secure process. But this is true when you follow the right steps and proper channels. Some things to remember are:

    • Use only your bank’s official website or mobile application.
    • Avoid using public Wi-Fi networks for activating the card.
    • Never share your OTP with anyone.
    • Do not share your CVV, PIN, or internet banking password.
    • Generate a strong password for your card.
    • Enable SMS and email transaction alerts.
    • Check your first few transactions regularly for any unauthorised activity.
    • Log out of internet banking after completing the activation process.

    Taking these simple steps helps keep your active card secure from fraud.

    Can You Use a Credit Card Without Activation?

    No. Banks generally keep new credit cards inactive until the cardholder completes the activation process. This security measure ensures that only the rightful owner can use the card.

    Depending on the bank:

    • Online purchases may remain blocked.
    • Contactless payments may not work.
    • ATM withdrawals are unavailable until a PIN is generated.
    • International transactions may stay disabled until activated or manually enabled.

    Completing the activation process ensures that your card is ready for secure use across all supported payment channels.

    Read Also: Best RuPay Credit Cards in India

    Difference Between Credit Card Activation and PIN Generation

    Many people assume these are the same process, but they serve different purposes.

    Credit Card ActivationPIN Generation
    Makes the credit card ready for use.Creates or sets the ATM PIN for the card.
    Usually completed only once.Can be changed whenever required.
    Required before making most transactions.Required for ATM withdrawals and PIN-based purchases.
    Confirms card ownership.Improves transaction security.

    Even after learning how to activate new credit card, remember to generate your PIN if your bank requires it.

    What Should You Do After Activating Your Credit Card?

    Once your card is active, you can use it for multiple things like below:

    • Generate or change your ATM PIN.
    • Review your credit limit and billing cycle.
    • Set spending or transaction limits, if available.
    • Add your card to your preferred digital wallet.
    • Enable international transactions only if required.
    • Make a small purchase to confirm successful activation.

    Conclusion

    Knowing how to activate credit card is an essential first step before making your first purchase. Once you know this, you can actually start using the card better. But while you activate your card, you need to focus on safety tips and using the right channels.

    If you’re looking to build better financial habits beyond using your credit card, Pocketful offers easy-to-understand resources. Open your demat account and start trading with confidence,

    S.NO.Check Out These Interesting Posts You Might Enjoy!
    1Difference Between RuPay and Visa Card
    2Best UPI Apps in India
    3SBI Cards and Payment Services Case Study
    4How to Improve Your Credit Score?
    5CRED Case Study

    Frequently Asked Questions (FAQs)

    1. How do I activate my new credit card for the first time?

      You can activate new credit card through your bank’s mobile app, internet banking, ATM, customer care, SMS, or by visiting the nearest branch. Most activations are completed within a few minutes after OTP verification.

    2. Can I activate my credit card without visiting the bank?

      Yes. Most banks allow you to activate credit card online. You can do using app, website, or customer care.

    3. How long does it take to activate a credit card?

      In most cases, activation is instant. However, depending on your bank and the verification process, it may take up to 24 hours.

    4. How do I activate SBI credit card online?

      You can activate SBI credit card through the SBI Card mobile app or the SBI Card website. You can also visit an ATM or a branch to get the card activated. Just have your card and your registered mobile with you.

    5. Is my credit card ready to use immediately after activation?

      Yes. Once you activate your credit card, you can start using it for online and offline transactions.

  • Lifecycle Funds vs Index Funds: Key Differences

    Lifecycle Funds vs Index Funds: Key Differences

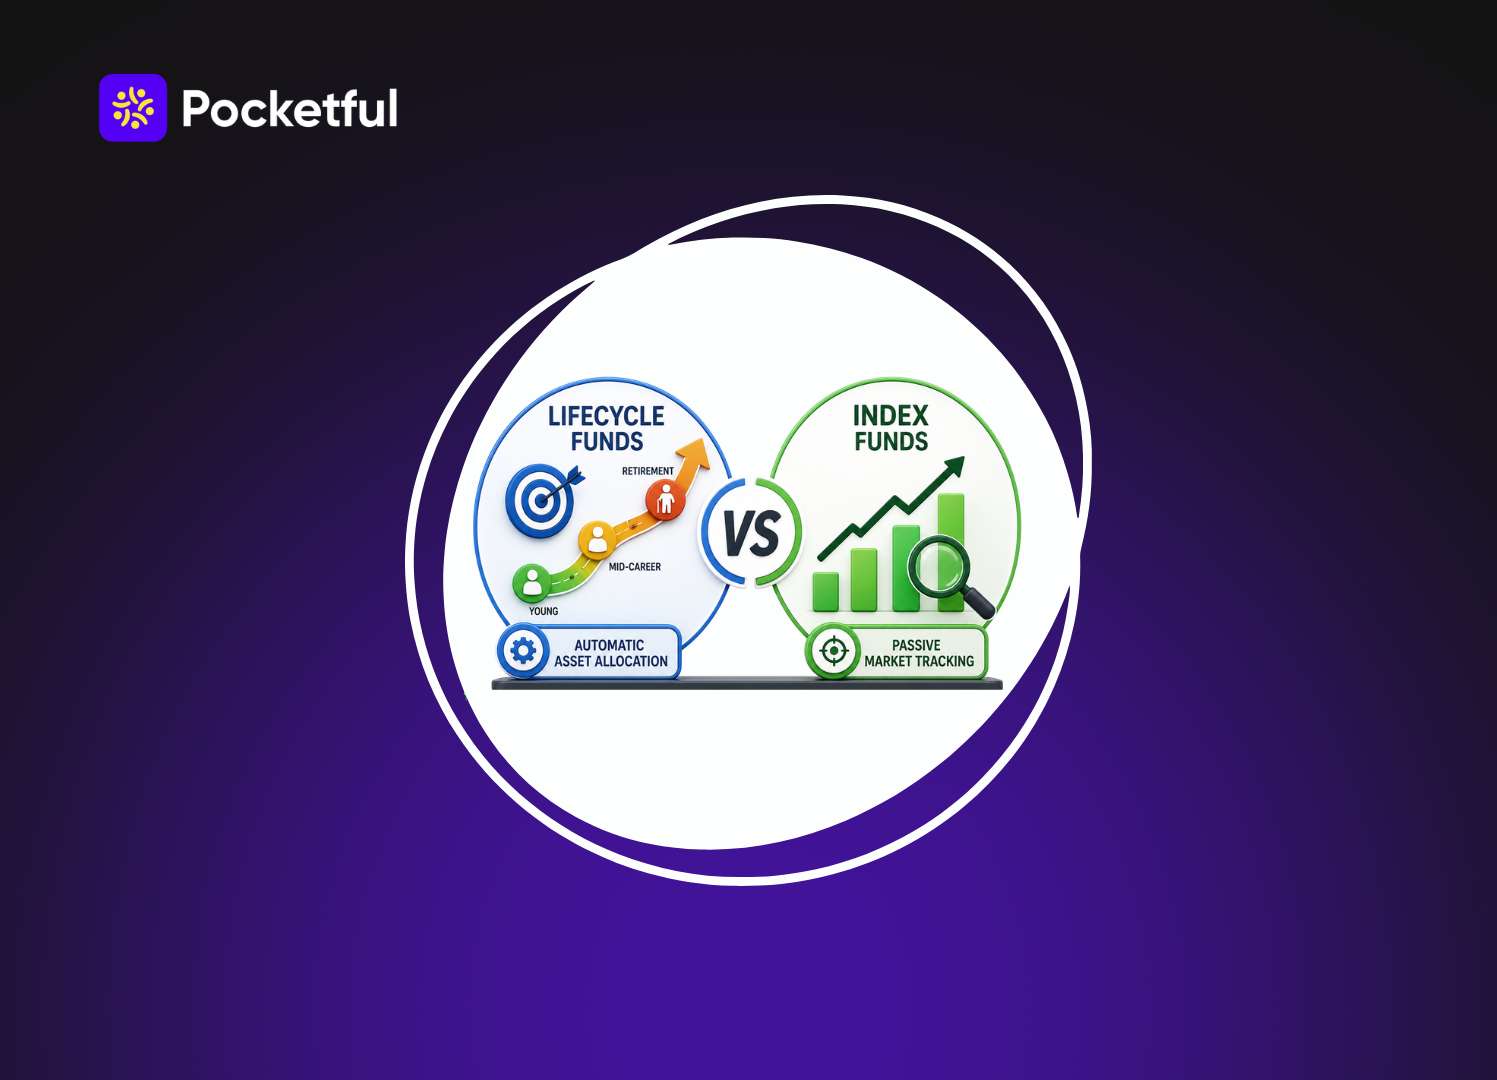
    It is tough to decide between Lifecycle Funds vs Index Funds when both have the same goal of long-term growth. The real difference is in how they work. One shifts your investments automatically over time, while the other requires you to make the calls. This quick guide breaks down those differences simply to help you choose what fits your financial goals. 

    What Are Lifecycle Funds? 

    Lifecycle funds, also known as target-date funds, are mutual funds designed with a specific financial goal in mind such as retirement or a child’s education. Their most distinctive feature is that the asset allocation adjusts automatically over time. Initially, a significant portion of the fund is invested in equities to generate superior long-term returns. However, as the target date approaches, the equity exposure is reduced and the debt allocation is increased in an effort to lower risk.

    This adjustment process is known as the “glide path.” Since the glide path can vary from one fund house to another, the investment strategies of different lifecycle funds are not identical.

    Example: Suppose you are 30 years old and aim to retire at 60. In this scenario, a Lifecycle Fund might initially allocate the majority of your investment to equities. However, as retirement approaches, the fund automatically reduces equity exposure and increases investment in debt instruments. This eliminates the need for you to manually rebalance your portfolio every few years.

    What Are Index Funds? 

    Index funds are mutual funds that invest based on a specific market index. Simply put, if a fund tracks the Nifty 50, it invests in the companies comprising that index in roughly the same proportions. Its objective is not to outperform the market, but rather to deliver performance that mirrors the tracked index as closely as possible.

    These funds do not employ a strategy of frequent buying and selling of shares. If a company is added to or removed from the index, the fund adjusts its portfolio accordingly. This makes them relatively simple to manage and results in lower costs compared to many active funds.

    Example: Suppose you have invested in a Nifty 50 Index Fund. If the Nifty 50 sees significant growth in the future, the value of your investment is likely to rise in roughly the same proportion. Conversely, if the market declines, the impact will be reflected in your fund as well, since it directly tracks that specific index.

    Lifecycle Funds vs Index Funds 

    Comparison FactorLifecycle FundsIndex Funds
    Investment ObjectiveInvesting according to a specific financial goal, such as retirement or education.Tracking the performance of a market index
    Asset AllocationIt changes on its own with time.The investment ratio does not change unless the investor themselves makes a change.
    Risk LevelRelatively higher initially, then gradually decreases.The risk remains in line with the index being tracked.
    Portfolio RebalancingAutomatic as per fund strategyThe investor may need to rebalance the portfolio themselves if the need arises.
    Fund ManagementThe equity-to-debt ratio is adjusted according to the target.Only the selected index is followed.
    Return PotentialDepends on asset allocationClose to the performance of the relevant market index
    Expense RatioIt can generally be slightly higher than index funds.It is often lower because it is a passive fund.
    Role of the investorLower, because the fund itself carries out most of the changes.More so, because the investor has to make the asset allocation decision.
    Better for whom?Investors focused on goal-based and retirement planningInvestors seeking long-term wealth creation and passive investing.

    Read Also: Index Funds vs Mutual Funds: Key Differences

    How Lifecycle Funds Work 

    Lifecycle funds operate based on a pre-determined investment strategy. In these funds, the fund manager periodically adjusts the investment allocation to ensure the fund stays on track to meet its defined objective. The aim is not to react to every minor market fluctuation, but rather to maintain a balanced portfolio aligned with the investment horizon.

    Note: The actual asset allocation may vary according to the strategy of each lifecycle fund and fund house.

    Investment StageFund’s Approach
    Early StageGreater focus on growth
    Mid StageBalancing growth and stability
    Near GoalGreater focus on risk reduction
    Target YearAn attempt to keep capital relatively stable.

    How Index Funds Work ?

    When you invest in an index fund, your money is allocated directly in accordance with the composition of a specific benchmark index. The fund operates based on pre-determined rules, so there is no need for frequent decisions regarding stock selection or trading. Whenever the composition of the benchmark index changes, the fund incorporates that change into its portfolio. Due to this process, the index fund’s performance remains very close to that of its benchmark over the long term.

    Index Funds Working Process 

    StepWhat Happens
    1A benchmark index is selected.
    2The portfolio is constructed in accordance with that index.
    3The portfolio is updated when changes occur in the index.
    4The fund’s performance attempts to track the benchmark.

    Pros and Cons of Lifecycle Funds 

    Lifecycle funds can be convenient for investors who wish to invest for the long term and prefer not to manage their portfolios frequently. However, like any investment, they come with both advantages and limitations.

    AdvantagesLimitations
    Investments are continuously adjusted over time in accordance with your goals.Asset allocation follows a pre-determined strategy, so it is not easy to alter it according to one’s preference.
    There is no need to rebalance the portfolio frequently.The same glide path may not always be suitable for different investors.
    They can be useful for long-term financial goals, such as retirement planning.In some cases, the expense ratio can be higher than that of index funds.
    The likelihood of emotional decisions in investment is reduced.If the investment goal changes, you might need to switch funds.
    The investment process becomes relatively easy for new investors.Investors seeking greater control might find this less flexible.

    Pros and Cons of Index Funds 

    Index funds are quite popular due to their low costs and simple investment strategy. However, it is also important to understand their advantages and limitations before investing in them.

    AdvantagesLimitations
    Generally, the expense ratio is low.The value of the fund may also decrease when the market falls.
    The investment strategy is transparent because it follows a specific index.The goal is not to deliver returns that outperform the market.
    It is considered a good passive investment option for long-term investment.The investor has to make the decision regarding asset allocation themselves.
    There is no need to repeatedly select stocks.Additional funds may be required for different financial goals.
    Changes to the portfolio occur only when there are changes to the index.Returns may differ slightly from the index due to tracking error.

    Who Should Choose Lifecycle Funds? 

    Every investor has unique needs. Lifecycle funds are considered particularly suitable for those who prefer to keep their investments simple and wish to avoid the hassle of managing their portfolio over time.

    • Retirement Planning: If your primary goal is saving for retirement, this can be a suitable option.
    • First-Time Investors: This is an easy option for those just starting their investment journey who lack experience with asset allocation.
    • Busy Professionals: Lifecycle funds can be useful if you do not have the time to regularly track or rebalance your portfolio.
    • Goal-Based Investors: These funds are suitable for investors saving for specific financial goals, such as children’s education or retirement.
    • Investors Who Prefer Automatic Management: If you want your investments to automatically rebalance over time, lifecycle funds can be an excellent choice.

    Who Should Choose Index Funds? 

    Index funds can be a great choice for investors looking for low-cost, long-term investments who are comfortable aligning with market performance.

    • Long-Term Investors: If your investment horizon spans 10–15 years or more, index funds can be an excellent option.
    • Cost-Conscious Investors: Index funds are suitable for investors who prefer funds with low expense ratios.
    • Passive Investors: If you wish to avoid the hassle of frequent stock selection or active trading, index funds could be the right choice for you.
    • DIY Investors: Individuals who prefer to personally determine the balance between equity and debt based on their specific needs can opt for index funds.
    • Wealth Creation Seekers: If your primary goal is gradual wealth creation over the long term and you can handle market volatility, index funds can be a great option.

    Read Also: ETF vs Index Fund: Key Differences

    Start Investing in Lifecycle and Index Funds with Pocketful 

    If you want to start investing in Lifecycle Funds or Index Funds, Pocketful can be an easy and convenient platform.

    Why Choose Pocketful?

    Conclusion

    There is no single winner between Lifecycle Funds and Index Funds. If you prefer a hands-off approach where your money automatically rebalances over time, Lifecycle Funds fit perfectly. But if you want a low-cost way to track the market long-term, Index Funds are the way to go. Your choice simply comes down to your personal investment style and goals. 

    S.NO.Check Out These Interesting Posts You Might Enjoy!
    1Regular vs Direct Mutual Funds: Make The Right Investment Decision
    2Mutual Funds vs Direct Investing: Differences
    3ETF vs Stock – Which One is the Better Investment Option?
    4Gold ETF vs Gold Mutual Fund: Differences
    5Difference Between Large Cap vs Mid Cap Mutual Fund

    Frequently Asked Questions (FAQs)

    1. What is the difference between Lifecycle Funds and Index Funds?

      Lifecycle Funds adjust their asset allocation over time, whereas Index Funds track a specific market index.

    2. Are Lifecycle Funds good for retirement planning?

      Yes, they are specifically designed with long-term financial goals, such as retirement, in mind.

    3. Do Index Funds give guaranteed returns?

      No, their returns depend on market performance.

    4. Which is better for beginners: Lifecycle Funds or Index Funds?

      If you do not wish to manage your portfolio yourself, Lifecycle Funds can be a better option.

    5. Are Index Funds low-cost investments?

      Yes, most Index Funds have a lower expense ratio compared to active funds.

  • Partially Filled in Trading: Meaning, Reasons & Examples

    Partially Filled in Trading: Meaning, Reasons & Examples

    While trading, you may sometimes find that after placing an order, only a portion of the shares are executed instead of the entire quantity being bought or sold. This situation is known as being partially filled or partially executed. Understanding this concept is important if you wish to grasp the meaning of these terms. It is not an error but a standard market process. In this article, we will explain in simple language why this happens and how it impacts your trades.

    What Does Partially Filled Mean in Trading? 

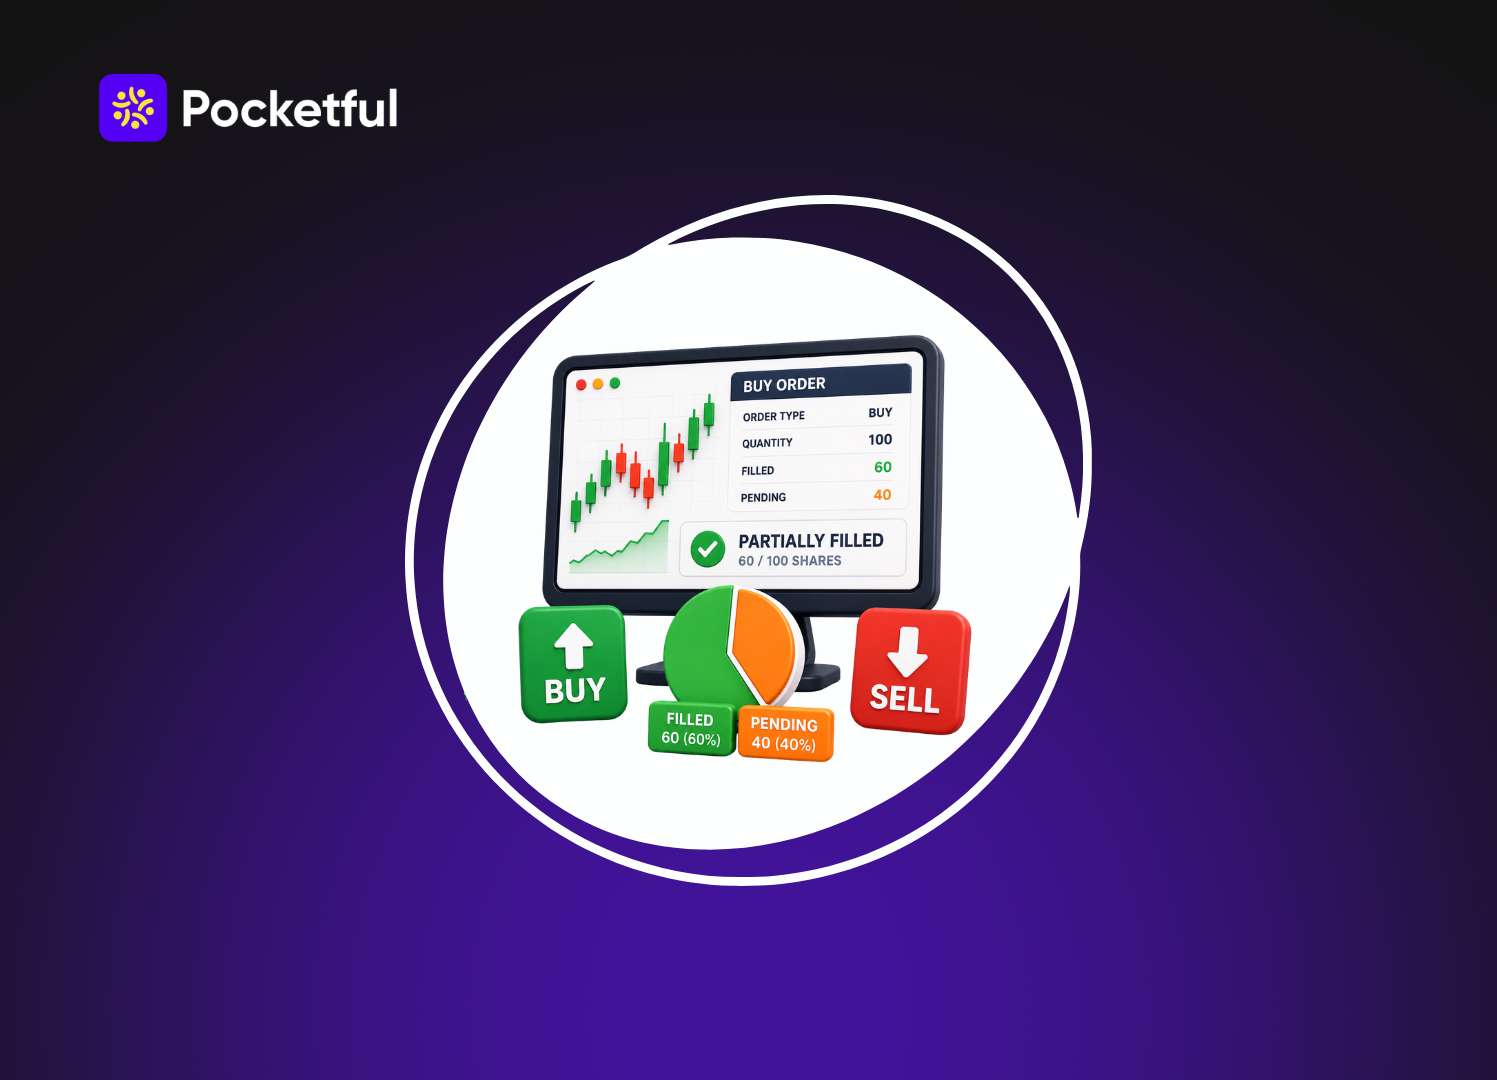
    During trading, it often happens that the total number of shares you placed an order to buy or sell is not available all at once. In such cases, the exchange executes the order for the available quantity first and leaves the remainder pending. This situation is known as being partially filled. It is a common occurrence in the stock market and does not mean that your order has failed or been rejected.

    Meaning of Partially Filled

    Partially filled means that only a portion of your order has been successfully executed, while the remaining quantity is still awaiting fulfillment. This often happens when there are not enough buyers or sellers available at your specified price. The remaining quantity can also be executed as soon as a matching order is found at that same price.

    Meaning of Partially Executed

    The meaning of partially executed is essentially the same as partially filled. Both terms indicate that only a portion of the order has been executed. Different trading platforms or brokers may use either of these status labels, but the meaning remains the same.

    Example

    Order DetailsStatus
    Buy Order 1,000 Shares @ ₹250Order Placed
    Available at ₹250400 Shares
    Executed400 Shares
    Remaining Pending600 Shares
    Order StatusPartially Filled

    Types of Orders That Can Be Partially Filled 

    The likelihood of a partial fill is not the same for every order; it depends on the order type you have selected. Some orders may be executed partially, whereas others require the entire order to be executed at once.

    Order TypeCan Be Partially Filled?Explanation 
    Limit OrderYes Only the available quantity is executed.
    Market OrderYes A large quantity can be executed in multiple parts.
    Stop-Loss Limit OrderYes After the trigger, execution takes place based on the available quantity.
    IOC (Immediate or Cancel)Yes As much as can be executed immediately is executed; the rest is cancelled.
    FOK (Fill or Kill)Yes The entire order must be executed; otherwise, it gets cancelled.

    How Does a Partially Filled Order Work? 

    When you place a buy or sell order in the stock market, its execution follows a specific process. If the full quantity is not available at your specified price at that moment, only the available portion of the order is executed, while the remaining quantity stays pending. Refer to the steps below to understand this better.

    Step What happens?
    Step 1You place a buy or sell order for a stock.
    Step 2Your order reaches the exchange’s order book.
    Step 3The exchange searches for matching buy or sell orders based on your price and quantity.
    Step 4The quantity available at that price is executed immediately.
    Step 5If the full quantity is not available, the remaining order stays pending and waits for a matching order.
    Step 6The remaining quantity may also be executed later if a matching order is found. If that does not happen, you can modify or cancel the order.

    Let’s understand this with an example.

    Suppose you placed a limit order to buy 1,000 shares of ABC Ltd. at ₹500 per share. At that moment, only 600 shares were available at the ₹500 price point. In this scenario, the exchange would first execute the trade for those 600 shares, while the remaining 400 shares would stay pending in the order book. If a seller subsequently becomes available to sell 400 shares at ₹500, the remainder of your order will also be executed automatically.

    Read Also: What is Pyramid Trading?

    Why Do Orders Become Partially Filled? 

    There can be several reasons why an order gets partially filled. This primarily depends on market liquidity, your chosen price, and the order quantity.

    • Low Liquidity: If there are few buyers or sellers for a particular stock, your entire quantity may not find a match at once. Consequently, only a portion of the order gets executed.
    • Large Order Size: It is not always possible to execute a large-quantity order in a single go; therefore, the order may be executed in multiple parts.
    • Limit Price: With a limit order, if there aren’t enough shares available at your specified price, the order may get partially filled.
    • High Market Volatility: In a rapidly changing market, prices fluctuate constantly. This can make it difficult to secure the entire quantity at a single price point.
    • Wide Bid-Ask Spread: When there is a significant gap between the buy price and the sell price, order matching slows down, increasing the likelihood of a partial fill.

    What Happens After an Order Is Partially Filled? 

    When your order is partially filled, the trade does not end there. The quantity that has already been executed becomes part of your trade, while the exchange continues to look for a matching order for the remaining quantity. What happens next depends on your trading strategy and market conditions.

    • Remaining Order Continues to Wait: The quantity that has not yet been executed remains active until a matching order is found or the order’s validity expires.
    • You Can Change Your Order: If you feel there is a low probability of the order being completed at the current price, you can modify its price or quantity. This may increase the likelihood of the order being executed.
    • You Can Stop Waiting: If you are no longer interested in the trade, the remaining quantity can be cancelled. This removes only the pending portion; the part that has already been executed remains unaffected.
    • It Depends on the Market: Sometimes, the remaining order gets filled within a few seconds, whereas in other cases, no matching order is found for a long time. Therefore, the process following a partial fill depends entirely on the orders available in the market.

    Advantages of Partially Filled Orders 

    While many traders view partially filled orders as a problem, they can actually be beneficial in certain situations especially during periods of high market volatility or when trading in large quantities.

    • Better Price Control: With a limit order, the available quantity is executed first at your specified price. This gives you the opportunity to trade at your desired price point.
    • Higher Execution Opportunity: Even if the entire quantity isn’t available at once, a portion of the order still gets executed, ensuring you don’t miss out on the trade entirely.
    • Useful for Large Orders: Executing large orders all at once isn’t always easy. Partial fills allow the order to be completed gradually, making the execution process smoother.
    • Helpful in Volatile Markets: In a rapidly changing market, available quantities are executed immediately. This increases the likelihood of completing at least part of the trade before prices shift suddenly.

    Read Also: What is Futures and Options Trading in India

    Disadvantages of Partially Filled Orders 

    A partially filled order is not always advantageous. In some instances, it can complicate trading, particularly when you intend to trade a specific quantity.

    • Incomplete Order Execution: Since only a portion of the order is executed, your entire trading plan cannot be implemented at once.
    • Delay in Execution: It may take time for the remaining quantity to be executed, especially if there are insufficient buyers or sellers at the desired price.
    • Price Movement Risk: If the market price moves away from your set price, the remainder of the order might not get executed, or you may need to modify the order.
    • Portfolio Allocation May Change: If you had planned to invest a specific amount in a stock, a partial fill prevents that full investment from happening immediately, which can impact your portfolio planning.

    How to Reduce the Chances of Partial Fill? 

    While it is not always possible to prevent partially filled orders, the likelihood can be significantly reduced by keeping a few simple points in mind.

    • Trade in High-Liquidity Stocks: Select stocks that have high daily trading volumes. Since there are more buyers and sellers for these stocks, there is a greater chance of orders matching quickly.
    • Avoid Very Large Orders: If the order quantity is very large, it is better to place the order in smaller chunks rather than all at once.
    • Choose a Practical Limit Price: When placing a limit order, choose a price that is close to the current market price. This increases the chances of finding a matching order.
    • Place Orders During Active Market Hours: Trading activity is generally higher during the opening and mid-session hours of the market. Orders are more likely to be executed quickly during these times.
    • Check Market Depth Before Placing an Order: Check the market depth or order book before placing an order. This reveals the quantity available at your chosen price, enabling you to make a better decision.

    Partial Fill vs Complete Fill 

    Parameter Partial FillComplete Fill
    Execution StatusOnly a part of the order is executed.The entire order is executed at once.
    Remaining QuantitySome quantity remains pending.No quantity remains pending.
    Order CompletionIt may take time to complete.The order is fulfilled immediately.
    Liquidity RequirementIt is not necessary for the entire quantity to be available.It is essential for the entire quantity to be available.
    Trader ActionThe remaining order can be modified or cancelled if necessary.No further action is required.

    Conclusion

    Partially filled orders are a common aspect of trading, depending primarily on market liquidity and order matching. Understanding the meaning of “partially filled” or “partially executed” orders enables you to better comprehend order status and make informed trading decisions at the right time.

    S.NO.Check Out These Interesting Posts You Might Enjoy!
    1What is the Best Time Frame for Swing Trading?
    2MCX Trading: What is it? MCX Meaning, Features & More
    3Silver Futures Trading – Meaning, Benefits and Risks
    4What is Crude Oil Trading and How Does it Work?
    5What is Spread Trading?
    6What is Tick Trading? Meaning & How Does it Work?
    7What is Algo Trading?
    8What Is Day Trading and How to Start With It?

    Frequently Asked Questions (FAQs)

    1. What is partially filled in trading?

      This means only a portion of the order is executed.

    2. What does partially filled mean?

      This means the entire order was not executed at once.

    3. Is partially executed the same as partially filled?

      Yes, both mean the same thing.

    4. Why does an order become partially filled?

      This happens when the full quantity is not available.

    5. Can I cancel a partially filled order?

      Yes, the remaining pending quantity can be cancelled.

  • What is Jensen’s Alpha in Mutual funds? 

    What is Jensen’s Alpha in Mutual funds? 

    Most people picking mutual funds do the same thing. They open the app, sort by returns, and pick funds that appear at the top. Fair enough, it is the easiest number to understand. But returns alone do not tell you whether the fund manager was smart or was just lucky enough to ride a rally with a riskier portfolio than everyone else.

    That is where Jensen’s Alpha pops up. It is not a new concept; economist Michael Jensen introduced it way back in 1968, but it’s still one of the sharper metrics for figuring out whether a fund manager did his job well or not.

    About Jensen’s Alpha

    In simple terms, Jensen’s Alpha tells us, given how much risk this fund took, did it deliver more return than it should have?

    Every fund carries a certain level of risk relative to the market, and this is captured through beta. A fund with a beta of 1 more or less moves with the Nifty 50. A beta of 1.3 means it swings 30% more than the index, up in good times, down in bad ones. 

    Based on that risk level, there is a return the fund is expected to generate. Jensen’s Alpha is simply the gap between what it actually made and what it should have made.

    Positive alpha means the manager was able to beat the odds. Negative alpha, on the other hand, means the manager underperformed.

    Why was Jensen’s Alpha Introduced in the First Place?

    Back in the 1960s, mutual funds were exploding in popularity in the US, and everyone wanted to know the same thing investors want to know today: is this fund manager actually good, or did they just get lucky?

    The problem was, nobody had a clean way to answer that. Fund companies would advertise big returns, and investors had no way to tell if the returns were real or if the fund companies were simply exaggerating. 

    Michael Jensen, an economist, noticed this gap and built on the Capital Asset Pricing Model, which had come out a few years earlier through the work of William Sharpe and a couple of others. 

    CAPM was a mathematical way to say what return a portfolio should generate given its risk level. 

    Jensen took that idea one step further in 1968 and asked a very specific question in his research: across a large sample of mutual funds, were fund managers actually beating the return that their risk level would predict, or were they basically matching it, or worse?

    Now bring that forward to India. Our mutual fund industry has gone through its own version of that same problem over the last decade, hundreds of new schemes, aggressive marketing around returns, and a retail investor base that’s grown massively through SIPs but does not have the tools to separate a genuinely skilled fund manager from one who simply took on more risk during a strong market phase. 

    The exact question Jensen was trying to answer in the US in the 1960s is the same question an Indian investor today needs answered before choosing between two competing mid-cap funds.

    This is the reason why this five-decade-old formula still shows up in every mutual fund analysis you will come across.

    The Formula of Jensen’s Alpha

    Jensen’s Alpha = Rp – [Rf + Beta(Rm – Rf)]

    Rp is the fund’s actual return. 

    Rf is the risk-free rate, which in India is usually related to the 10-year G-sec yield.

    Beta is the fund’s volatility versus the market. 

    Rm is the benchmark return (Nifty 50, Sensex, whichever index the fund is measured against)

    Rm – Rf is the market risk premium 

    Interpretration 

    Alpha > 0: Portfolio generated excess returns and outperformed the market. 

    Alpha = 0: Portfolio performed exactly as expected based on its risk.

    Alpha < 0: Portfolio underperformed the market relative to the risk taken 

    Quick Example 

    Say a large-cap fund generated 14% in a year. 

    Risk-free rate was 7%, Nifty 50 gave 12%, and the fund’s beta was 1.1. 

    Now, calculate the expected return, which equals

    7% + 1.1 * (12% – 7%) = 12.5%, and 

    Alpha = 14% – 12.5% = 1.5%

    That 1.5% is the actual value the manager added, over and above what the market and the fund’s risk profile already explain.

    Read Also: A Comprehensive Guide on Mutual Fund Analysis

    Why Looking only at returns Can Be Misleading?

    Returns hide the risk story. Two funds can post very different numbers and still be equally good or bad depending on how much risk the fund manager took. 

    Take Fund A at 15% and Fund B at 13%. On a returns chart, A wins easily. But if A carries a beta of 1.4 while B carries a beta of 0.9, that comparison flips. 

    Fund A took on a lot more risk to get that extra 2%, whereas Fund B did more with less risk, which shows active management.

    Limitations of Jensen’s Alpha

    No metric is perfect, and Jensen’s Alpha also has some limitations worth knowing about before you rely on it.

    • Depends on Beta: It depends entirely on beta, which is calculated from historical data. If a fund’s strategy shifts, or markets go through a rough phase like 2020’s COVID crash or the FII outflow, that historical beta might not reflect current risk very well.
    • Fund Comparison with Different Benchmarks: The benchmark choice matters too. If a flexi-cap fund with mid and small-cap exposure gets benchmarked only against the Nifty 50, the alpha number will be changed in ways that do not reflect what the fund is actually doing. Always check whether the benchmark used matches the fund’s portfolio.
    • Past Performance is not a Guarantee: Strong alpha over the last five years does not guarantee anything about the next five years, because a change in fund manager can quietly undo years of consistent outperformance.

    Table of Differences: Jensen’s Alpha, Treynor Ratio & Sharpe Ratio

    ParameterJensen’s AlphaTreynor RatioSharpe Ratio
    Risk Measure UsedBeta (market risk)Beta (market risk)Standard Deviation (total risk)
    What It Tells YouActual excess return delivered vs expected return, given the fund’s risk levelReturn earned per unit of market risk takenReturn earned per unit of total risk taken
    Type of NumberAbsolute (e.g., 1.5%, 2.3%)Ratio (no fixed unit)Ratio (no fixed unit)
    Best Used ForJudging if the fund manager genuinely added value beyond market-linked expectationsComparing funds that are part of an already-diversified portfolioEvaluating a fund on a standalone basis
    Where to Check in IndiaValue Research, Morningstar India, select AMC factsheetsRarely shown directly on platforms; needs manual calculation using beta and returnsValue Research, Groww, ETMoney – under risk ratios
    Simple Rule of Thumb“Did the fund beat what its risk level predicted?”“How much did I earn per unit of market risk?”“How much did I earn per unit of total risk, including fund-specific swings?”

    Read Also: What is Fund of Funds (FOF)?

    Conclusion 

    At the end of the day, picking a mutual fund is not just about who topped the returns chart this year. Anyone can look good in a rally. What actually separates a skilled fund manager from a lucky one is whether they delivered more than what their risk level justified. 

    No single ratio should make or break your decision. But if you are investing money every month for 10-15 years toward a goal, a child’s education, retirement, a house down payment, it is worth spending ten extra minutes checking these numbers before you commit. That small bit of homework can be the difference between a fund that compounds your wealth and one that just happened to look good. 

    S.NO.Check Out These Interesting Posts You Might Enjoy!
    1Top Mutual Funds with No Exit Load in India
    210+ Best Investment Plan for Monthly Income in India
    3Best Gilt Mutual Funds in India
    4Best Precious Metal Mutual Funds to Invest in India
    5Best SWP for Monthly Income in India
    6What is ARN Number in Mutual Fund?
    7What Is SWP in Mutual Funds?
    8Side Pocketing in Mutual Funds Explained
    9How to Become a Mutual Fund Distributor in India

    Frequently Asked Questions (FAQs)

    1. Is Jensen’s Alpha the same as regular alpha shown on investing apps? 

      Yes. When apps show alpha under risk ratios, they are usually referring to Jensen’s Alpha, calculated using CAPM.

    2. What is a good Jensen’s Alpha for an Indian equity fund? 

      There is no fixed number, but a consistently positive alpha of 1-3% over 5+ years is generally considered good for actively managed equity funds in India.

    3. Should I avoid a fund with negative Jensen’s Alpha?

      Not immediately. Check if it is negative across multiple years or just one year, and compare it against category peers before deciding.

    4. Does SEBI mandate disclosure of Jensen’s Alpha in factsheets?

      No, it is not mandatory. Some AMCs include it voluntarily, but you will often need to check third-party platforms for a reliable figure.

    5. How often should I check a fund’s Jensen’s Alpha?

      Checking once or twice a year is enough for long-term SIP investors. There is no need to track it monthly. 

  • Global ETFs in India: Best ETFs, Returns & How to Invest

    Global ETFs in India: Best ETFs, Returns & How to Invest

    Invested in Nifty 50 or Sensex-linked funds so far? Then you are missing out on a big chunk of the world’s wealth creation. 

    If Apple, Microsoft, Nvidia, Amazon, Alphabet, none of these companies exist in your portfolio, and trading in Indian markets which is somewhat range-bound this year while US tech names keep hitting new highs, more and more retail investors are asking the same question: how do I actually get exposure to global markets from India?

    The answer, for most people, is global ETFs. They are simple, relatively low-cost, and do not require you to become an expert in picking individual foreign stocks. 

    Let us break down what they are, which ones are worth considering, and how you can actually go about investing in them.

    What are Global ETFs?

    A global (or international) ETF is basically a fund that holds a basket of stocks from outside India. They could be US tech companies, European blue chips, Chinese giants like Alibaba and Tencent, or a broad mix across multiple countries. Instead of buying 500 individual US stocks to replicate the S&P 500, you just buy one ETF unit and get proportional exposure to all of them.

    Ways to Invest in Global ETFs in India

    Route 1: NSE-Listed International ETFs 

    These are Indian mutual fund houses that have structured ETFs to track foreign indices, then listed them on our own exchanges. You buy and sell them in rupees, through your regular demat account. 

    Route 2: Direct Investing via LRS

    You can invest using the RBI’s Liberalised Remittance Scheme, which currently allows Indian residents to remit up to USD 250,000 per financial year for approved purposes, including investing.

    It works in a way that you open an account with a platform that gives you access to US or global exchanges, complete your KYC, and then transfer money from your Indian bank account under LRS

    List & Key Details to Invest in Global ETFs 

    FundsBase Expense Ratio (%)Launch DateNet Assets (Cr)Latest NAV52-Week High NAV52-Week Low NAVFund Manager (Tenure)
    Motilal Oswal NASDAQ 100 ETF0.52011-03-2914,112273.38285.46191.8Swapnil P Mayekar (0.8), Dishant Mehta (0.8)
    Mirae Asset NYSE FANG+ ETF0.62021-05-063,882163.68173.65123.03Siddharth Srivastava (5.2)
    Mirae Asset S&P 500 Top 50 ETF0.562021-09-201,09665.8568.9950.72Siddharth Srivastava (4.9)
    Nippon India ETF Hang Seng BeES0.792010-03-09964438481.65385.37Kinjal Desai (8.1), Amber Singhania (0.3), Vikash Agarwal (1.3)
    Mirae Asset Hang Seng TECH ETF0.532021-12-0635119.1625.3117.79Siddharth Srivastava (4.7)
    Motilal Oswal Nasdaq Q50 ETF0.42021-12-23180118.93122.774.44Rakesh Shetty (3.6), Swapnil P Mayekar (0.8), Dishant Mehta (0.8)
    (Data as of July 14th, 2026)

    Returns of Global ETFs

    Funds1 Yr Ret (%)3 Mth Ret (%)6 Mth Ret (%)
    Mirae Asset Hang Seng TECH ETF-0.33-0.52-15.64
    Mirae Asset NYSE FANG+ ETF30.517.6916.57
    Mirae Asset S&P 500 Top 50 ETF29.989.439.31
    Motilal Oswal NASDAQ 100 ETF42.9818.2120.7
    Motilal Oswal Nasdaq Q50 ETF6017.6929.93
    Nippon India ETF Hang Seng BeES14.1-2.17-3.44
    (Data as of July 14th, 2026)

    Read Also: Best IT ETFs in India

    Overview of Best Global ETFs to Invest in India

    1. Motilal Oswal NASDAQ 100 ETF

    • Category: Equity, Global US Technology
    • AUM stood at around ₹14,112 Cr as of June 30, 2026
    • This one tracks the top 100 non-financial companies on the Nasdaq, so you are basically getting a slice of America’s biggest tech and growth names
    • Nvidia, Apple, and Microsoft make up a good chunk of the top holdings
    • There is also decent exposure to communication services and consumer discretionary.
    • You can start with as little as ₹500
    • It is a very high-risk fund, treat it as a satellite holding, not your core portfolio

    2. Mirae Asset NYSE FANG+ ETF

    • Category: Equity, Global – Thematic Tech
    • AUM was around ₹3,382 Cr as of June 30th, 2026
    • Fairly concentrated fund with just 10 stocks, almost equally weighted, all big US tech and internet names
    • Meta, Nvidia, Tesla, Amazon and Netflix are among the top names here
    • Minimum investment amount is ₹5,000
    • Risk here is very high given how concentrated it is, works better as a small, high-conviction addition than a core holding

    3. Mirae Asset S&P 500 Top 50 ETF

    • Category: Equity, Global – US Large Cap
    • AUM came in at roughly ₹1,096 Cr as of June 30, 2026
    • Unlike the two above, this spreads across the 50 largest S&P 500 companies, so it is not just tech-heavy
    • Apple, Microsoft, Nvidia and Amazon still show up among the top holdings, but you also get financials, healthcare, and consumer names in the mix
    • Minimum investment is ₹5,000
    • Still high risk being an equity fund, but comparatively more diversified than its tech-focused peers

    4. Nippon India ETF Hang Seng BeES

    • Category: Equity, Global, Hong Kong/China
    • AUM is ₹964 Cr
    • It tracks the Hang Seng Index, giving you exposure to Hong Kong-listed companies
    • Tencent, HSBC Holdings, and AIA Group feature among the top holdings
    • Finance and retail trade dominate the portfolio, along with a bit of tech
    • Minimum Investment amount is ₹10,000
    • Carries very high risk, and there’s the added layer of China-related regulatory unpredictability to keep in mind

    5. Mirae Asset Hang Seng TECH ETF

    • Category: Equity, Global, China Tech Thematic
    • AUM was ₹351 Cr as of June 30, 2026
    • This tracks the top 30 tech-themed companies listed in Hong Kong 
    • Alibaba, Meituan, and Xiaomi are among its top holdings
    • Minimum investment starts at ₹5,000
    • Very high risk since it is concentrated and can react sharply to Chinese regulatory news

    6. Motilal Oswal Nasdaq Q50 ETF

    • Category: Equity, Global, US Emerging Growth
    • AUM stood at around ₹180 Cr as of June 30, 2026
    • Top Holdings here tend to be earlier-stage, faster-growing names that have not yet reached large-cap status
    • Beyond pure tech, there is also a mix of newer consumer and growth-stage businesses too
    • You can start investing with just ₹500
    • Very high risk, and it is also less liquid than the other funds on this list

    How to Invest in Global ETFs through Pocketful 

    1. Open your Account: If you do not have an account on Pocketful, you will need to open a demat account, which is free and has zero account opening charges and zero AMC. The KYC takes maybe 5-10 minutes: PAN, Aadhaar, bank details, and a quick video verification. 
    2. Search for the ETF: Once you log in to the app, there is a search bar at the top. Enter the name of the ETF you want to invest in.
    3. Click on the Name: You will be redirected to a page where the key details like the current price, day performance, and technical overview of the selected ETF are mentioned
    4. Select Buy Option: Once you click the buy option, you need to choose what suits you best: long-term investing, intraday trading, or buy now pay later. The choice is yours. 

    Read Also: Best ETFs in India to Invest

    Conclusion 

    In the end, we suggest you not put your entire portfolio into global ETFs just because US markets have been on a tear lately. 

    A reasonable allocation for most Indian investors is usually somewhere between 10-20% of their overall equity portfolio, depending on age, goals, and how much currency risk you are comfortable carrying.

    Global diversification is not about abandoning India as an investment destination. Indian markets have their own long-term growth story, and global ETFs simply let you participate in the world’s other growth stories at the same time.

    S.NO.Check Out These Interesting Posts You Might Enjoy!
    1Small-Cap ETFs to Invest in India
    2Best Energy ETFs in India
    3Best Silver ETFs in India
    4List of Best Gold ETFs in India
    5Best Debt ETFs to Invest in India

    Frequently Asked Questions (FAQs)

    1. Can I invest in global ETFs without opening a foreign account?

      Yes. You can buy NSE-listed international ETFs from your regular Indian demat account, in rupees.

    2. Do I have to pay TCS every time I invest in a global ETF? 

      If you are sending money abroad directly. TCS of around 20% kicks in on the amount above ₹10 lakh in a financial year, and you can claim it back when filing your ITR.

    3. How much of my portfolio should go into global ETFs? 

      There is no fixed rule, but many advisors suggest somewhere between 10-20% of your equity allocation, just for diversification  

    4. Are global ETFs risky? 

      They carry the usual market risk and currency risk. It is not high risk in the way a single stock is, but it is not risk-free either.

    5. Is there a limit to how much I can invest abroad? 

      Under RBI’s LRS rules, you can remit up to USD 250,000 per financial year for investments.

  • What is Pyramid Trading?

    What is Pyramid Trading?

    Have you ever sold a stock at a decent profit, only to watch it climb another 20-30% in the weeks after? It happens to almost every trader, whether you have been trading for a decade or you opened your Demat account last month. The call itself was right. The exit, not so much. This is the gap that pyramid trading is built to close.

    It is not a new idea. Let us break down what pyramid trading actually is, how it works, and how it fits into the Indian market context specifically.

    Pyramid Trading – An Overview 

    In simple terms, Pyramiding is a strategy wherein you gradually increase your position size as a stock or index keeps moving in your favour. Instead of putting your entire capital into a trade at once and just waiting, you add to it in stages as the trade starts performing well.

    In simple terms, pyramiding is a strategy in which you gradually increase your position size as a stock or index continues in your favour. Instead of putting your entire capital into a trade at once and just waiting, you add to it in stages as the trade starts performing well.

    Note: 

    Pyramiding and averaging are two different concepts.

    Averaging means buying more of a stock as it falls, to bring your average cost lower. 

    Pyramiding is the opposite; you add only when the trade is already working in your favour, and not when it’s going against you. 

    How does it work? 

    Say you buy 100 shares of  X at ₹600, expecting a move in the auto sector. The stock climbs to ₹700. 

    In a pyramiding approach, you would add another 80 shares here, once your original view is confirmed by price action.

    The stock keeps climbing and hits ₹800. You add 50 more shares. Your total position is now 230 shares, with an average cost of roughly ₹678.

    When the stock reaches ₹900 and you exit the entire position:

    • Sale value: 230 * ₹900 = ₹2,07,000
    • Total cost: approximately ₹1,56,000
    • Profit: around ₹51,000

    If you would have stuck with just the original 100 shares and sold them at ₹900, your profit would have been ₹30,000. That is the difference pyramiding makes. 

    Types of Pyramid Trading 

    1. Standard Pyramid

    The largest position goes in first, followed by smaller additions. This is considered the more conservative version.

    2. Inverted Pyramid

    Every addition is the same size as the first. This is more aggressive, if the trend reverses, your average cost rises quickly.

    3. Reflecting Pyramid

    You add up to a certain level, and after that, regardless of whether the trend continues, you start booking profits gradually. It does a better job of protecting capital.

    4. Maximum-Leverage Pyramid

    The most aggressive version, where a trader uses accumulated profits and available margin to build as large a position as possible. It also carries the highest risk.

    Read Also: What is Futures and Options Trading in India

    When Should You Avoid Pyramiding in Trading 

    Knowing when to hold back is just as important as knowing when to add. Below are the situations where it is better to sit back and relax

    1. Big events on the calendar 

    Budget day, RBI policy announcements, quarterly results are some moments when prices can gap up or down without warning. You might find a beautiful trend one evening, and by the next morning’s opening bell, a surprise announcement has blown straight past your stop loss. Adding a fresh lot right before something like this is asking for trouble.

    2. Low-liquidity stocks 

    Not every stock trades with high volume. In thinly traded counters, even a small order can move the price against you, and getting out in a hurry becomes a real problem. If your addition is going to eat into a big chunk of the day’s volume, you are not really pyramiding 

    3. When it breaks your concentration limit 

    This one gets ignored a lot. Say you have decided, sensibly, that no single stock should be more than 15% of your portfolio. A trade is working great, and it is tempting to keep adding. The rule you set for yourself on a calm day should still apply on an exciting one.

    4. Volume is not backing the move 

    If the price is rising but volumes are drying up, that is usually the market telling you the move is running out. Adding into a rally with fading volume is a bit like cheering for a team that is already losing energy on the field.

    Advantages of Pyramid Trading 

    • Capturing the full trend: The biggest benefit is that you capture a strong trending move in full, instead of getting spooked by small pullbacks and exiting too early.
    • Compounding effect: As your position grows, profits compound along with it, in a strong trend stock, this can boost overall returns.
    • Better risk control, when done right: Since you build the position gradually, your initial risk is relatively small, you are never putting your full capital at risk in one shot.
    • Flexibility: You can scale your position size up or down based on how the market is actually behaving, add more if the trend is strong, hold back the moment it shows signs of weakening.

    Risks Involved in Pyramid Trading

    • It needs a sustained trend: This strategy only really works when price moves consistently in one direction. In a sideways or choppy market, pyramiding adds little value and mostly just add up to the transaction costs.
    • It demands more capital: Every additional entry requires fresh funds or margin, which is not always available to every trader at the moment it is needed.
    • Reversal risk: The biggest danger is that if the trend turns against you, losses can build up just as fast as profits did.
    • The overtrading trap: A lot of newer traders use pyramiding as an excuse to trade more than they should. Adding on every small upward tick is not discipline, it is greed wearing a strategy’s clothing.

    Common Mistakes Indian Retail Traders Make 

    • No pre-planned position sizing: Traders start pyramiding without deciding in advance how many levels they will add at or what size each addition should be. Every add-on is usually triggered by “the market looks good right now” rather than a defined plan. Without this groundwork, position sizing turns inconsistent and hard to control.
    • No spreadsheet or written plan: A simple spreadsheet noting entry levels, addition sizes, and the final exit point removes the guesswork. When the numbers are written down before the trade begins, it is much harder for emotions to creep into decisions.
    • Ignoring the tax angle entirely: Frequent additions and partial exits mean short-term capital gains (STCG) tax applies on every single transaction. This is often overlooked until tax filing season.
    • Not accounting for FIFO: Under the First In First Out (FIFO) rule, your oldest lots get sold first, regardless of which lot you intend to exit. This affects which purchase price gets matched against which sale, and can change your taxable gain from what you expected.

    Read Also: Supply and Demand Trading Strategy

    Conclusion 

    Pyramid trading is a useful tool for traders who want to scale their exposure mindfully during strong trending markets. But it is not a guaranteed profit formula. Without discipline, proper risk management, and an exit plan, it can turn into a disaster just as quickly as it creates a winning position.

    If you are just starting, begin with the standard pyramid approach, smaller additions, strict stop losses, and defined profit-booking levels. Once you experience trading in the trending markets, consider the more aggressive versions.

    Proper market research, risk assessment, and a clear view of your own financial situation should guide every trading decision you make.

    S.NO.Check Out These Interesting Posts You Might Enjoy!
    1What is the Best Time Frame for Swing Trading?
    2MCX Trading: What is it? MCX Meaning, Features & More
    3Silver Futures Trading – Meaning, Benefits and Risks
    4What is Crude Oil Trading and How Does it Work?
    5What is Spread Trading?
    6What is Tick Trading? Meaning & How Does it Work?
    7What is Algo Trading?
    8What Is Day Trading and How to Start With It?

    Frequently Asked Questions (FAQs)

    1. Is pyramid trading only for experienced traders? 

      Not exactly. Beginners can try it too, just start small and keep the position sizes small.

    2. How is pyramiding different from just buying more of a stock I already own? 

      The timing is the difference. Pyramiding means adding only when the trade is already moving in your favour.

    3. Does pyramiding work in a falling market too? 

      Yes, the same logic applies on the short side. You add to a short position as the stock keeps falling, instead of holding one fixed quantity.

    4. Do I need a lot of capital to pyramid? 

      Yes. You need enough margin or funds set aside for additional entries.

    5. How many times should I add to a position? 

      There is no fixed number. Most traders cap it at two or three additions, just so the position does not get too large or too hard to manage.

  • Top Mutual Funds with No Exit Load in India

    Top Mutual Funds with No Exit Load in India

    At the time of investment in a mutual fund, most of the investors look for returns, risk, etc. But at the time of exit, the small fee known as “Exit Load” often plays a key role. This fee is applicable to most of the mutual funds, but there are certain funds that do not charge any exit load.

    In today’s blog post, we will give you an overview of a list of mutual funds with no exit load.

    What are Exit Loads?

    An exit load is a type of fee that is charged by asset management companies when an investor redeems or withdraws their investments before a stipulated time period. The fee is generally in the form of a percentage and deducted from the amount of redemption. It is imposed to discourage frequent buying and selling of mutual funds and to help fund managers maintain stability in the portfolio.

    Example of Exit Load

    Let’s understand the exit load through an example.

    Mr A has invested 1 Lakh in a mutual fund scheme. The exit load in the scheme is 1% if the switch or redemption is placed within 365 days. He invested on 1st Jan 2025, but due to unfortunate circumstances, he redeemed the amount, which was valued around 1,10,000 INR on 8th October 2025.

    As he was redeeming before 365 days, he will be liable to pay exit load. It is calculated on the redemption amount of 1,10,000 INR.

    Exit Load = 1% * 1,10,000 = 1100 INR

    The final amount received by Mr A will be calculated as follows:

    1,10,000 – 1100 = 1,08,900 INR.

    Top Mutual Funds with No Exit Load

    Fund Name1 Month Return3 Months Return6 Months Return1 Year ReturnAUM
    WhiteOak Capital Mid Cap Fund 4.0616.475.5311.25732
    DSP Natural Resources and New Energy Fund -3.62-0.193.8716.622457
    White Oak Capital Special Opportunities Fund 5.3817.685.698.251601
    UTI Nifty 500 Value 50 Index Fund -2.354.181.8612.86775
    WhiteOak Capital Pharma and Healthcare Fund 5.8220.1113.7416.71664
    Kotak Nifty Commodities Index Fund -1.785.942.739.96298
    Navi Nifty India Manufacturing Index Fund 1.8911.552.329.4676
    Nippon India Nifty Auto Index Fund 4.7812.63-4.2714.6245
    UTI Nifty India Manufacturing Index Fund 1.9211.632.249.3329
    DSP Nifty Healthcare Index Fund 6.0416.638.6810.520
    (Data as of 07th July 2026)

    Overview of Mutual Funds with No Exit Load

    The overview of mutual funds with no exit load is as follows:

    1. WhiteOak Capital Mid Cap Fund

    The fund was launched in September 2024 and is an actively managed scheme that focuses on mid-sized companies having strong growth potential. As the fund invests in mid-cap stocks, it carries high risk and comes with higher volatility. But in the long run, it also posts higher returns.

    2. DSP Natural Resource and New Energy Fund

    This fund was introduced in 2025 and is thematic in nature. It primarily invests in companies engaged in the natural resource and energy sector, such as oil and gas, metals, etc. As this is a sectoral fund, it is highly sensitive to global commodity prices. This fund is suitable for investors having a high-risk profile.

    3. WhiteOak Special Opportunity Fund

    This is another thematic fund offered by WhiteOak Asset Management Company, and it was introduced in December 2024. The fund invests in special opportunity arises in the economy, that include changes in policy, business transformation, etc. These opportunities arise because of changing economic trends and unique investment opportunities.

    4. UTI Nifty 500 Value 50 Index Fund

    This is a passive fund that tracks the performance of the Nifty 500 Value 50 index, which consists of 50 stocks that are selected from the Nifty top 500 stocks list. The fund manager has limited involvement in the performance of this fund. It is suitable for cost-conscious investors.

    5. WhiteOak Capital Pharma and Healthcare Fund

    Similar to other WhiteOak funds, it was also introduced in 2024. This sectoral fund invests in companies that are primarily engaged in pharmaceutical, hospital, and other healthcare services, etc. This is suitable for investors seeking growth opportunities in the healthcare sector.

    6. Kotak Nifty Commodities Index Fund

    This is a passive index fund launched in 2025, primarily investing in an index that tracks the prices of companies linked to commodities. The performance of the commodities sector is cyclical in nature; hence, it is suitable for investors who want exposure to the commodities theme and have a high risk appetite.

    7. Navi Nifty India Manufacturing Index Fund

    This fund was launched by Navi Mutual Fund in November 2024, and it tracks the Nifty India Manufacturing Index. This index includes companies engaged in the manufacturing sector, such as industries, auto, capital goods, etc. This fund offers investors an opportunity to take exposure in the manufacturing sector at a lower cost.

    8. Nippon India Nifty Auto Index Fund

    The portfolio of this index fund includes companies from the auto sector, including two- and four-wheeler manufacturers. Investing in this fund can help an investor by taking advantage of rising demand for vehicles, etc. However, this fund is highly volatile in nature because of changing government policies.

    9. UTI Nifty India Manufacturing Index Fund

    This passive fund replicates the performance of the Nifty manufacturing index. Because of its passive investment approach, stock picking is not done by the fund manager. Investing in it allows an investor to participate in the manufacturing sector of India.

    10. DSP Nifty Healthcare Index Fund

    The portfolio of the DSP Nifty Healthcare Index Fund includes companies from pharma, hospitals, and diagnostic centres, etc. This fund was launched in June 2024. This fund is suited for investors who want to take exposure in the healthcare industry.

    Read Also: Best Passive Mutual Funds in India

    Mutual Funds with No Exit Load vs Mutual Funds with Exit Load 

    Before investing, compare mutual funds with no exit load and those with an exit load to understand their impact on liquidity, redemption costs, and long-term investment planning.

    BasisMutual Funds with No Exit LoadMutual Funds with Exit Load
    Exit ChargesNo exit load is charged on redemption.Exit load is charged if units are redeemed before the specified period.
    LiquidityOffers higher liquidity as investors can withdraw funds without any penalty.Liquidity is comparatively lower due to the applicable exit load on early redemption.
    Portfolio RebalancingInvestors can rebalance their portfolio freely without additional costs.Frequent portfolio rebalancing may result in exit load charges.
    Investment HorizonSuitable for investors with short- to medium-term investment needs or uncertain cash flow requirements.Better suited for investors with a long-term investment horizon.
    Cost of RedemptionNo additional redemption cost is involved.Early redemption reduces the amount received due to the applicable exit load.
    Best Suited ForInvestors looking for flexibility, liquidity, and easy access to their money.Investors who intend to stay invested for the recommended holding period and avoid premature withdrawals.

    Why One Should Invest in Funds with No Exit Load

    The key reason why one should invest in mutual funds having no exit load is as follows:

    1. No Redemption Cost: When exit costs are applicable to a fund, it reduces the amount that an investor receives at the time of redemption. Therefore, investing in a fund that has no exit load can avoid unnecessary cost.
    2. Rebalancing: Having an investment in a fund that has no exit load allows you to easily rebalance your portfolio based on market dynamics. Regular rebalancing is also essential while investing in market-linked securities.
    3. Higher Liquidity: The key advantage of investing in a no-exit load fund is that it allows you to redeem your investment without paying any penalty. It offers higher liquidity for investors.

    Conclusion

    On a concluding note, investment in a mutual fund having zero exit load is a smart choice for the investor seeking liquidity. This fund can help an investor regularly rebalance their portfolio based on different market conditions. However, choosing funds with zero exit load should not be the only parameter to select the fund; there are various other factors, such as fund manager performance, investment horizon, etc., before investing in funds. One should consult their investment advisor before investing in a mutual fund.

    S.NO.Check Out These Interesting Posts You Might Enjoy!
    1Best Long-Term Mutual Funds to Invest in India
    210+ Best Investment Plan for Monthly Income in India
    3Best Gilt Mutual Funds in India
    4Best Precious Metal Mutual Funds to Invest in India
    5Best SWP for Monthly Income in India
    6Best Mid-Cap Mutual Funds in India
    7Best Target Maturity Mutual Funds in India
    8Best Infrastructure Mutual Funds in India
    9How Interest Rates Impact Mutual Funds in India
    10Best SIP Mutual Funds in India

    Frequently Asked Questions (FAQs)

    1. Do all mutual funds have an exit load?

      No, not all mutual funds charge an exit load.

    2. Where to check the exit load of a mutual fund?

      To check the exit load of a mutual fund, one can visit the website of the asset management company and check for the factsheet, KID, SID, etc. of a fund.

    3. Is it possible that the exit load can change?

      Yes, it is possible that the exit load of a fund can be revised by the asset management company.

    4. Why are mutual fund charges exit loads?

      The asset management company charges an exit load because they want investors to discourage redeeming their investment too frequently and maintain portfolio stability.

    5. Is there any exit load in ELSS mutual funds?

      No, there are no exit load in ELSS mutual funds, but these funds come with a mandatory lock-in period of 3 years.

  • Open Free Demat Account

    Join Pocketful Now

    You have successfully subscribed to the newsletter

    There was an error while trying to send your request. Please try again.

    Pocketful blog will use the information you provide on this form to be in touch with you and to provide updates and marketing.