ICICI Prudential Asset Management Company (AMC), one of India’s leading mutual fund houses backed by ICICI Bank and Prudential Plc, is launching an initial public offering (IPO) to raise ₹10,602.65 crore.The issue opens for subscription on December 12, 2025, and will close on December 16, 2025, with a price band fixed at ₹2,061 to ₹2,165 per share.The IPO is a book-built issue and comprises entirely an offer for sale (OFS) of 4.90 crore shares, aggregating to ₹10,602.65 crore, by existing shareholders. There is no fresh issue component in the offer.The shares are proposed to be listed on both the Bombay Stock Exchange (BSE) and the National Stock Exchange of India (NSE), with tentative listing scheduled for December 19, 2025, subject to allotment and regulatory approvals.
ICICI Prudential AMC IPO Day 3 Subscription Status
On Day 3, the ICICI Prudential AMC IPO witnessed strong overall demand, closing with a total subscription of 39.17 times. The issue was led by Qualified Institutional Buyers (QIBs), who subscribed 123.87 times, highlighting solid institutional confidence. The Non-Institutional Investor (NII) segment was subscribed 22.04 times, with bNII (above ₹10 lakh) at 25.42 times and sNII (below ₹10 lakh) at 15.27 times. Retail Individual Investors (RII) showed moderate participation with a 2.53 times subscription. There was no employee reservation in the issue. Overall, the IPO attracted 55,02,359 applications, with a total bid value of ₹2,96,915.86 crore, underscoring significant investor interest driven primarily by institutional participation.
Investor Category
Subscription (x)
Qualified Institutional Buyers (QIB)
123.87
Non-Institutional Investors (NII)
22.04
bNII (above ₹10 lakh)
25.42
sNII (less than ₹10 lakh)
15.27
Retail Individual Investors (RII)
2.53
Employees
–
Total Subscriptions
39.17
Total Applications: 55,02,359
Total Bid Amount (₹ Crores): 2,96,915.86
How to Check ICICI Prudential AMC IPO Allotment Status
ICICI Prudential AMC IPO allotment can be easily checked online in two ways: from the Registrar’s website and from the BSE or NSE website. This IPO will be listed on both the exchanges – BSE and NSE, so the allotment status will be available to all investors on both platforms.
Since the ICICI Prudential AMC IPO is a 100% Offer for Sale (OFS), the company will not receive any proceeds from the issue. The entire IPO proceeds will be received by the selling shareholders, and no funds will be utilized by ICICI Prudential AMC for business expansion, capital expenditure, or other corporate purposes.
ICICI Prudential AMC IPO GMP – Day 3 Update
The grey market premium (GMP) of ICICI Prudential AMC IPO is ₹33 as of 5:00 PM on December 16, 2025. The upper limit of the price band is ₹2165, and based on the current GMP, the estimated listing price is ₹2495, indicating a potential gain of approximately 15.24% per share.
Date
GMP
Est. Listing Price
Gain
16-12-2025 (Day 3)
₹330
₹2495
15.24%
Disclaimer: The above GMP (Grey Market Premium) is just unofficial market information, which is not officially confirmed. These figures are shared for informational purposes only and investment decisions based on these should be based on the investor’s own research and discretion. We do not conduct, recommend or support any kind of transaction in the grey market.
ICICI Prudential AMC IPO – Key Details
Particulars
Details
IPO Opening Date
December 12, 2025
IPO Closing Date
December 16, 2025
Issue Price Band
₹2061 to ₹2165 per share
Total Issue Size
4,89,72,994 shares(aggregating up to ₹10,602.65 Cr)
Important Dates for ICICI Prudential AMC IPO Allotment
Event
Date
Tentative Allotment
December 17, 2025
Refunds Initiation
December 18, 2025
Credit of Shares to Demat
December 18, 2025
Listing Date
December 19, 2025
ICICI Prudential AMC Overview
ICICI Prudential Asset Management Company (AMC) is one of India’s leading and most trusted mutual fund houses, offering a wide range of investment solutions across equity, debt, hybrid, and passive products. Backed by ICICI Bank and Prudential Plc, the company leverages strong brand equity, deep distribution reach, and disciplined investment processes to serve millions of retail and institutional investors.
Operating in a rapidly expanding financial savings market, ICICI Prudential AMC uses data-driven research, technology-enabled platforms, and robust risk management systems to enhance portfolio performance and client experience. With a strong presence across urban and semi-urban regions, the AMC benefits from rising financialization of household savings. As it continues to grow, the company remains focused on long-term wealth creation, operational efficiency, and maintaining leadership in India’s asset management industry.
Frequently Asked Questions(FAQs)
What is the opening and closing date of the ICICI Prudential AMC IPO?
ICICI Prudential AMC IPO is open on December 12, 2025 and will close on December 16, 2025.
What is the price band of the ICICI Prudential AMC IPO?
Its price band is fixed from ₹2061 to ₹2165 per share.
What is the GMP (Grey Market Premium) of the ICICI Prudential AMC IPO today?
The GMP on December 16, 2025 is ₹330, which leads to a possible listing price of ₹2495.
What is the total issue size of the ICICI Prudential AMC IPO?
The total issue size of the ICICI Prudential AMC IPO is ₹10,602.65 crore, structured entirely as an Offer for Sale (OFS) by existing shareholders, with no fresh issue component.
What is the expected listing date of the ICICI Prudential AMC IPO?
This IPO is expected to be listed on BSE and NSE on December 19, 2025.
It’s often seen that new investors put all their money into a single stock or fund. As soon as the market falls, the entire portfolio is devastated, and panic ensues. However, investors who have divided their money across different assets such as equity, debt, or gold experience significantly lower losses and more stable returns. This is diversification. In this article, we’ll explain, in simple terms, what diversification is, why it’s important, and how to properly implement it in your portfolio.
What Is Diversification?
Diversification means dividing your investments into different assets such as equities, debt, gold, real estate, or international markets so that the poor performance of one investment doesn’t impact the entire portfolio. This is a professional risk-management strategy considered essential by financial planners and global investors.
Easy Real-Life Explanation : Just as we don’t rely solely on a single source of income, it’s wise to spread our investments across multiple options. If one part falls, the remaining investments can absorb it. This limits losses and makes returns more stable.
Why Diversification Works: The Logic & Science Behind It
Spreading Risk Across Different Assets:
Diversification works because each asset reacts differently to market events. Equities boost economic growth, while gold provides protection in uncertain environments. Debt instruments add stability. Different behaviors together reduce the overall risk of a portfolio.
Low Correlation Makes a Portfolio Stable:
The core science of diversification is based on “correlation.” If the movements of two assets are not identical (low correlation), then when one asset falls, the other balances the portfolio. This results in significantly lower volatility in a diversified portfolio.
Data-Backed Stability:
Even in recent market periods, multi-asset portfolios have shown more stable returns than single-asset portfolios. During equity declines, gold and high-quality debt limited the downside, significantly reducing the overall portfolio impact.
Types of Diversification
1. Asset Class Diversification
The first and most important way to invest is to divide your money into different assets—such as equity, debt, and gold. Equity provides growth, debt provides some stability, and gold anchors your portfolio during uncertain times. A simple mix of these three makes your returns more stable and prevents major losses during downturns.
2. Sector Diversification
Many people invest their entire investment in a single sector, such as banking or IT. This creates problems when that sector is underperforming for some reason. Therefore, it’s better to spread your money across different sectors such as FMCG, Auto, Pharma, and Financials so that a decline in one sector doesn’t derail the entire portfolio.
3. Market-Cap Diversification
Large-cap companies are more stable, mid-caps have good growth potential, and small-caps can deliver large long-term returns, but they also carry higher risk. A balanced mix of these three provides both strength and growth to a portfolio. Relying on just one category often proves to be wrong.
4. Geographic Diversification
The entire world doesn’t revolve around just one country. If all investments are concentrated in the Indian market, local events will directly impact the portfolio. A little global exposure such as US tech, international index funds provides both new growth themes and currency diversification to the portfolio.
5 Time Diversification (SIP Approach)
Perfectly timing the market is almost impossible. The advantage of SIP is that investments are made at different times and at different prices, which naturally leads to a correct average cost. This keeps long-term investing smooth and disciplined.
Portfolio Diversification: How to Create a Balanced Portfolio?
Identify Risk Profile : First, it’s important to understand how much risk your personality and financial situation allow. If your income is stable and your goals are long-term, you can invest more in equities. However, if you need money quickly, it’s best to have a slightly higher share of safer assets, such as debt and gold. Your risk profile determines your portfolio’s direction.
Determine Core Asset Allocation : A balanced portfolio always relies on three things equity, debt, and gold. Equity increases wealth over the long term, debt reduces volatility, and gold provides support during difficult times. When these three are present in the right proportion, the portfolio is neither too risky nor too vulnerable.
Spread Sector Exposure : When investing in equities, it’s important not to focus solely on a single sector. Some years, banking performs well, others, IT, and sometimes FMCG or healthcare remain stable. If your investments are spread across different sectors, weakness in one sector won’t drag down the entire portfolio. This is true sector diversification.
Avoid Concentration Risk : Many people over-invest in a single stock or theme. The problem arises when that sector declines, impacting the entire portfolio. A better approach is to diversify your funds in smaller amounts so that all the risk isn’t concentrated in one place. This makes your portfolio more stable and reliable.
Sample Balanced Portfolios :
Investor Type
Equity
Debt
Gold
Suitable For
Conservative
20–30%
60–70%
5–10%
Low-risk investors, short-term goals
Moderate
50–60%
30–40%
10%
Medium-risk investors, 5+ years horizon
Aggressive
70–80%
10–20%
5–10%
High-risk investors, long-term growth
Diversification in Mutual Funds
What is Diversification in Mutual Funds?
Diversification in mutual funds means that your money is invested not in a single asset, but across multiple companies, sectors, and sometimes even different asset classes. When you invest in a mutual fund, that fund invests in dozens of stocks or bonds according to its rules. This way, your risk is not limited to a single company or sector.
How does diversification work in mutual funds?
Diversification works well in mutual funds because each scheme’s portfolio is already spread. An equity fund invests in different industries such as banking, IT, pharmaceuticals, auto, and FMCG. Debt funds also select bonds of different quality and maturity. Due to this wide spread, if one sector declines, other sectors balance the portfolio. This makes mutual funds the easiest and most automatic diversification method for beginners.
What to keep in mind when diversifying mutual funds?
Diversification in mutual funds is effective only when schemes are chosen thoughtfully. Buying similar funds repeatedly increases overlap, not diversification. A balanced mix of large-cap, flexi-cap, mid-cap/multi-cap, and an international or gold fund makes a portfolio more robust. A debt or hybrid fund adds some stability. Having too many schemes makes a portfolio bulky and confusing; fewer, but the right schemes prove more effective.
Ideal Mutual Fund Mix
Category
Role
Why it matters
Flexi-cap / Large-cap Fund
Core stability + long-term growth
Gets broad market exposure
Mid-cap or Multi-cap Fund
Growth potential
Boosts returns
International / Global Fund
Geographic diversification
Does not allow the portfolio to depend only on India
Debt / Short-term Fund
Stability + liquidity
Controls volatility
Gold Fund / Gold ETF
Protection
Provides safety in market uncertainty
Myths & Misconceptions About Diversification
Myth 1: More funds mean more diversification
The truth is that many funds invest in similar stocks. This doesn’t spread the portfolio, but rather increases overlap. Diversification always comes from different exposures, not the number of funds.
Myth 2: Diversification reduces returns
Diversification doesn’t reduce returns, but rather helps cushion large drawdowns. Long-term, stable and consistent performance is achieved, which is more sustainable.
Holding Too Many Funds or Stocks : Many people think that the more funds they have, the more diversification they achieve. In reality, this isn’t the case. Having too many schemes increases overlap and fragments the portfolio. A smaller number of well-selected funds is preferable.
Chasing Trending Stocks : The sudden popularity of a theme or stock in the market doesn’t mean the entire portfolio should be focused on it. Taking trending bets without balance significantly increases risk. Make every allocation according to your risk profile.
Ignoring an Emergency Fund : Diversification isn’t limited to equity or mutual funds. Not having an emergency fund can force investors to sell at the wrong time when the market falls. Keeping a small cushion in a liquid or short-term debt fund protects the portfolio.
Avoiding International Exposure as Risky : Global exposure has become essential for a portfolio because not all growth occurs in India. A small international allocation provides currency protection and access to new sectors (such as global tech). Avoiding it completely makes diversification incomplete.
Considering Crypto a Safe Hedge : Treating crypto as a hedge is a big mistake, as its volatility is not like that of gold or debt. Crypto is a speculative asset and should only be a small, controlled part of a portfolio and only if the investor understands its risks.
Conclusion
Diversification acts as a reliable shield for any investor. When money is spread across different assets, sectors, and markets, a portfolio not only remains more stable but also grows better over the long term. The right balance, limited but thoughtfully selected funds, and periodic rebalancing these three things make a portfolio strong. Whether you’re just starting out or already investing, it’s wise to build a well-diversified portfolio rather than chasing returns.
S.NO.
Check Out These Interesting Posts You Might Enjoy!
Car demand in India is growing rapidly in 2025. Passenger vehicle sales increased by over 17% in October 2025, with the significant impact of the GST reduction on small cars from 28% to 18%. Lower prices have led people to take out more loans to purchase new cars. In this environment, it’s important to know the best banks for car loans in India in 2025, their interest rates, and their easiest processing options. This blog will provide clear and practical answers to these questions.
What is a Car Loan?
A car loan is a financial product where a bank or NBFC lends you money to buy a new or used car. You repay this amount in EMIs, which include factors such as interest rate, processing fees, loan term, and down payment. Faster digital processing has made getting a car loan even easier in 2025 many banks now offer instant pre-approval.
Best Car Loan in India 2026
S.No
Bank Name
Interest Rate Range
Processing Fee / Other Charges
1
State Bank of India (SBI)
8.65 % – 9.45 % (New Car)
0.40% of loan amount (Min ₹750; Max ₹10,000 + GST)
2
HDFC Bank
9.40% p.a. onwards
1.00% of the loan amount (minimum of Rs.3,500 and maximum of Rs.9,000)
Processing fee: 0.25% of loan amount (min ₹1,000, max ₹5,000)
5
Bank of India
7.85% p.a. onwards
1% of loan amount; subject to a minimum of Rs.500 and maximum of Rs.10,000
6
Indian Overseas Bank
7.35%–11.30%
Up to Rs.5 lakh: 0.50 % (minimum of Rs.500) Above Rs.5 lakh: 0.60 % (maximum of Rs.10,000)
7
ICICI Bank
9.15% – 11.25% p.a.
Up to 2% of the loan amount plus GST
8
Bank of Baroda
7.6% up to 14.25%
Start from ₹500 + GST
9
IDBI Bank
8.30% – 10.60%
Minimum: Rs.1,500 plus taxesMaximum: Rs.2.500 plus taxes
10
Federal Bank
10.00% p.a. onwards
–
Overview of the Best Car banks Loan in India
1. State Bank of India (SBI)
SBI is India’s largest public sector bank, and its car loan scheme is considered a reliable option for those looking to purchase a car without much hassle. Under this loan, the bank provides funding up to the on-road price, which also covers initial expenses like RTO and insurance. The EMI tenure is up to 7 years, and the good thing is that there is no initial EMI advance. Typically, salaried or self-employed individuals between the ages of 21–70 can easily apply by providing the required income and documentation.
SBI Car Loan :
Point
Description
Funding
Up to 100% of the on-road price
Duration
Maximum 7 years
Eligibility
Applicants aged 21-70 years with a stable income
2. HDFC Bank
HDFC Bank is known for its fast processing and digital convenience in new car financing. The bank offers 100% on-road funding on many models, eliminating the need for customers to incur any upfront costs. Applications are completely online, and in many cases, pre-approval is received within minutes. Eligibility is also simple: both salaried and self-employed individuals can easily apply with basic documentation and a stable income. Processing fees and documentation charges are clearly outlined, making it easy to understand the total cost.
HDFC Bank Car Loan :
Point
Description
Funding
100% on-road on select models
Duration
12 to 84 months
Eligibility
Salaried/self-employed with stable income
3. Axis Bank
Axis Bank car loans are considered a good option for those who want a quick and streamlined process without much time. The bank offers financing for both new and used cars, and many models offer loans up to almost the entire on-road amount, significantly reducing the initial down payment. EMI tenures range from 1 year to 7 years, making it easy to manage your budget. Processing fees and other charges are clearly stated, and the online application process makes the entire process feel very simple.
Axis Bank Car Loan :
Point
Description
Funding
100% on-road on select models
Duration
12 to 84 months
Eligibility
Salaried/self-employed with stable income
4. Canara Bank
Canara Bank’s vehicle loan is a good option for those looking to purchase a new car without high fees and with a straightforward process. The bank offers loans up to 90% of the on-road price of a new car, reducing the need for a large down payment. Loan tenures can be up to 7 years for new vehicles, while those for slightly used cars can be up to 5 years. The processing fee is usually very low, and the bank sometimes waives it during the offer period. Overall, the low fees and straightforward process are its biggest strengths.
Canara Bank Car Loan :
Point
Description
Funding
Around 90% on-road on new cars
Duration
New: 84 months, Old: 60 months
Eligibility
Salaried/self-employed with stable income
5. Bank of India
Bank of India car loans are popular among those seeking low interest rates and reliable service. The bank typically offers rates starting at around 7.85% on new cars, which is considered quite affordable in this segment. The processing fee is also low around 0.25% of the loan amount, keeping the initial outlay low. EMI tenures are available up to 7 years, so installments can be set to your convenience. Overall, if you’re looking for a simple, clean, and affordable car loan, Bank of India seems like a reliable option.
Bank of India Bank Car Loan :
Point
Description
Funding
100% on-road on many models
Duration
12-84 months
Eligibility
Stable income, good credit score
6. IOB Car Loan
Car loans from Indian Overseas Bank are considered a good option for buyers who want low interest rates and a straightforward process. The bank typically offers competitive rates on new cars and, in most cases, offers loans up to 90% of the on-road price, making it easier to raise a large down payment. Loan tenures are available up to 7 years, so EMIs can be adjusted to suit your budget. The documentation requirements are also not onerous basic KYC and income-related documents are sufficient. Being a government-owned bank, the trust factor is also strong.
IOB Bank Car Loan :
Point
Description
Funding
Approximately 90% on-road
Duration
12–84 months
Eligibility
Stable income, good credit score
7. ICICI Bank
ICICI Bank’s car loan is considered a good option for those who need a loan with a fast process and simple documentation. The bank often provides financing up to the on-road price of a new car, reducing the worry of an initial down payment. Interest rates are tailored to your profile and are generally competitive, making EMIs easy to manage. The entire application process is online, and the documentation is very basic making loan approval time quick. Overall, the convenience and speed make ICICI’s car loan a reliable option in 2025.
ICICI Bank Car Loan :
Point
Description
Funding
100% on-road on many models
Duration
12–84 months
Eligibility
Stable income, good credit score
8. Bank of Baroda
Bank of Baroda’s car loan is a good option for buyers seeking affordable financing with reliable service from a government bank. The bank offers loans up to the on-road price on a variety of models, reducing initial outlays. Interest rates are generally competitive, and customers can choose between fixed and floating rates depending on their profile. The processing fee is also quite low, keeping overall costs under control. The application process is straightforward, and the eligibility criteria are quite simple, making this scheme a balanced and reliable option for car buyers in 2025.
Bank of Baroda Bank Car Loan :
Point
Description
Funding
100% on-road on many models
Duration
12–84 months
Eligibility
Stable income, good credit score
9. IDBI Bank
IDBI Bank car loans are considered a great option for buyers looking for a hassle-free loan from a trusted bank. Interest rates are generally affordable, and loan tenures are available up to 7 years, allowing EMIs to be set to your convenience. Finance is available for both new and used cars, and documentation is simple: basic KYC and income documents are all you need. Processing fees are low, and there are no additional prepayment charges after a certain period, making it even more affordable.
IDBI Bank Bank Car Loan :
Point
Description
Funding
100% on-road on many models
Duration
12–84 months
Eligibility
Stable income, good credit score
10. Federal Bank
Federal Bank car loans are considered a good option for buyers who want a streamlined process and a reliable banking experience. Interest rates typically start around 10%, which are stable and transparent compared to private banks. The bank also offers financing up to the on-road price on many models, eliminating the need for a large down payment. Loan tenures up to 7 years are available, making EMIs easily manageable. Overall, this Federal Bank scheme is ideal for those seeking a reliable financing option without complications.
Interest Rate : Every bank displays a “starting rate,” but the actual rate is determined by your profile, CIBIL, and car model. Always compare the effective rate; don’t make a decision based solely on the lowest number.
Processing Fees and Other Charges : Many banks charge fees ranging from 0.25%–1%. Also, consider adding documentation, valuation, and prepayment charges to get a clearer picture of the total cost.
Loan-to-Value Funding : Some banks offer 85–90% of the on-road price, while banks like HDFC/ICICI offer up to 100% funding on select models. This makes a significant difference to the down payment.
Loan Tenure : Options range from 1 to 7 years. Longer tenures lower EMIs but increase the total interest. Choose a tenure based on your income and monthly budget.
Speed of Approval and Disbursal : If you need to buy a car quickly, choose a bank with digital approval and fast disbursal. Private banks are generally faster here.
Special Schemes : EV loans, used-car loan schemes, and festival offers can often reduce the total cost. Include these offers in your comparison.
How to Invest in Car Loan Bank Related Stocks
With the rising demand for passenger vehicles in 2025, the banks financing these cars are also witnessing significant growth in their loan books. If you are interested in the stock market, you can look beyond just taking a loan and consider investing in these banks for potential long-term returns.
Identify Top Lenders: Focus on banks with a strong retail loan portfolio. Banks like SBI (SBIN), HDFC Bank (HDFCBANK), ICICI Bank (ICICIBANK), and Axis Bank (AXISBANK) are leaders in the auto loan segment.
Analyze Financial Health: Before investing, check key metrics such as NPA (Non-Performing Assets) to ensure the bank is managing its loans well, and NIM (Net Interest Margin) for profitability.
Monitor Auto Sales Data: Since car loan growth is directly linked to vehicle sales, keep an eye on monthly auto sales reports and quarterly bank results to gauge future performance.
Investing in these banking stocks allows you to benefit from the booming automobile sector in India without buying a car yourself.
The simple thing is, before taking out a car loan, carefully consider two or three things: the applicable rate, the funding available, and whether the bank’s process is easy enough for you. Understanding this will prevent the possibility of choosing the wrong one.
S.NO.
Check Out These Interesting Posts You Might Enjoy!
India’s maritime sector has seen significant changes in recent years. Whether it’s the demand for ships, their maintenance, or the opportunities presented by new projects, there’s a buzz everywhere. This is why people are now taking shipbuilding stocks seriously. This sector may have a slow start, but its long-term performance is what sets it apart. In this blog, we’ll explore how this industry is growing and what investors should consider in 2026.
What Are Shipbuilding Stocks?
Shipbuilding stocks are companies that provide services such as ships, submarines, coastal vessels, offshore support ships, or ship repair and maintenance. These companies’ work spans a wide range from design to construction, testing, delivery, and post-service servicing. Because shipbuilding spans many years, these companies’ orders are also long-term, making their business model considered quite stable.
Two Main Categories of the Shipbuilding Industry
1. Defense Shipbuilders
These companies build warships, submarines, and high-end military vessels for the Navy. Their projects span several years, and payments are milestone-based. Due to increasing defense budgets and naval modernization, companies in this category are consistently receiving large orders.
2. Commercial & Marine Engineering Companies
These companies engage in general business operations such as cargo ships, passenger ferries, tugboats, dredging vessels, and ship repair. This segment is more affected by the global trade and shipping industry, hence it is considered slightly cyclical.
List of Listed Shipbuilding Companies in India (2026)
A brief overview of the best Shipbuilding Companies in India is given below:
1. Mazagon Dock Shipbuilders Ltd
Mazagon Dock began as a small shipyard in Mumbai in 1934. At that time, it handled basic repairs and small vessels, but gradually grew into a key naval shipyard for India. Today, the company is known for building warships, submarines, and a variety of other sea vessels. Its work encompasses everything from design, construction, and subsequent maintenance. Having completed several major defense projects here, it is considered a reliable part of the country’s maritime force. The company’s reputation has been strengthened by its technical capabilities and long-standing trust.
Know the Returns:
1Y Return (%)
3Y Return (%)
5Y Return (%)
7.51%
600.79%
2,278.31%
(Data as of 30 January 2026)
2. Cochin Shipyard Ltd
Cochin Shipyard was established in Kochi in 1972, and within a few years, it became one of the country’s largest shipyards. Not only are new ships built here, but older vessels are also constantly repaired and upgraded. The yard’s distinctive features are its large dock facilities and ability to handle complex projects. Passenger ships, specialized marine vessels, and some industrial vessels are also built here. Gradually, the facility began to play a stable and reliable role in the Indian maritime sector, and even today, it is known for its consistent work.
Know the Returns:
1Y Return (%)
3Y Return (%)
5Y Return (%)
12.59%
588.30%
826.65%
(Data as of 30 January 2026)
3. Garden Reach Shipbuilders & Engineers Ltd
Garden Reach Shipbuilders was founded in 1884, which speaks volumes about the company’s longevity. Initially, it built simple river vessels and small vessels, but over the years, its work has evolved significantly. Today, its primary focus is building ships for the Navy, a task that requires technology, patience, and meticulous engineering. The company has earned a reputation for completing even complex projects with flying colors. Long-standing experience and continuous improvement have made it a reliable part of India’s defense shipbuilding lineup.
Know the Returns:
1Y Return (%)
3Y Return (%)
5Y Return (%)
79.11%
466.36%
1,403.75%
(Data as of 30 January 2026)
4. Swan Defence and Heavy Industries Ltd
Swan Defence isn’t a very old company, but its work is in a direction where India is currently growing rapidly. Its focus is on defense and marine-related ships and heavy industrial equipment. The company bills itself as a modern shipbuilding player—where design, innovative technology, and rapid completion are its core strengths. Its scope is currently expanding, but rising demands for maritime and coastal security present significant opportunities. Those who closely follow the sector believe the company could handle significant projects in the future.
Know the Returns:
1Y Return (%)
3Y Return (%)
5Y Return (%)
3,308.87%
66,216.85%
62,981.88%
(Data as of 30 January 2026)
5. Knowledge Marine & Engineering Works Ltd
Knowledge Marine & Engineering Works is a company that has gradually established itself in the maritime services sector. Founded in 2015, it’s not very old, but its work is focused and practical. The company primarily engages in dredging, marine repairs, coastal projects, and small vessel operations. Its model is slightly different because, instead of building large ships, it focuses on tasks that require daily use—such as harbor cleaning, maintaining water depth, and ship maintenance. This results in a smaller scope, but consistent work. It is known for its steady and service-based operations.
Know the Returns:
1Y Return (%)
3Y Return (%)
5Y Return (%)
87.70%
88.14%
88.14%
(Data as of 30 January 2026)
6. JITF Infra Logistics Ltd
JITF Infra Logistics‘ work is related to the maritime sector, but its scope isn’t limited to shipbuilding or repair. The company also works on logistics, infrastructure, and water-related engineering projects. It was founded in 2008 and has been involved in a variety of heavy engineering and marine utility projects since then. The company’s approach is somewhat multi-segment—sometimes it handles port-related work, sometimes water treatment projects, or marine logistics solutions. Its specialty is its focus on services that require long-term work and technical expertise. Therefore, it is considered a diversified engineering and marine services company.
Know the Returns:
1Y Return (%)
3Y Return (%)
5Y Return (%)
-51.23%
176.83%
3,096.65%
(Data as of 30 January 2026)
7. ABS Marine Services Ltd
ABS Marine Services is a company that has been operating in the maritime services sector for quite some time. Founded in 1992, it has been providing services such as marine operations, ship management, and offshore support. Instead of building large ships, the company focuses on tasks that every maritime business requires—crew management, technical support, marine equipment handling, and coastal operations. ABS has earned its reputation for its practical, ground-level work, where trust and experience are paramount. Its steady working style makes it a trusted name among maritime support companies.
Know the Returns:
1Y Return (%)
3Y Return (%)
5Y Return (%)
9.09%
-38.78%
-38.78%
(Data as of 30 January 2026)
8. VMS Industries Ltd
VMS Industries was founded in 1991 and is known for its ship dismantling and ship recycling. Dismantling ships to extract useful metals and other materials is a field where both safety and experience are crucial, and the company has been doing this for many years. It also handles smaller projects related to marine repairs and engineering. As ship recycling is a significant industry in India, VMS has gradually established its presence in this field. Its focus has always been on practical work, discipline, and operating according to regulations.
Know the Returns:
1Y Return (%)
3Y Return (%)
5Y Return (%)
-22.03%
79.08%
312.49%
(Data as of 30 January 2026)
9. Garware Marine Industries Ltd
Garware Marine Industries was founded in 1975 and is known for its specialized products and services related to the maritime industry. Its work isn’t directly related to building large ships, but instead focuses on fishing nets, marine ropes, and other materials used in everyday maritime activities. The company gradually expanded its scope by branching out into boat repair and marine technical services. Garware has established itself as a company that engages in practical, down-to-earth marine work, where quality and reliability are paramount. Over the years, it has played a steady and reliable role in supporting maritime operations.
Know the Returns:
1Y Return (%)
3Y Return (%)
5Y Return (%)
-20.42%
158.00%
538.28%
(Data as of 30 January 2026)
10. Datiware Maritime Infra Ltd
Datiware Maritime Infra is a company established to work on projects related to maritime infrastructure and coastal services. Its core business leans towards port-related development, coastal facilities and maritime logistics services. The company is new and in the expansion phase, but its focus is on areas where India will need significant growth in the future such as the development of minor ports, coastal transport and marine-based infrastructure. Its role is still taking shape, but given the increasing investment in the maritime sector, the company wants to be involved in projects where there is long-term demand. This makes it seen as an emerging maritime infrastructure player.
Know the Returns:
1Y Return (%)
3Y Return (%)
5Y Return (%)
40.33%
138.92%
25.48%
(Data as of 30 January 2026)
Key Performance Indicators (KPIs)
The key performance metrics of Shipbuilding Companies are mentioned below:
Company
Operating Margin (%)
Net Profit Margin (%)
ROE (%)
ROCE (%)
Debt to Equity
Mazagon Dock Shipbuilders Ltd
27.23
27.23
32.37
38.31
0.00
Cochin Shipyard Ltd
24.14
17.16
14.82
19.00
0.01
Garden Reach Shipbuilders & Engineers Ltd
14.05
10.39
25.36
32.36
0.00
Swan Defence and Heavy Industries Ltd
-2,250.91
-2,580.16
-61.24
-6.09
8.23
Knowledge Marine & Engineering Works Ltd
35.86
24.71
22.90
24.32
0.61
JITF Infra Logistics Ltd
12.67
8.42
45.70
41.02
0.86
ABS Marine Services Ltd
23.39
15.15
11.77
11.07
0.77
VMS Industries Ltd
4.16
2.35
7.07
12.13
0.15
Garware Marine Industries Ltd
36.17
35.89
2.40
2.31
0.00
Datiware Maritime Infra Ltd
20.05
-116.87
–
1.15
-3.69
(All the above data is of the year ended March 2025)
Increasing Defense Budget and Naval Modernization : India’s defense modernization program is progressing rapidly in 2025-26, with the Navy’s capital acquisition budget increased to ₹1,48,838.9 crore. The ‘Buy Indian-Designed, Design and Build’ policy is leading to large orders for new warships and submarines for the country’s shipyards, which are becoming a strong growth engine for shipbuilding stocks.
Maritime India Vision 2030 and Marine Infrastructure : Over 150 initiatives are being implemented under Maritime India Vision 2030, including the development of ports, shipbuilding, ship repair, and inland waterways. The government has targeted an investment of approximately ₹3-3.5 lakh crore for this sector. This development will generate orders for shipbuilding companies, enhancing their strategic role and investment potential.
India’s Defense Exports and Global Partnerships : India is now moving beyond domestic orders but also toward foreign partnerships and export opportunities. International companies are being invited to invest and build in Indian shipyards, increasing both technological participation and competitiveness in the sector. This move opens the door to a significant pipeline for shipbuilding stocks, as event-time contracts and international demand can generate long-term profits.
Growing Global Demand and the Ship Repair/Retrofit Market : With the expansion of India’s ports and islands, demand for shipbuilding and transshipping is increasing. For example, approximately 855 million tons of cargo are expected to be handled by ports in 2025. This is resulting in opportunities for domestic companies in sectors such as ship repair, maintenance, and green shipping initiatives, and these opportunities indicate a growing footprint for shipbuilding stocks.
Key Risks Investors Must Understand
Execution Delays & Cost Overruns : Shipbuilding stretches over many years, so even minor delays increase project costs. Schedule changes directly impact companies’ profits.
High Dependence on Government Orders : Most major orders in India come from defense and government institutions. Any policy changes or delays in approvals can slow companies’ growth.
Cyclical Demand in Commercial Shipping : As global trade and freight traffic declines, demand for commercial ships falls. This impacts companies not involved in the defense sector more.
Heavy Working Capital Requirement : Shipyards must continuously invest large sums of money for raw materials and project progress. Payments are often milestone-based, which can put pressure on cash flow.
Commodity Price Fluctuations : Construction costs increase when steel, copper, and marine equipment prices rise. Companies are not always able to pass these costs on to customers.
Limited Scalability for Some PSU Shipyards : Many public shipyards have limited capacity expansion or land/dock facilities, making it difficult to grow rapidly over the long term.
The shipbuilding sector is slowly reviving. Many new needs are emerging—sometimes related to defense projects, sometimes to ports and coastal development. Companies are contributing in their own ways, some by building ships, others by providing marine services. Before investing, consider the company’s capabilities and its reliability. If things are understood correctly, this sector could offer significant opportunities in the future.
S.NO.
Check Out These Interesting Posts You Might Enjoy!
ICICI Prudential Asset Management Company (AMC), one of India’s leading mutual fund houses backed by ICICI Bank and Prudential Plc, is launching an initial public offering (IPO) to raise ₹10,602.65 crore.The issue opens for subscription on December 12, 2025, and will close on December 16, 2025, with a price band fixed at ₹2,061 to ₹2,165 per share.The IPO is a book-built issue and comprises entirely an offer for sale (OFS) of 4.90 crore shares, aggregating to ₹10,602.65 crore, by existing shareholders. There is no fresh issue component in the offer.The shares are proposed to be listed on both the Bombay Stock Exchange (BSE) and the National Stock Exchange of India (NSE), with tentative listing scheduled for December 19, 2025, subject to allotment and regulatory approvals.
ICICI Prudential AMC IPO,IPO Day 2 Subscription Status
On Day 2, ICICI Prudential Asset Management Company. IPO witnessed a strong investor turnout, closing with an overall subscription of 2.02 times. The Qualified Institutional Buyers (QIB) category with a robust 2.91 times subscription, indicating solid institutional participation. Among Non-Institutional Investors (NII), the bNII (above ₹10 lakh) portion was subscribed 3.81 times, while the sNII (less than ₹10 lakh) segment saw Robust Leading with 3.74 times subscription, resulting in an overall NII subscription of 3.36 times. The Retail Individual Investors (RII) category was subscribed 0.83 times, reflecting healthy retail interest. Overall, the issue garnered 16,91,986 applications, with total bids amounting to approximately ₹15,347.228 crore, showcasing strong confidence across investor categories in the company’s growth potential.
Investor Category
Subscription (x)
Qualified Institutional Buyers (QIB)
2.91
Non-Institutional Investors (NII)
3.36
bNII (above ₹10 lakh)
3.81
sNII (less than ₹10 lakh)
3.74
Retail Individual Investors (RII)
0.83
Total Subscriptions
2.02
Total Applications: 16,91,986
Total Bid Amount (₹ Crores): ₹15,347.228
Objective of the ICICI Prudential AMC IPO
Since the ICICI Prudential AMC IPO is a 100% Offer for Sale (OFS), the company will not receive any proceeds from the issue. The entire IPO proceeds will be received by the selling shareholders, and no funds will be utilized by ICICI Prudential AMC for business expansion, capital expenditure, or other corporate purposes.
ICICI Prudential AMC IPO GMP – Day 2 Update
The grey market premium (GMP) of the ICICI Prudential AMC IPO stands at ₹₹268.5 as of December 15, 2025 (Day 2). Considering the upper end of the price band at ₹2165 per share, the estimated listing price is around ₹2433, reflecting a potential gain of approximately 12.38% per share in the grey market.
Date
GMP
Est. Listing Price
Gain
15-12-2025 (Day 2)
₹268.5
₹2433
12.38%
Disclaimer: The above GMP (Grey Market Premium) is just unofficial market information, which is not officially confirmed. These figures are shared for informational purposes only and investment decisions based on these should be based on the investor’s own research and discretion. We do not conduct, recommend or support any kind of transaction in the grey market.
ICICI Prudential AMC IPO – Key Details
Particulars
Details
IPO Opening Date
December 12, 2025
IPO Closing Date
December 16, 2025
Issue Price Band
₹2061 to ₹2165 per share
Total Issue Size
49,000,000 shares(aggregating up to ₹10,602.65 Cr)
Important Dates for ICICI Prudential AMC IPO Allotment
Event
Date
Tentative Allotment
December 17, 2025
Refunds Initiation
December 18, 2025
Credit of Shares to Demat
December 18, 2025
Listing Date
December 19, 2025
Overview Of ICICI Prudential AMC IPO
ICICI Prudential Asset Management Company (AMC) is one of India’s leading and most trusted mutual fund houses, offering a wide range of investment solutions across equity, debt, hybrid, and passive products. Backed by ICICI Bank and Prudential Plc, the company leverages strong brand equity, deep distribution reach, and disciplined investment processes to serve millions of retail and institutional investors.
Operating in a rapidly expanding financial savings market, ICICI Prudential AMC uses data-driven research, technology-enabled platforms, and robust risk management systems to enhance portfolio performance and client experience. With a strong presence across urban and semi-urban regions, the AMC benefits from rising financialization of household savings. As it continues to grow, the company remains focused on long-term wealth creation, operational efficiency, and maintaining leadership in India’s asset management industry.
Frequently Asked Questions (FAQs)
What is the opening and closing date of the ICICI Prudential AMC IPO?
ICICI Prudential AMC IPO is open on December 12, 2025 and will close on December 16, 2025.
What is the price band of the ICICI Prudential AMC IPO?
Its price band is fixed from ₹2061 to ₹2165 per share.
What is the GMP (Grey Market Premium) of the ICICI Prudential AMC IPO today?
The GMP on December 15, 2025 is ₹268, which leads to a possible listing price of ₹2433.
What is the total issue size of the ICICI Prudential AMC IPO?
The total issue size of the ICICI Prudential AMC IPO is ₹10,602.65 crore, structured entirely as an Offer for Sale (OFS) by existing shareholders, with no fresh issue component.
What is the expected listing date of the ICICI Prudential AMC IPO?
This IPO is expected to be listed on BSE and NSE on December 19, 2025.
Today, algorithmic trading in India is growing faster than ever. According to recent data from 2025, approximately 57% of equity cash segment trading and nearly 70% of derivatives trading is now conducted through algo systems, thanks to the readily available broker APIs, automation tools, and AI-driven strategies. Programming languages are the backbone of this automation; they tell computers how to read data, when to trade, and how to execute strategies quickly and accurately. In this blog, we’ll explore the most reliable and practical programming languages for algo trading in 2025 and their benefits.
Best Programming Languages for Algo Trading in 2026
Programming Language
Speed / Latency
Data Handling
Best Use Case
Python
Medium
Excellent
ML models, options algos, backtesting
C++
Ultra-Fast
Good
HFT, execution engines
Java
Fast
Very Good
Large trading systems, OMS/EMS
JavaScript (Node.js)
Medium-Fast
Moderate
Crypto/trading bots, real-time dashboards
R
Slow-Medium
Excellent
Statistical & quant research
Julia
Fast (near C++)
Excellent
AI-quant hybrid models
MATLAB
Medium
Excellent
Institutional quant & risk models
1. What is Python ?
Python is a simple, high-level programming language that is considered extremely easy to learn. Its biggest advantage is that it makes major parts of trading, such as data analysis, automation, and strategy testing, very smooth. If you’re new to algo trading, Python allows you to get started without any extra technical stress.
How does Python work in Algo Trading?
Step 1 – Creating API Access
First, you access a brokerage’s trading API (like Pocketful). This API allows your Python code to view market data and place orders.
Step 2 – Installing the SDK in Python
The broker’s SDK is installed in Python, allowing your script to easily access real-time data and call order functions.
Step 3 – Reading Market Data
The Python script fetches real-time prices, historical candles, indicators, and other market feeds. This data becomes the input for your trading strategy.
Step 4 – Writing Strategy Logic
Now, in Python, you write buy/sell rules such as moving average crossovers, RSI signals, or breakout logic. Python’s simple syntax makes this process very smooth.
Step 5 – Backtesting
Using Python, the strategy is tested on historical data to determine its effectiveness under real market conditions.
Step 6 – Running the Live Algo Bot
Once the strategy is validated, the Python bot is connected to the API and live trading begins. The bot automatically executes buy-sell orders based on your rules.
Step 7 – Performance Monitoring
Python continuously monitors the bot’s performance through log files, alerts, and dashboards, so you can view its execution at any time.
Advantages of Python
Easy to learn even beginners can quickly create strategies.
Fast Development writing and testing strategies is fast.
Strong Data Handling smoothly handles ticks, candles, and indicators.
AI/ML Integration Advanced strategies like sentiment analysis and prediction models are easily created.
Limitations of Python
Not suitable for high-frequency trading Python is slow for strategies requiring millisecond-level speed.
Execution Speed Limited Slower performance than compiled languages like C++ and Rust.
Heavy Computation Load Large mathematical models have increased processing time.
2. What is C++
C++ is a high-performance, compiled programming language designed for systems where speed and precision are paramount. It is particularly used in algo trading where microsecond-level execution is required. Its memory-level control capabilities make it a favorite for traders who want ultra-fast order execution.
How Does C++ Work in Algo Trading?
Step 1 – Connection Setup to Broker API
First, the C++ application is connected to a broker’s low-latency API (for example, an API like Pocketful).
Step 2 – Processing Real-Time Market Feed
C++ reads data in raw formats, such as order-book depth, tick-by-tick feeds, and microsecond-level price changes. Its speed allows for instant data processing.
Step 3 – Applying High-Speed Strategy Logic
Strategies are now written using C++ such as arbitrage detection, liquidity-based entries, or rapid breakout logic. This logic runs in compiled form, making it extremely fast.
Step 4 – Instant Order Execution
The C++ bot places orders immediately upon signal generation. Ultra-low latency ensures optimal positioning in the order queue, reducing slippage.
Step 5 – Continuous Monitoring and Error Handling
During live market operations, the C++ system self-monitors immediately detecting delays, disconnections, or errors. Its reliability is crucial in high-frequency systems.
Strengths of C++
Ultra-Low Latency Performance Delivers microsecond-level speeds, not milliseconds.
Direct Memory Control Data handling and calculations become super-efficient.
Stable Under Heavy Loads Processes high-volume market data without lag.
Limitations of C++
Stiff Learning Curve Difficult for beginners to write and maintain.
Long Development Time Strategies don’t test quickly; every change requires compilation.
Not Beginner-Friendly Not a practical first choice for traders new to algo trading.
3. What is Java?
Java is a robust, object-oriented programming language designed for large, continuously running systems. Financial institutions and trading firms prefer it because it can handle long-running applications without interruption.
How Does Java Work in Algo Trading?
Step 1 – Establishing a Broker API Connection
A Java application is connected to a broker’s trading API (for example, an API like Pocketful). Java’s network layer is stable, so connection interruptions are minimal.
Step 2 – Multi-Threaded Data Handling
Java can handle multiple tasks in parallel such as reading price updates, performing indicator calculations, and generating signals.
Step 3 – Building a Structured Strategy Logic
In Java, strategies can be easily divided into modules such as a signal engine, risk management, and an order engine making even complex strategies clean and maintainable.
Step 4 – Automated Order Execution
When a Java application generates a signal, it immediately sends an order through an API. Its execution is faster than Python and slightly slower than C++, but stability is its greatest strength.
Step 5 – Monitoring, Logging, and Recovery
Java-based bots keep detailed logs and recover automatically in case of errors.
Strengths of Java
High Stability Long-running trading bots run smoothly without crashing.
Strong Multi Threading Can manage multiple signals, data streams, and tasks simultaneously.
Better Performance than Python Execution speed is balanced and more consistent.
Limitations of Java
Verbose syntax Code takes longer to write and update than Python.
Not Ideal for Extreme Low Latency Not suitable for HFT or microsecond trading.
A bit heavy for beginners Logic takes time to understand and implement.
4. What is JavaScript ?
JavaScript is a lightweight and event-driven programming language originally designed for web development, but it is now rapidly being adopted in algorithmic trading especially crypto and real-time data-based strategies. With the advent of Node.js, JavaScript can also handle server-side tasks with great speed and stability.
How Does JavaScript Work in Algo Trading?
Step 1 – Setting Up an API Connection
First, a JavaScript/Node.js application connects to a broker or crypto exchange’s API (such as the Pocketful API example).
Step 2 – Reading WebSocket-Based Live Data
Node.js handles WebSocket data very smoothly. This is especially useful for crypto traders because crypto markets are active.
Step 3 – Real-Time Updating of Strategy Logic
JavaScript can react instantly to real-time market movements. As soon as a price threshold is hit or an indicator is updated, the Node.js bot can execute logic immediately.
Step 4 – Automated Order Execution
As soon as a signal is generated, the JavaScript bot fires an API to place an order. Asynchronous execution prevents any processes from being blocked, improving overall system speed.
Step 5 – Creating Live Monitoring Dashboards
The biggest advantage of JavaScript is that you can also create real-time dashboards with the same language charts, P&L panels, alerts all within a single ecosystem.
Strengths of JavaScript
Excellent at Real-Time Data Handling WebSocket support makes it ideal for 24/7 markets.
Async Architecture No task blocking, responsiveness remains high.
Perfect for Crypto Trading Most exchanges offer JS-friendly APIs.
Limitations of JavaScript
Less Quant Libraries Not as rich a quant ecosystem as Python.
Weak at Heavy Computation Not ideal for complex mathematical calculations.
Less Use in Indian Equity Algos Equity traders in India still prefer Python.
5. What is R?
R is a statistical computing language specifically designed for data analysis, forecasting, and quantitative modeling. Indian algo traders choose it when their strategies rely on heavy statistical calculations, time-series forecasting, or portfolio optimization.
How Does R Work in Algo Trading?
Step 1 – Data Import and Cleaning
First, you import market data (CSV, API, or database formats) into R. R easily cleans and structures statistical datasets, making it easy to begin modeling.
Step 2 – Creating Quantitative Indicators and Models
R’s greatest strength is its ability to build complex statistical models such as ARIMA, GARCH, regression models, and volatility forecasting very accurately.
Step 3 – Creating Strategy Logic
Now, buy-sell rules are defined based on statistical output. For example, mean-reversion signals, probability-based entries, or multi-factor strategies.
Step 4 – Backtesting and Performance Analysis
Packages like quantmod, TTR, and PerformanceAnalytics in R allow you to test the strategy on historical data. This phase is critical for research-heavy strategies.
Step 5 – Live Trading Integration
Once the strategy is validated, you can connect it to a broker API (for example, the Pocketful API) and run it live. However, R is slightly less flexible than Python and Java for live execution.
Strengths of R
Strongest in Statistical Analysis Unmatched accuracy in forecasting, modeling, and quantitative research.
Time-Series Tools Ready-Made Can efficiently analyze Indian equities, derivatives, and commodities.
Research-Grade Backtesting Performance analytics and risk analysis are very advanced.
Limitations of R
Less Flexibility in Live Execution Not as smooth as Python for automation.
Speed Average Execution in fast-moving markets is not as steady as Python or Java.
Learning Curve Medium Takes time to learn if you don’t have a statistical background.
6. What is Julia?
Julia is a modern, high-performance programming language designed specifically for scientific computing, numerical analysis, and complex mathematical modeling. Its most distinctive feature is that it looks as simple as Python, but is very close to C++ in speed. It is becoming popular among Indian quant traders in 2025 because advanced strategies such as optimization-heavy models and AI-driven forecasting run faster and more accurately in Julia.
How does Julia work in Algo Trading?
Step 1 – Data Loading and Pre-Processing
Julia loads large datasets quickly and applies mathematical transformations without delay. This creates the perfect foundation for complex algo models.
Step 2 – Quantitative & Mathematical Modeling
Julia’s powerful numerical libraries process optimization, derivative calculations, risk modeling, and matrix-heavy computations with remarkable ease.
Step 3 – Developing Strategy Logic
If the strategy involves probability-based entries, factor modeling, or AI-powered predictions, Julia’s speed and numerical accuracy make it even stronger.
Step 4 – Backtesting with High-Speed Execution
Julia runs backtests in parallel on multi-core processing, allowing even heavy models to be evaluated in less time.
Step 5 – Live Execution (API Example)
You can run a validated strategy live by connecting to a broker API (example: Pocketful API). Although Julia’s live trading ecosystem in India is still small, advanced traders are rapidly adopting it.
Strengths of Julia
Near C++ Level Performance Heavy mathematical strategies run lightning-fast.
Designed for Scientific & Quant Computing Complex calculations are Julia’s specialty.
AI/ML Integration Efficient Deep learning and forecasting models run smoothly.
Easy Syntax for Quant Developers As easy to write as Python but faster.
Limitations of Julia
Limited Adoption in the Indian Market Not yet as widespread as Python.
Less Broker Integrations Availability of API libraries is still developing.
Small Community Size Beginners don’t get much help or ready-made solutions.
7. What is MATLAB?
MATLAB is a premium, high-level programming environment designed for scientific calculations, simulations, and complex quantitative modeling. It is used by Indian financial institutions, research teams, and professional quants, especially where trading decisions are based on deep mathematical models, derivative pricing, or risk analytics.
How Does MATLAB Work in Algo Trading?
Step 1 – Market Data Import and Cleaning
MATLAB converts large datasets into a clean and structured format without any manual formatting. This creates a high-quality base for quantitative models.
Step 2 – Building Mathematical & Quant Models
MATLAB’s library processes derivative pricing, volatility modeling, optimization algorithms, neural networks, and statistical forecasting with very high accuracy.
Step 3 – Creating Strategy Logic
Buy-sell logic is developed based on research output. Complex strategies can be written modularly in MATLAB, making them easy to maintain and modify.
Step 4 – Backtesting & Scenario Simulation
MATLAB’s simulation capabilities are very advanced. You can test the impact of different volatility environments, risk levels, and market shocks, which is critical for institutional-grade strategies.
Step 5 – Live Trading
MATLAB can be connected to a broker’s API , but it is not as flexible as Python or Java for live execution. Therefore, it is primarily used in research-to-production workflows.
Strengths of MATLAB
Advanced Mathematical Accuracy Industry-standard for deep quantitative models and derivative pricing.
Powerful Simulation Engine Unmatched capability in risk modeling and stress testing.
High Reliability for Research Perfect environment for academic and institutional traders.
Limitations of MATLAB
Expensive Licensing Costly for individual retail traders.
Limited Live Algo Automation Real-time execution is not as flexible as Python.
Not Beginner Friendly It takes effort to learn without a research background.
Key Factors to Compare Before Selecting a Language
Speed and Latency Efficiency : In algo trading, trades are executed at the millisecond level. Therefore, it’s important to choose a language that runs fast and offers low-latency execution. In high-frequency or fast-moving markets, speed directly impacts your returns.
Data Handling and Processing Power : In 2025, strategies are based on tick data, options chains, and real-time feeds. A language is only as useful as it can efficiently process large data. Smooth data handling leads to more accurate models.
Availability of Quant Libraries and Tools : Strong libraries are the backbone of any trading system. Platforms like Python offer ready-made tools for backtesting, charting, optimization, and ML, while C++ and Rust offer the best tools for performance-heavy tasks. A strong ecosystem significantly reduces development time.
Learning Curve and Practical Usability : A language is only as effective as the speed with which you can learn and develop a strategy. Python is easier for beginners, while C++ and Rust are more technical. Your comfort level and learning speed also play a role in the decision.
Availability of Community Support and Resources : A strong community provides quick assistance with coding issues, bugs, and strategy development. Updated documentation and tutorials make learning easier, especially for new traders.
AI/ML Framework Compatibility : Machine learning and deep learning strategies are rapidly gaining popularity in modern trading. It’s important to choose a language that can easily work with frameworks like TensorFlow, PyTorch, and scikit-learn. This gives your strategy the smartest edge.
Deployment Flexibility and Server Support : Algo bots require cloud, VPS, or dedicated servers to run 24/7. The more flexible the language, the easier it is to deploy and maintain the system. This improves both reliability and uptime.
Conclusion
The right language for algo trading is one that allows you to work comfortably and automate your strategy without hassle. For some, speed matters, for others, ease of coding. Therefore, the “best” language is different for everyone. Simply choose a language that you can learn consistently and use with confidence this will be the most practical and correct decision.
S.NO.
Check Out These Interesting Posts You Might Enjoy!
The presence of silver in Indian households is nothing new; we have always carried an affinity towards silver. However, in recent times, silver has attracted people by becoming more than just something that is traditionally owned. As silver continues to gain popularity, it’s now becoming one of the top choices for those wanting to invest in the future.
In this blog, we will take a simple, easy look at silver’s journey so far, what is pushing its price right now, and what the next five years might look like.
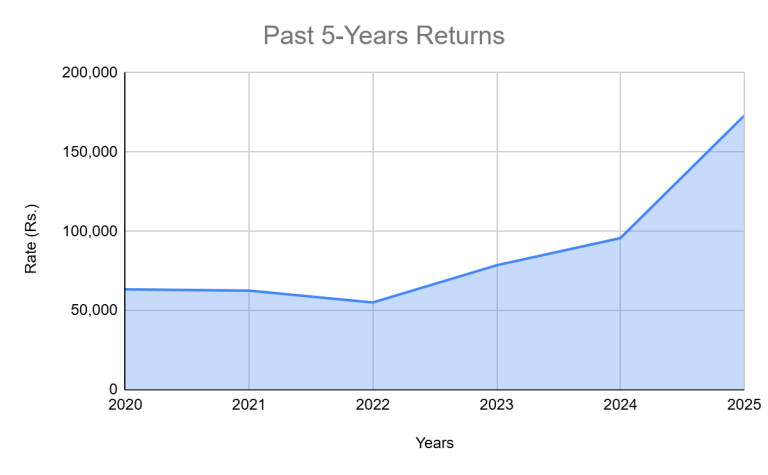
Historical Trend of Silver Prices in India
In the 1980s and 1990s, silver prices in India were low and rose slowly. In 1981, it stood at about ₹2,700 per kg; however, by the early 1990s, it had risen to about ₹8,000 per kg. The 1990s were a mix of positive and negative developments.
In the early 2000s, things indeed started to improve. By 2004, prices had risen to over ₹11,000 per kilogram, and the metal started to adapt more to the declining rupee, the expansion of technology, and global demand.
The real action took place from 2006 to 2012. The price of silver increased dramatically, reaching ₹17,000 per kilogram in 2006 and then nearly ₹57,000 per kilogram in 2011. This was one of India’s major silver price increases. Following the peak, prices decreased and, by 2014, they were stable at ₹43,000 per kilogram.
Silver remained relatively stable between 2015 and 2019. Demand was steady but not particularly high.
In the 2020s, the momentum returned. By 2023, silver was trading at nearly ₹67,000 per kilogram, driven by the pandemic’s renewed interest in precious metals. Prices increased mainly because of rising consumption of solar panels, electronics, and electric vehicles.
Silver took off once more by 2024 and 2025. In 2024, prices exceeded ₹95,000 per kg. Even though silver has experienced enough instances of abrupt dips and sharp spikes over the years, the metal has generally trended upward.
An increasing use of technology – There is silver in phones, laptops, electric vehicles, solar panels, and even 5G towers. So, as these industries grow, so does the need for silver, which naturally drives up prices.
People Buying Silver as Investments – People look for safer places to keep their money when the economy is weak or prices are going up. Silver becomes one of the preferred investment avenues, and prices usually go up when more people want to buy it.
Rupee–Dollar Movement – Since silver is priced in US dollars, any change in how strong or weak the rupee is affects its price in India. If the rupee falls, silver becomes more expensive for all of us, even if global prices stay the same.
Uncertainty in geopolitics – Wars, political tensions, and problems with the global economy make investors anxious. When things like this happen, people rush to buy precious metals, which drives up the price of silver.
Taxes on Imports and Government Rules – Most of India’s silver comes from other countries. So, if taxes or import duties go up, the price of silver also rises. Alterations in policy can quickly change prices.
India has been experiencing a good rise in silver prices. Silver is currently worth approximately ₹1.67 lakh per kg, which is far greater than its position at the beginning of the year. The rise has been largely attributed to a combination of the international demand, a weaker rupee and increased industrial use.
The other factor that is causing silver to perform well is the overall market mood. Investors have been seeking safer investments, and silver has taken advantage of this. Analysts on the global side are discussing a potential shortage of supply, and this is making it bullish.
The market is not, however, entirely one-way. There are also reports that industrial demand might ease slightly, so the rally might decelerate. Nonetheless, on the whole, silver remains in a good position and has numerous positive aspects.
Silver Price Prediction
According to a recent outlook, silver is entering a strong multi-year uptrend. It is believed the metal could touch ₹2,45,000 per kilo by 2026- 27 in India. This rise is not just because silver prices are rising globally; the weakening rupee also plays a big role in lifting prices here at home.
The international silver prices are expected to head towards $75–77 per ounce by 2027, up from the $50-range right now. But the bigger story is the demand side. Silver is not just for jewellery anymore; it is used in electric vehicles, solar panels, batteries, and 5G technology is growing quickly. Since a lot of silver is produced as a by-product of mining other metals, supply cannot easily ramp up even when prices rise.
On average, silver can swing almost 1.7 times more than gold, which means higher upside but more volatility too. But for now, the bigger trend is still positive.
In simple words, if the rupee continues to weaken and global demand stays strong, silver prices in India could see some major highs over the next five years
Should You Invest in Silver
Silver can be a great addition to your investment mix, but it depends on the kind of investor you are. On the positive side, its demand is rising because of its industrial use. And during times when inflation is high, or the global economy is a bit off track, silver often behaves like a safety blanket, just like gold.
But the truth is, silver is volatile. It moves faster than gold, so you will need a bit of patience. If sudden price swings make you anxious, you might find silver a little too unpredictable.
If you are investing with a long-term mindset and you are fine with some bumps along the way, adding a small portion of silver to your portfolio can work well; even 5 -10% through silver ETFs, digital silver, or physical silver can help diversify your investments.
Silver’s price story has been full of twists. The outlook ahead looks positive, but it is still a market that can move quickly, both up and down. Just take it slow, stay informed, and invest in a way that suits your comfort level. Silver does have a bright future, but the best results come when you balance patience with good decisions.
S.NO.
Check Out These Interesting Posts You Might Enjoy!
Retail investors are always looking for new investment opportunities. They always try to copy a famous investor’s portfolio. Mukul Agarwal is one such investor who holds a portfolio of 6000-7000 INR.
In today’s blog post, we will give you an overview of Mukul Agarwal’s Portfolio, along with the learning from his portfolio.
Who is Mukul Agarwal?
Mukul Agarawal is one of India’s most famous investors. He has been actively investing in stocks for the past several years. According to reports, he holds a large portfolio of stocks worth nearly 7,000 crores. He often uses an aggressive style of investing and primarily invests in mid and small-cap stocks.
Career of Mukul Agarwal
Mukul Agarwal started his career in the late 90s by trading unlisted IPOs and earned lakhs of INR. He founded Param Capital in 1993, which primarily focused on managing private and public portfolios. He also founded Agarwal Corporates in 1993 to focus on financial education and workshops on the equity market, while continuing to provide consultancy services to clients. Param Capital invests the amount in both small-cap companies and private unlisted companies’ equity. In 2022, he founded Finowing, which is primarily a training academy. This holds a Guinness World Record in organising a large “Financial Freedom Conclave”.
Investment Approach and Philosophy of Mukul Agarwal
The key investment approach and philosophy of Mukul Agarwal are mentioned below:
Small Cap: Mukul Agarwal primarily invests his portfolio in small-cap and micro-cap stocks. He believes that investment must be made in small-cap stocks so that they can perform in the long run.
Long-term Investing: He follows the approach of long-term investing. He purchases the stocks based on his own research and holds them for several years.
Research: Mukul Agarwal checks the stocks fundamentally and, based on factors like corporate governance, business growth opportunities in future, etc., he identifies the stock for investment.
Focus on Business Model: Mukul Agarwal generally focuses on the quality of the business model. He does not focus on the stock’s price; therefore, his primary focus is the company’s valuation.
Different Portfolios: He manages two different portfolios. One is for trading, which primarily focuses on short-term gains, whereas the other is a long-term portfolio that focuses on investment.
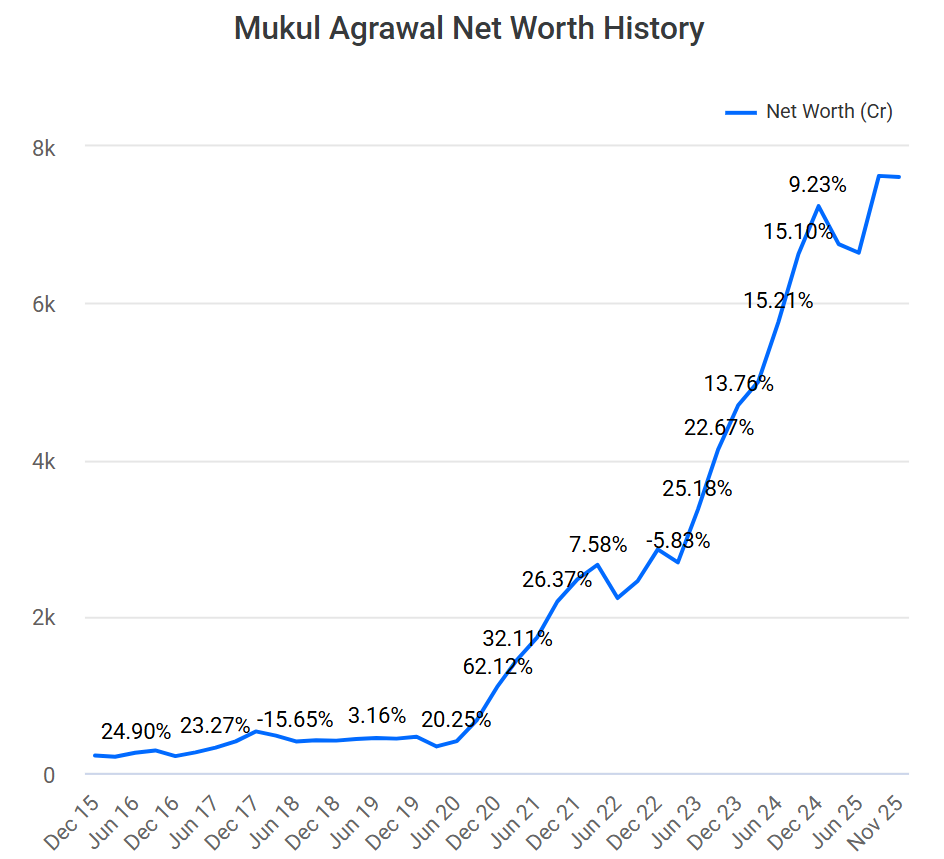
Networth of Mukul Agarwal
The net worth of Mukul Agarwal has increased significantly over the past few years. And based on various reports. Mukul Agarwal holds around 61-72 stocks in his portfolio. The value of which is around 7000 – 7500 crores. As of September 2025, his net worth is around 7623 crores.
Learning from Mukul Agarwal’s Portfolio
The key learning from Mukul Agarwal’s Portfolio is as follows:
Portfolio Diversification: Mukul Agarwal holds a diversified range of portfolios, which helps him in reducing sector-specific risk.
Long-term Approach: One should not invest in the stock market for the short term. It is advisable to invest in stocks and hold them for the long term.
Fundamental Research: Before investing in any stocks, one should conduct thorough research and analyse the company’s profitability, revenue, growth prospects, etc.
Monitoring of Portfolio: One should monitor their portfolio regularly. Continuous monitoring of investments helps in removing underperforming stocks from the portfolio.
On a concluding note, Mukul Agarwal is one of the seasoned investors in India, who is well-known for investing primarily in small-cap and micro-cap stocks. He follows the approach of long-term investing and tries to identify the potential multibagger stocks. He clearly sets an example of how long-term disciplined investing can help in creating wealth in the long term. However, it is advisable to consult your investment advisor before making any investment.
S.NO.
Check Out These Interesting Posts You Might Enjoy!
Mukul Agarwal is a famous Indian investor who primarily focuses on investing in small-cap and micro-cap stocks. He is also the founder of Param Capital.
What is the net worth of Mukul Agarwal?
As per the latest available reports, Mukul Agarwal has a total net worth ranging from INR 7000 to 7600 crores.
What investment strategy is followed by Mukul Agarwal?
Mukul Agarwal follows a buy-and-hold investment strategy. He invests in small-cap and micro-cap stocks and holds them for the long term. He picks stocks based on fundamental research.
How many stocks does Mukul Agarwal hold in his portfolio?
Mukul Agarwal holds around 60-70 stocks in his portfolio as per the recent reports.
What are the top 5 stocks in Mukul Agarwal’s portfolio?
Based on the holding value, Mukul Agarwal’s top 5 holdings include Neuland Laboratories Limited, AMS Technologies Limited, Radico Khaitan Limited, Zota Healthcare Limited, and Nuvama Wealth Limited.
In today’s time, the approval of any loan or credit card depends largely on your credit score. This score tells banks and NBFCs how reliable you are in making payments on time. CRIF High Mark is an RBI-recognized credit bureau in India, which prepares your complete CRIF report. In this blog, we will learn how to check credit score i.e. how to check credit score for free on CRIF and why it is important to track it regularly.
What is a Credit Score & Why Does it Matter?
A credit score is a three-digit number (300 to 900) that reflects your financial credibility. It can also be called a “financial report card” because it determines whether you will be able to repay your loan or credit card bill on time.
Who calculates it?
In India, the credit score is generated by four RBI-approved credit bureaus CIBIL, Experian, Equifax and CRIF High Mark. Of these, CRIF High Mark provides both personal and business credit information.
Importance of the score
Whenever you apply for a loan or credit card, banks and NBFCs first look at your credit score. It gives them an idea of your repayment capacity and trustworthy behavior.
Score range and meaning
750+ (Excellent): Loan approval is easy and interest rates are low.
650–749 (Fair): Loan can be obtained but the terms may be a little stringent.
Less than 650 (Risky): Chances of approval are low and interest rates are high.
Why is a regular check important?
Credit score directly impacts your financial future be it a home loan, personal loan or credit card limit. Hence, it is important to check your credit score from time to time. The CRIF score and its detailed CRIF report give you a clear picture. This is why a regular credit score check with CRIF is extremely important for your financial health.
Introduction to CRIF High Mark
Global and Indian History of CRIF
CRIF (Centre for Research in International Finance) is a global company, established in Italy in 1988 and spread across all four continents with presence in around 50+ countries.
The same company acquired High Mark Credit Information Services in India which was established in 2007 and has been operating as CRIF High Mark since March 2011 after it received a license from RBI as a credit bureau.
RBI approved Credit Bureaus in India
CRIF High Mark is an RBI approved Credit Information Company in India, providing credit reports and scoring for both individual and business lenders.
What makes it special?
It is India’s first Microlending-enabled Credit Bureau and the world’s largest Microfinance Bureau database.
It covers all borrower segments: retail, agriculture, rural, MSME, commercial and microfinance.
So far, it has tied up with 4,000+ financial institutions including cooperative banks, NBFCs, insurance companies, etc.
Both personal and business reports
CRIF High Mark provides two types of credit scores:
Personal Credit Score
Business Credit Score
This is useful for both large and small businesses, and this data is used by banks, NBFCs, and other entities for their risk assessment.
Thus, CRIF High Mark is not only a trusted and RBI-approved credit bureau, but is also unique for its comprehensive coverage, analytical capabilities, and providing both types of scores (personal and business).
How to Check Credit Score with CRIF (Step-by-Step Guide)
Step 1: Visit the official website
First, open the website of CRIF High Mark. Here you will find the option of “Free Credit Score” or “Get Your Score”. By clicking on it, you can start the process of checking the score. Remember, according to RBI rules, you get a free report once a year.
Step 2: Fill in your information
Now you have to enter some basic details like name, date of birth, PAN (or any other valid ID), mobile number and email ID. This information is taken so that the system can identify you correctly.
Step 3: Verify with OTP
After filling the form, tick “I agree” and proceed. An OTP will come on your registered mobile number. As soon as you enter it, your identity will be confirmed.
Step 4: Answer additional security questions
Sometimes CRIF asks you some questions related to your credit history like an old loan or credit card details. The system shows your report only after giving the correct answer.
Step 5: View your score and report
Once the verification is complete, your CRIF score will be displayed on the screen. You can also view the full CRIF report by going to the “My Report” section and download it as a PDF. The report is password-protected, usually the password is the first four lowercase letters of your name + the last four digits of your mobile number.
Step 6: Keep the report safe
Once downloaded, save your report in a safe place. It will be very useful for your loan or credit card application.
Understanding Your CRIF Report
When you check your credit score on CRIF, you not only get a number but also a CRIF Report of your entire credit history. By looking at it, you understand how you have used your loan and credit card and banks trust you after seeing it. Let’s understand it in a simple way:
Personal Details : The report starts with information like your name, date of birth, PAN or Aadhaar number and mobile number. This is important so that the report is completely related to you and there is no mistake.
Credit Accounts Summary : This section shows all your loan and credit card accounts – which ones are active, which ones are closed, and how much credit limit you have. This gives you a complete idea of your expenses and debt.
Repayment History : This section tells whether you have repaid your loan or credit card installments on time or not. If a payment is late, it is shown as “DPD Days Past Due”. Paying on time strengthens your credit profile.
Enquiry Details : When you apply for a loan or credit card, the bank or NBFC looks at your report. This is called a Hard Enquiry. Having too many enquiries can have a slight impact on your score, so avoid unnecessary applications.
Your CRIF Score : And finally comes your score CRIF Score (300-900). The higher the score, the more trustworthy you are. Generally, a score of 750 or above is considered good. To increase the score, timely payment and balanced use of limits are necessary.
If your CRIF score is low, it indicates that there may be some things in your credit behaviour that may cause concern for lenders. Let’s know the reasons due to which your score can be affected:
Missing EMI or credit card payment : If you have not paid EMI or credit card bill on time, it negatively affects your score. Even a single default can reduce your score by 50-80 points.
High Credit Utilization Ratio : If you are using 40% or more of your credit limit, it indicates that you are using more credit, which can lower your score.
Multiple loan/credit applications in a short period of time : If you have applied for multiple loans or credit cards in a short period of time, it can lead to a drop in your score. Every application is accompanied by a “hard inquiry”, which affects your score.
Long-overdue accounts : If you have accounts whose installments are pending, it negatively affects your score. Not making payments on time leads to a drop in your score.
Limited or no credit history : If you have a very short credit history or none at all, it can affect your score. Lending institutions find it difficult to evaluate your credit behavior.
Identification errors in the report : If your report has an incorrect PAN number or incorrect loan information, it can affect your score. You should contact CRIF to correct such errors.
How to Improve Your CRIF Score
CRIF score shows your financial health and it is directly related to your daily banking behavior. To improve it, there are some small but effective steps by adopting which you can gradually strengthen your score.
Pay EMI and credit card bills on time : The easiest and effective way is to pay every EMI and credit card bill on time. Even one or two delays can harm the score. Try to always make the payment before the due date.
Keep credit usage balanced : If you are using the entire or most part of your credit limit, it indicates to the bank that you are heavily dependent on debt. Try not to use more than 30–40% of the limit.
Do not apply for new loans or credit cards frequently : Applying for many loans or cards in a short period of time affects the score. Every new application is recorded as a “hard enquiry”, which can pull down the score slightly.
Keep the right mix of credit : If you have a balance of secured and unsecured credit, it is good for the score. For example, having a small home loan or car loan and a credit card can be beneficial.
Check your CRIF report from time to time : Incorrect or outdated information can harm your score. Therefore, it is important to check your credit report at least once a year. This will help you correct the mistakes in time and track your progress.
Build credit history gradually : If you have a short credit history, start with a small loan or secured credit card. Gradually, proper use increases the confidence of banks and NBFCs in your ability to pay.
Your CRIF score tells your financial story to your bank and lenders. If it is correct and strong, it is easy to get a loan or credit card. Therefore, it is very important to pay EMIs and bills on time, use credit limits in a balanced manner and pay attention to your report. If you see any mistake in the report, correct it immediately. These small habits gradually strengthen your credit and make it easier for you to make financial decisions in the future.
S.NO.
Check Out These Interesting Posts You Might Enjoy!
In the world there are different types of companies, some countries are rich and some are poor. Also we also hear that some countries are developed and the other is a developing company. Have you ever wondered how the experts decide this?
Per Capita Income (PCI) it is one of the simplest ways which helps us to identify this.
In this blog we will be learning about Per Capita Income, how it is calculated and the benefits of Per capita income.
What is Per Capita Income?
Per Capita Income (PCI) is the average amount of money earned by each person in a country in a given period of time, generally a year. The term “per capita” means per head. So, it’s the average income per head.
In Per Capita Income, the calculation includes all the individuals consisting of working adults, retired persons, college students, and even newborn children. PCI is not considered as an average salary of a working person, rather it is the average income that is spread across the entire population. Per capita income is generally used to check the financial health of a country.
How is Per Capita Income Calculated?
The formula to calculate Per Capita Income is simple and you only require the data of a country’s total income and the total population of the country to find it accurately.
Formula: Per Capita Income = Total income / Total Population
Let’s understand it by a simple example:
Imagine a small village in India with a population of about 1,000 people. Here you need to find out the total working people in the village and let’s say they collectively earn Rs.5 cr. in one year then,
Per Capita Income of the Village = Total Income (5 Cr) / Total Population (1,000) = 50,000 income of an individual per year
Therefore the Per capita income of the village is Rs.50,000/year. This gives us a single number to understand the average income in India for that village.
You must be curious about “Total National Income” and how we get it. This is closely related to GDP (Gross Domestic Product), it is important to understand the difference between GDP and PCI.
GDP is the total value of goods and services produced in a country within a given year, on the other hand PCI is the average income earned by each person in the country in a given time (a year).
PCI is a very useful tool for the following reasons.
Standard of Living: It helps us in knowing the standard of living in a country, here a higher per capita income generally indicates that the people can purchase more goods and services, quality healthcare and better education.
Better Decision Making: PCI is also used by Governments to understand which parts of the country are doing well and which part needs attention. If any of the states have low PCI then the government might allocate more resources and give opportunities to increase the PCI.
Helpful for Businesses: Businesses use this data to decide how and where they can expand their operations or sales, like a company selling expensive laptops will preferably target cities with a high PCI, as people there would have more purchasing power.
Country comparison: PCI also helps in comparing the economic health of different countries. Some organizations like the World Bank use Gross National Income (GNI) per capita which is identical to PCI, to classify countries into different income groups. Currently India is classified as a lower middle income economy.
Problems associated with Per Capita Income
The biggest challenge associated with PCI is that it excludes inequality from its search, as it is an average of the total income which can be sometimes misleading. Let’s go back to our village example where the Per capita income was Rs.50,000 but think what if one wealthy person in the village alone earns Rs.2 crores in a year and the rest of the population (999 people) earn only Rs.30,000 each. Here the total income generated by the village is still Rs.5 crore and the PCI is Rs.50,000, but in reality most of the people are earning less than the average calculated. As we can see, the massive income generated by one person can pull the average for everyone in the country. This is the limitation of PCI as it hides the gap between the rich and the poor.
In PCI, the cost of living in different places is not considered as a person living in the village can easily live a good quality life with an income of Rs.1 lakhs a year as compared to someone who is living in a tier 1 city as everything from rent till food is comparatively expensive in the city. PCI doesn’t account for these price differences.
To correct this, economists also use something called Purchasing Power Parity (PPP). PPP adjusts the income accordingly to show how much you can purchase with given money in a specific place. In India, the PCI adjusted for PPP is much higher than the simple number, giving a better picture of the actual standard of living.
Per Capita Income also avoids many important things that contribute to our well-being like:
Unpaid Work: Some works are not considered or counted under PCI such as work done at home like cooking, cleaning, washing.
Informal Economy: A large chunk of the population in India is associated with the informal sector such as street vendors or a daily wage worker; the income generated by such people are not fully recorded in the official numbers, leading to a different PCI than reported.
Quality of Life: PCI does not include quality of life factors like public transport, clean air, safe roads, high-quality hospitals, or how much free time people have. A country may have a high PCI but might have a bad quality of life.
Per Capita Income helps us in getting the gist of a country’s economic health. It helps us in making a broad comparison of the economies and helps us in understanding the economic trends of the countries.
However, it is among some few numbers that are calculated in a country’s GDP. PCI helps in understanding how well a country, its economy and its people’s average income. Though we shall also consider other factors like income inequality, the cost of living, and all the non-monetary things as well.
S.NO.
Check Out These Interesting Posts You Might Enjoy!
It is the average income earned by every single person in a country or region in a year. It’s calculated by dividing the total income of the area by its total population.
Why is one income different from India’s Per Capita Income?
One’s salary may differ from the PCI as it is the national average of income including everyone, which includes everyone from children to retirees. It also includes everyone from high income people to small income generating individuals as well as extremely wealthy individuals putting everyone in the same pool, so it doesn’t represent a typical person’s earnings.
How is GDP per capita and Per Capita Income different?
GDP per capita is about the value of goods and services produced and made by each person on an average. Per Capita Income is about the average income each person earns in a country. They both measure different aspects of the country or region.
How is GDP per capita and Per Capita Income different?
GDP per capita is about the value of goods and services produced and made by each person on an average. Per Capita Income is about the average income each person earns in a country. They both measure different aspects of the country or region.
Can a country with a higher Per Capita Income be considered good?
A country might have a high PCI but there can be a huge gap recorded between the rich and the poor. Also the living conditions of the country like clean air, high pollution might not be good as PCI only calculates the average income.
Why is India’s Per Capita Income (PPP) higher than its normal PCI?
This is because the cost of living in India is lower than in many Western countries. The PPP (Purchasing Power Parity) adjustment accounts for this, showing that the money earned in India can buy more goods and services locally. This gives a more realistic idea of the standard of living.
Open Free Demat Account
Join Pocketful Now
You have successfully subscribed to the newsletter
There was an error while trying to send your request. Please try again.