Gold has been important in India for centuries from an investment and cultural point of view. Traditionally, people used to buy gold in the form of jewellery, coins or biscuits. However, buying physical gold comes with challenges such as storage, insurance, and making charges.
Currently, investors are turning to digital options, among which Gold Exchange Traded Funds (Gold ETFs) are prominent. These funds trade on the stock exchange and track gold prices, allowing investors to invest in it without buying physical gold.
What is a Gold ETF?
Gold ETF or Gold Exchange Traded Fund can be considered as a type of mutual fund that tracks the prices of gold and can be bought and sold in the stock market. It is a digital medium of investment, which is free from the problems of storing physical gold.
It eliminates hassles of owning physical gold such as storage, insurance or making charges. It is a safe, transparent and convenient way to invest in gold. The purpose of investing in Gold ETF is to diversify the investment portfolio, protect against inflation and market decline.
This investment instrument has the potential to give stable and reliable returns over the long term. For this reason, Gold ETF can be considered a smart investment option in today’s time.
Key features of Gold ETF
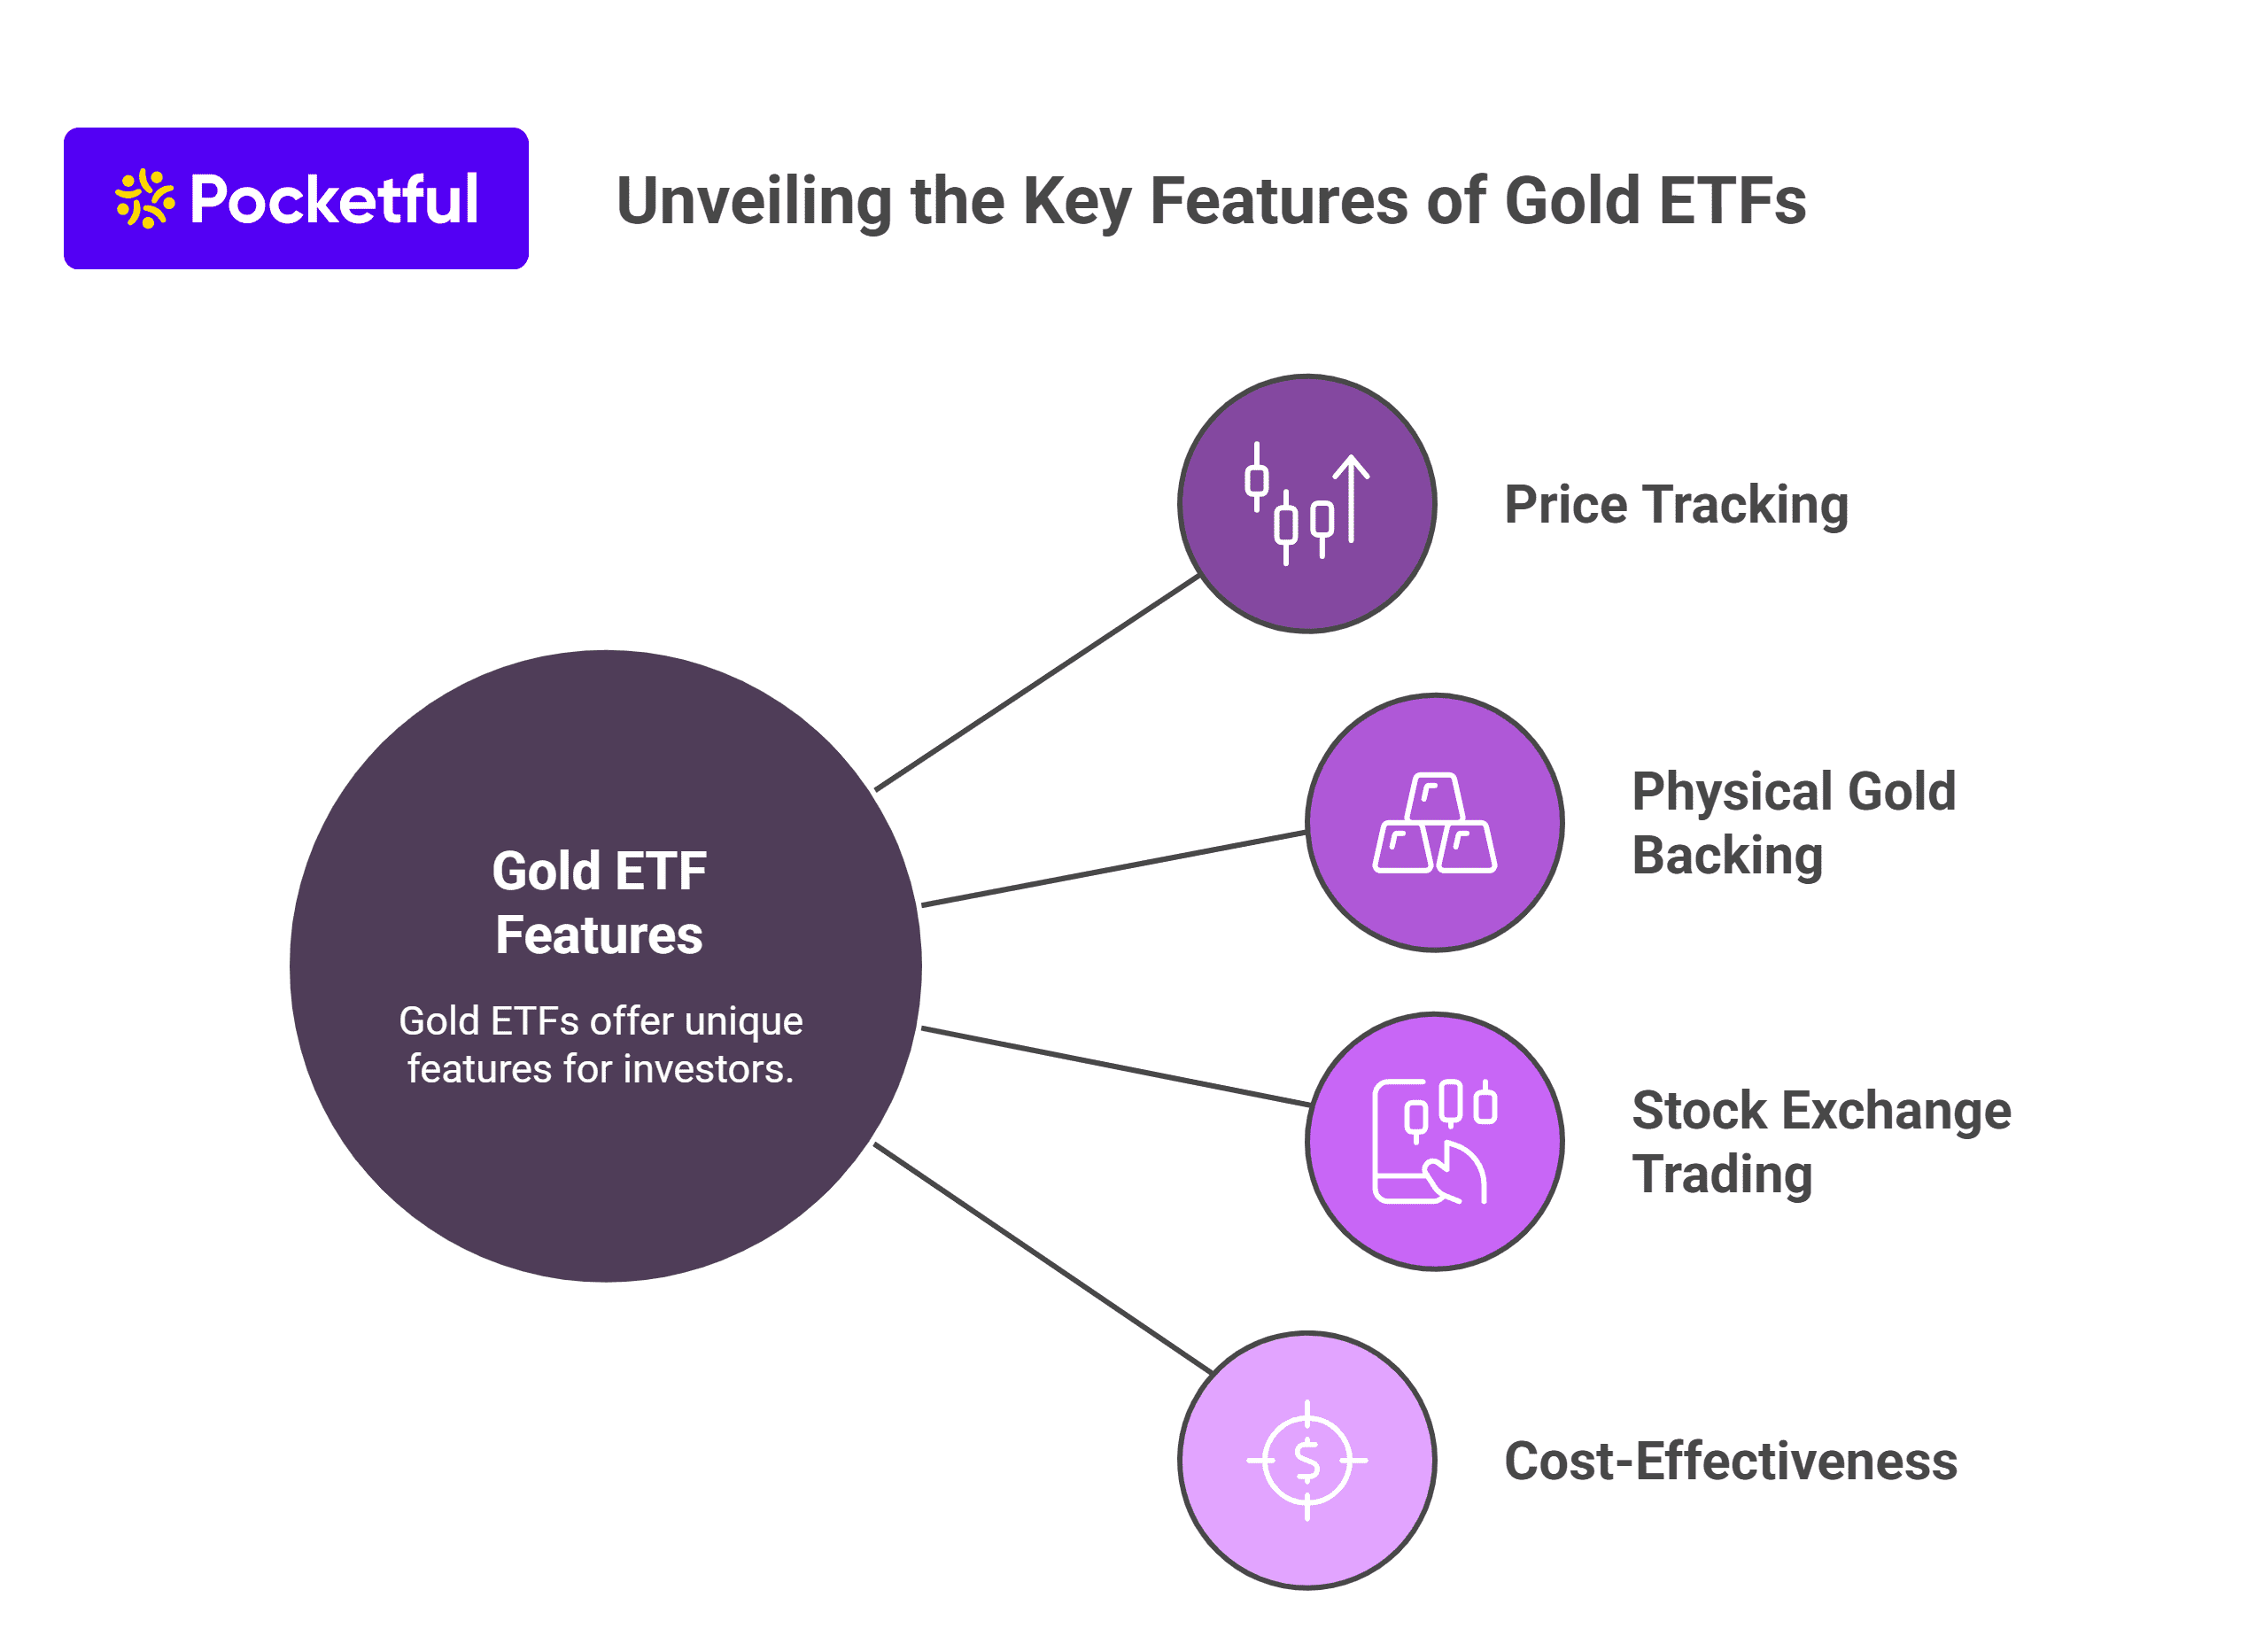
Gold ETFs are traded in the stock market, just like stocks of a company are bought or sold. Its key features are:
- Linked to the price of gold: The mechanism of a gold ETF fund is very simple. The ETF tracks the price of gold and its price fluctuations, which are closely linked with the price changes of physical gold.
- Backed by real gold: Gold ETFs are backed by real (physical) gold. This means that every unit has some quantity of actual gold behind it either in the form of physical gold or in the form of ETCDs (Exchange Traded commodity Derivatives) that have physical gold as underlying asset.
- Traded on stock exchanges: The biggest feature of these ETFs is that they can be bought or sold anytime during market hours. This makes them a liquid and flexible investment option.
- Low cost and hassle-free investment: Investing in gold ETFs involves neither making charges nor storage fees. It is a less expensive and easier investment option than physical gold.
How to Invest in Gold ETFs in India?
Investing in Gold ETFs is an easy process. It is similar to buying stocks in the stock market.
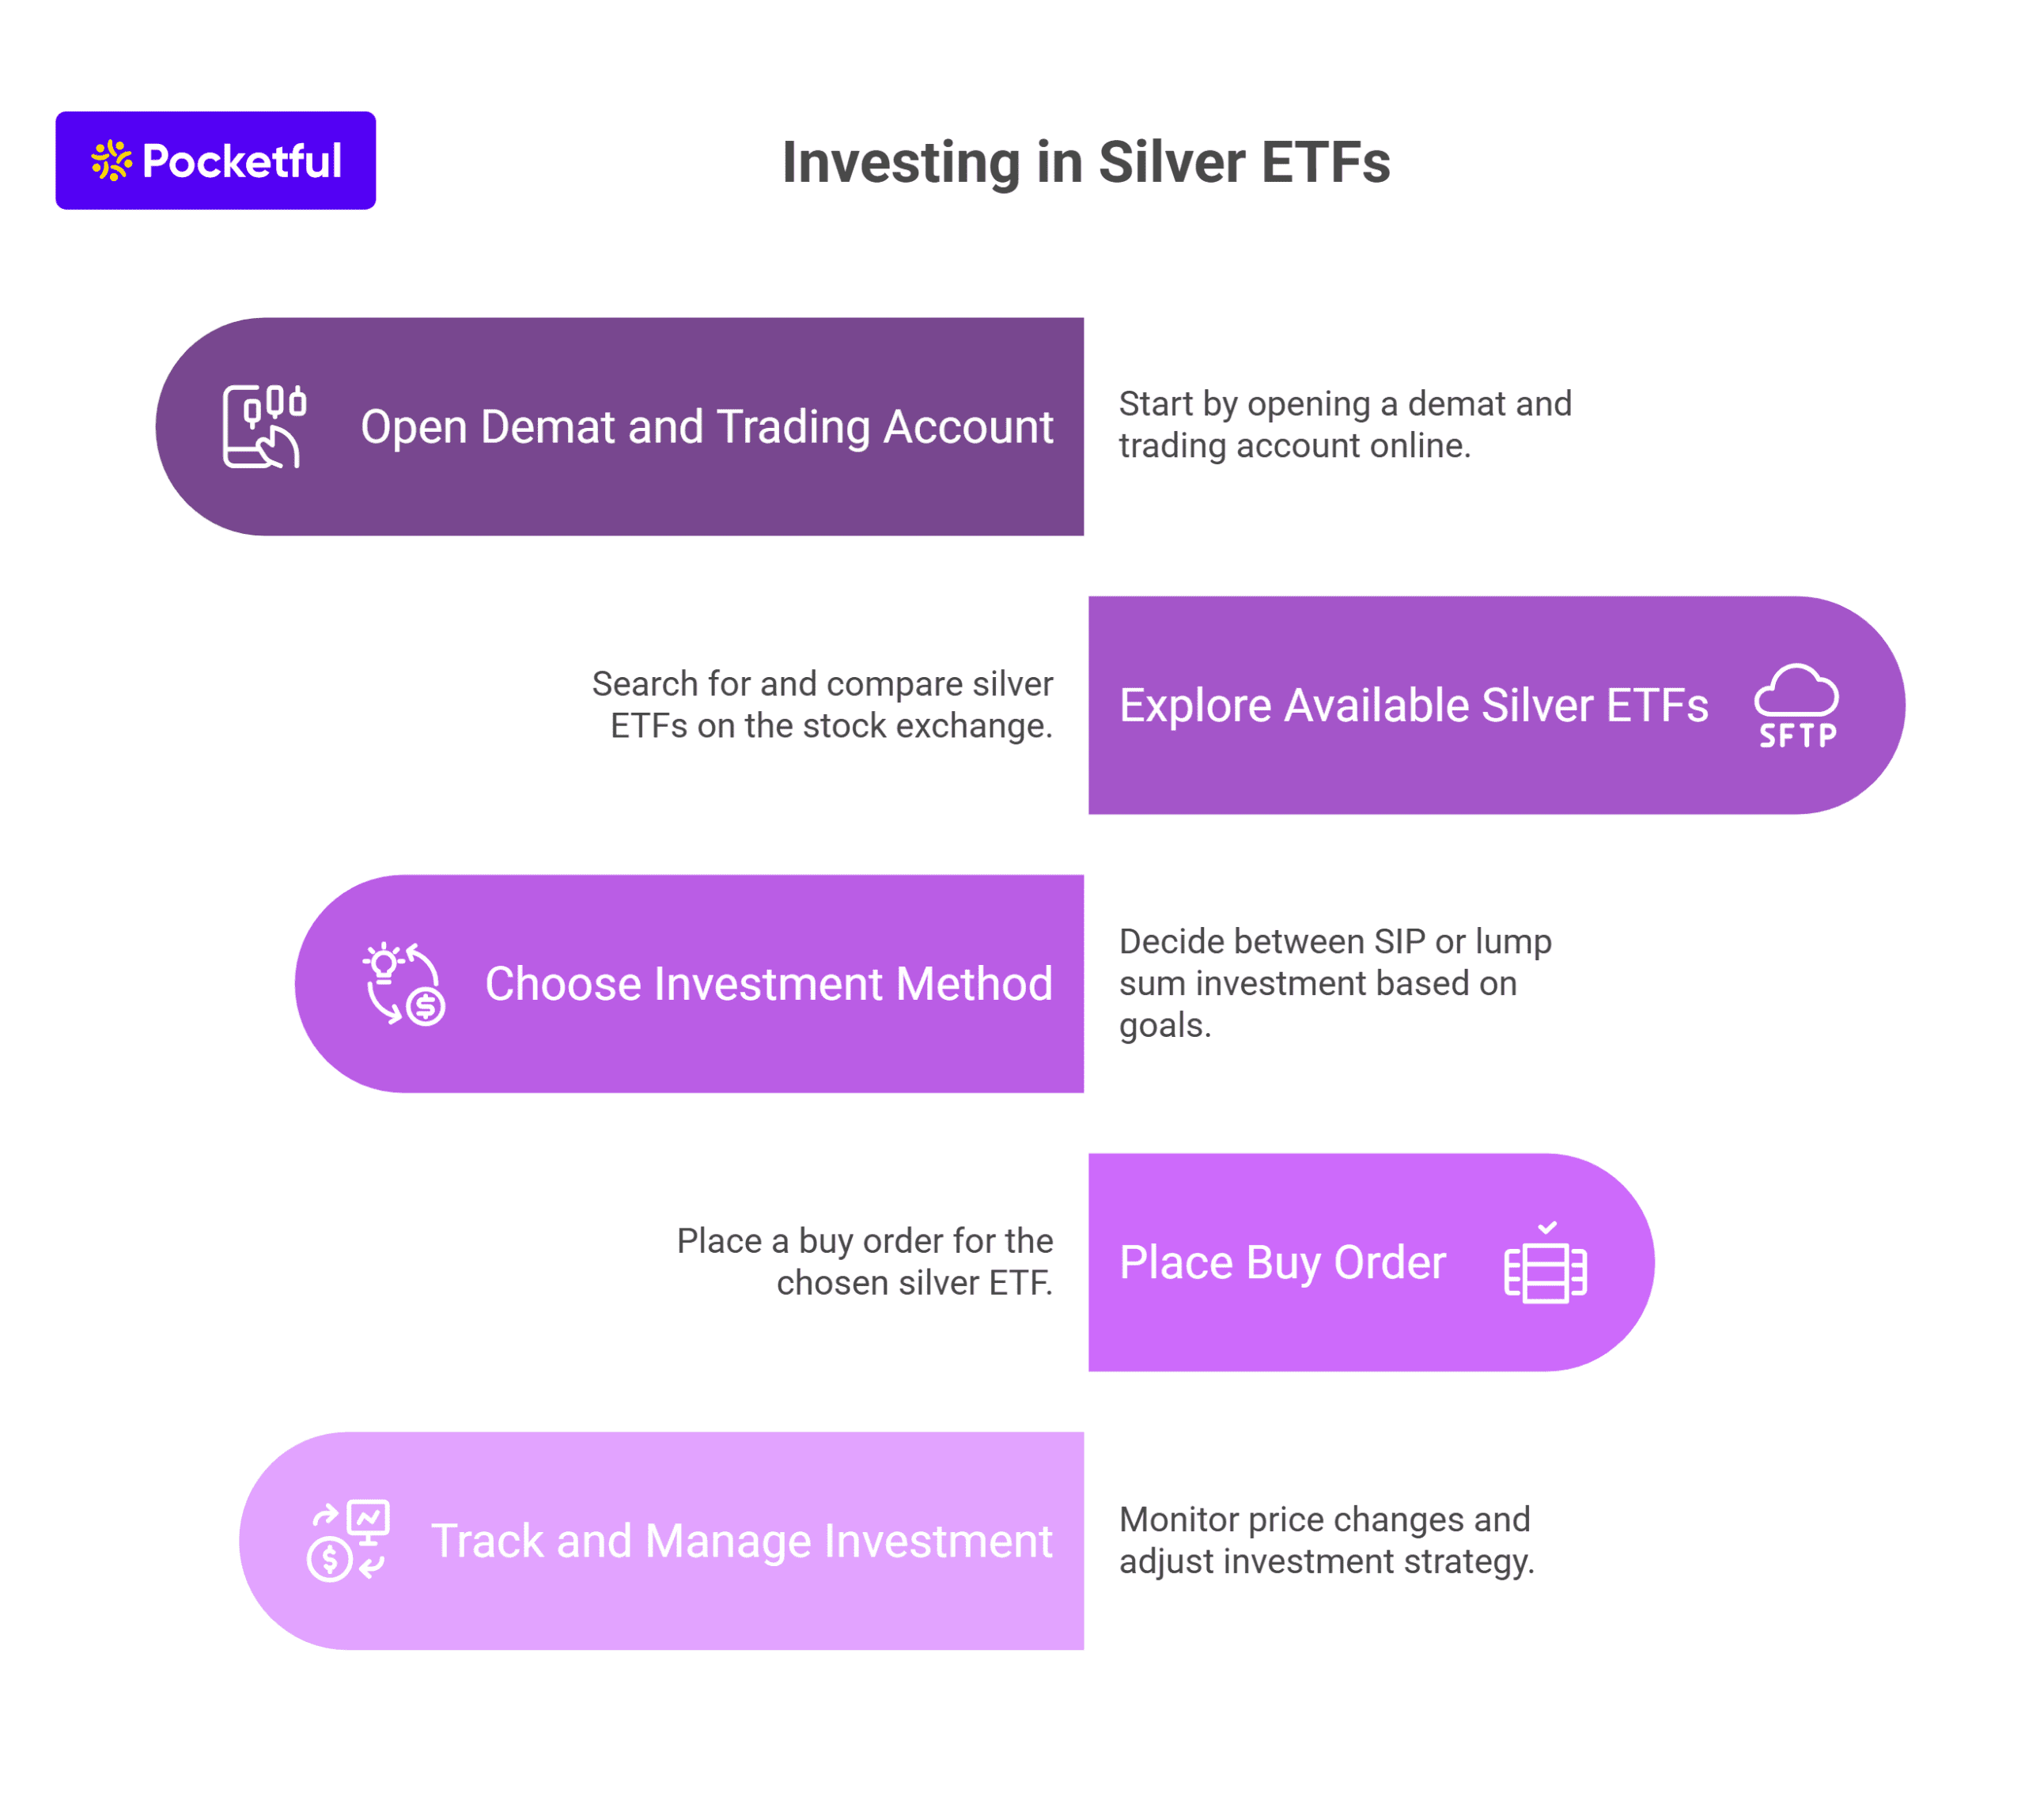
Step-by-step process:
1. Open Demat and Trading Account: To buy Gold ETF, first of all you need a Demat and trading account. Pocketful is a SEBI-registered brokerage platform with an easy to use mobile application and web platform, offering advanced technical tools and market insights.
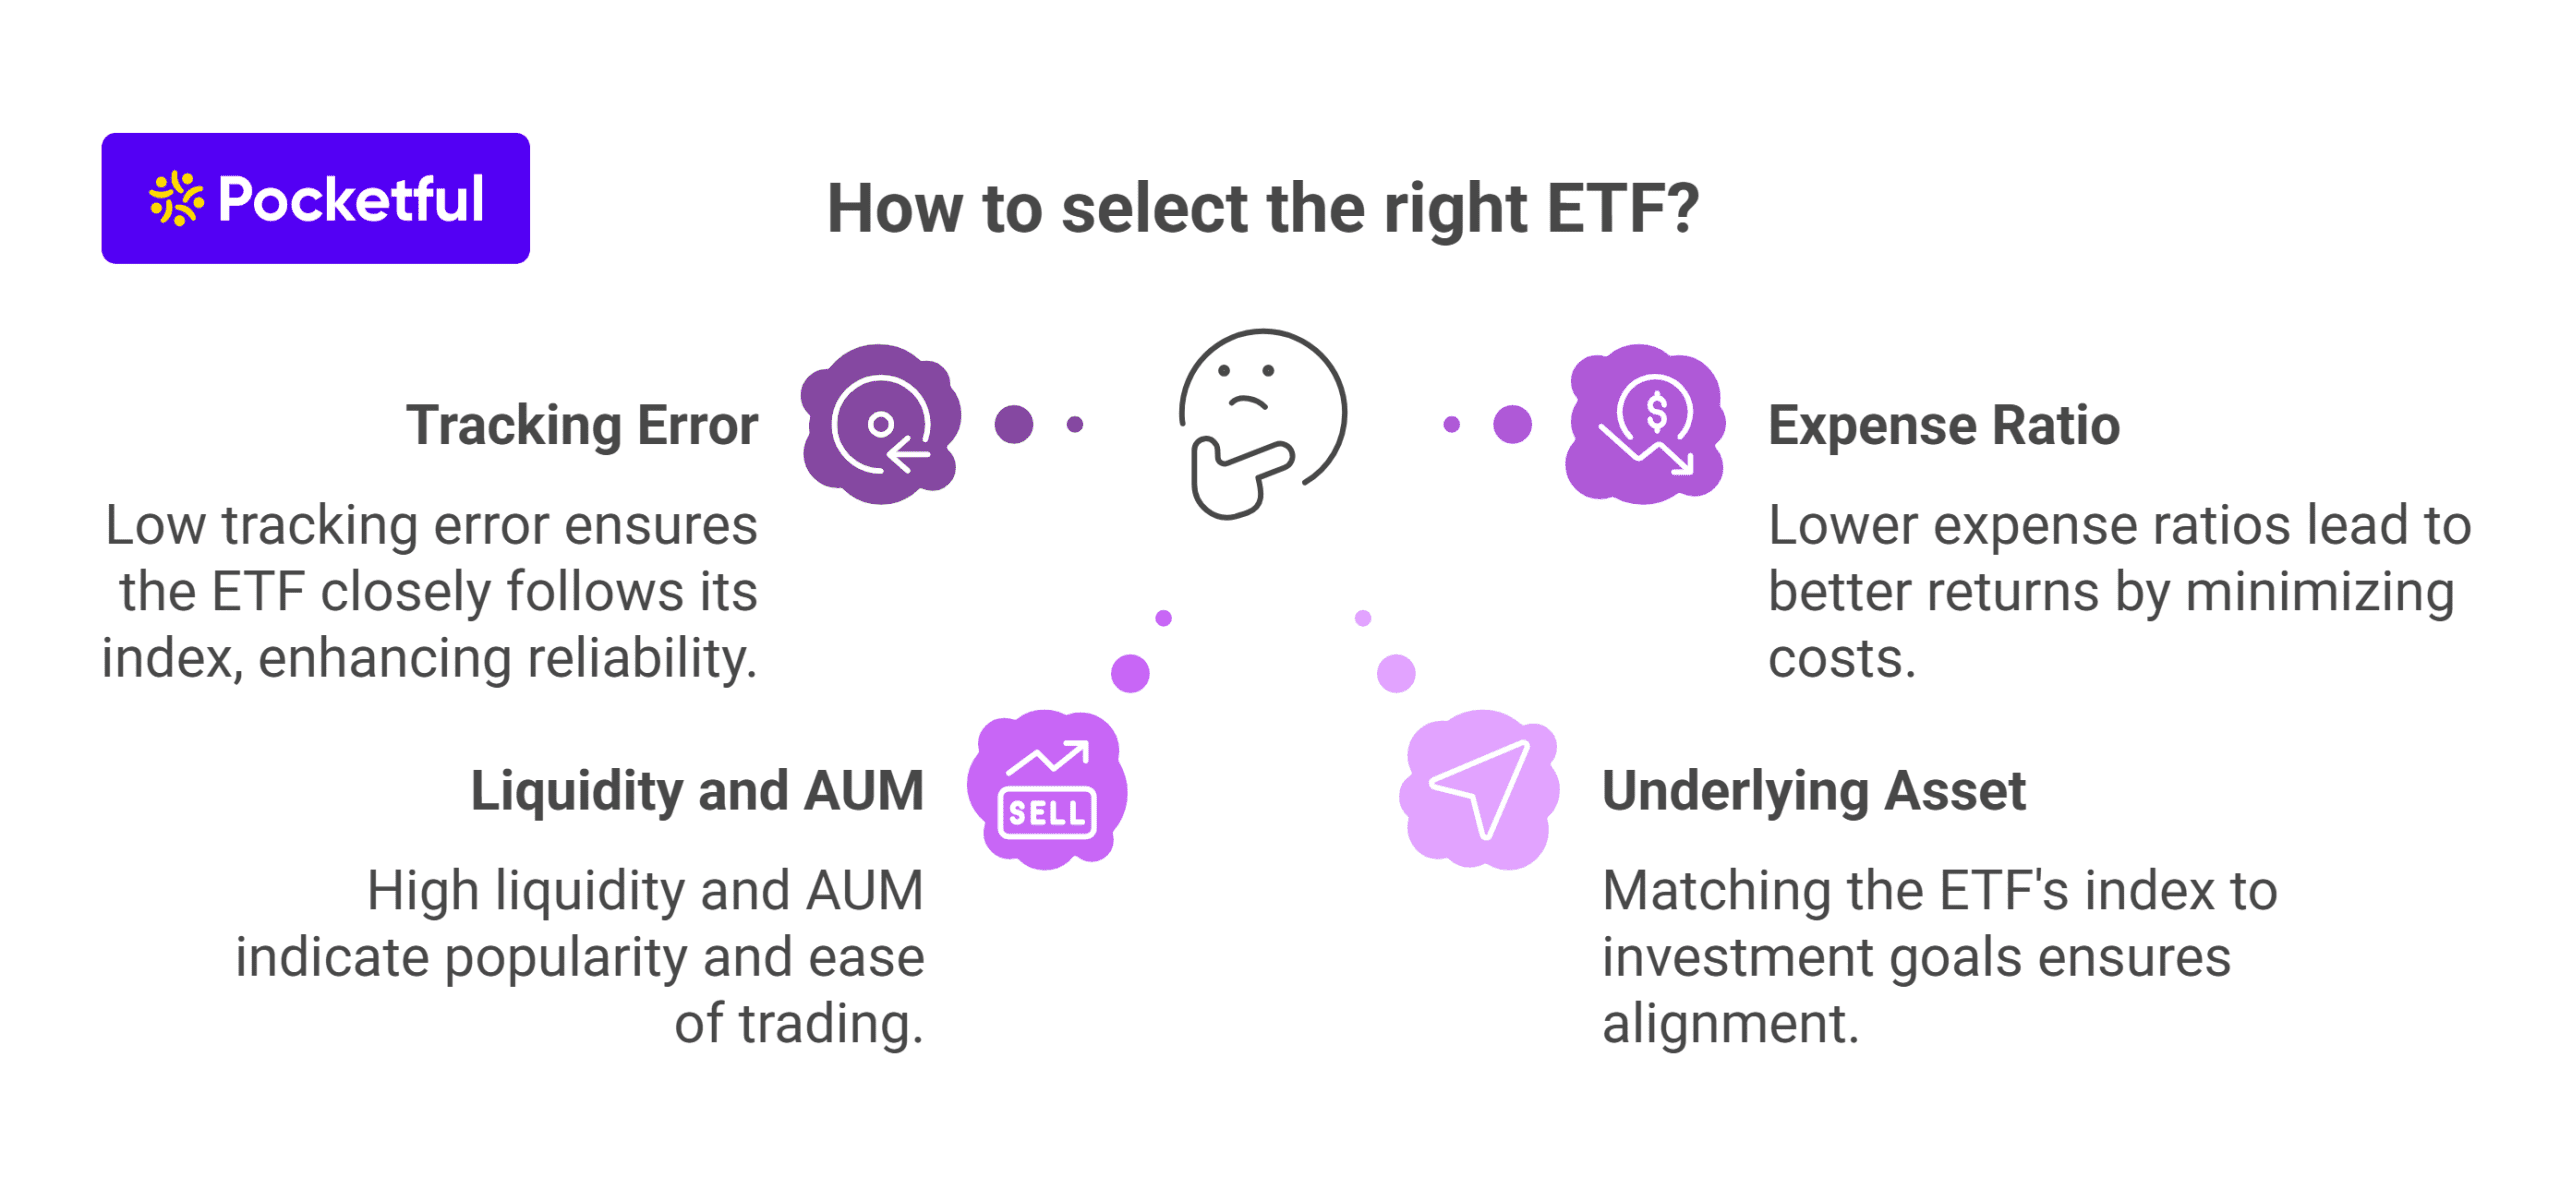
2. Choose the appropriate Gold ETF Fund: Compare Gold ETF Funds offered by different issuers, such as GOLDBEES, SETFGOLD, etc. Make sure to check the following:
- AUM (Assets Under Management) of the fund
- Expense Ratio
- Tracking Error
3. Buy from Trading app: One can also invest directly in Gold ETF from Pocketful’s mobile application.
Note: For a profitable investment journey, remember the following points:
- Decide your financial goals
- Start with small investments
- Keep an eye on tracking error and trends in gold prices
- Invest with a long-term view
Read Also: How to Invest in ETFs in India – A Beginner’s Guide
Taxation on Gold ETF Investment
Gold ETFs have now been placed in a separate category and are taxed based on the information in the table below:
| Holding Period | Type of Capital Gains | Tax Rate |
|---|---|---|
| 12 months or less | Short-Term Capital Gains (STCG) | As per individual income tax slab |
| More than 12 months | Long-Term Capital Gains (LTCG) | 12.5% flat rate |
Tips for Investors
- Tax Planning: It is important to plan before investing keeping in mind the tax implications.
- Professional Advice: It may be beneficial to consult a tax advisor to understand tax-related complexities.
Advantages of Gold ETFs
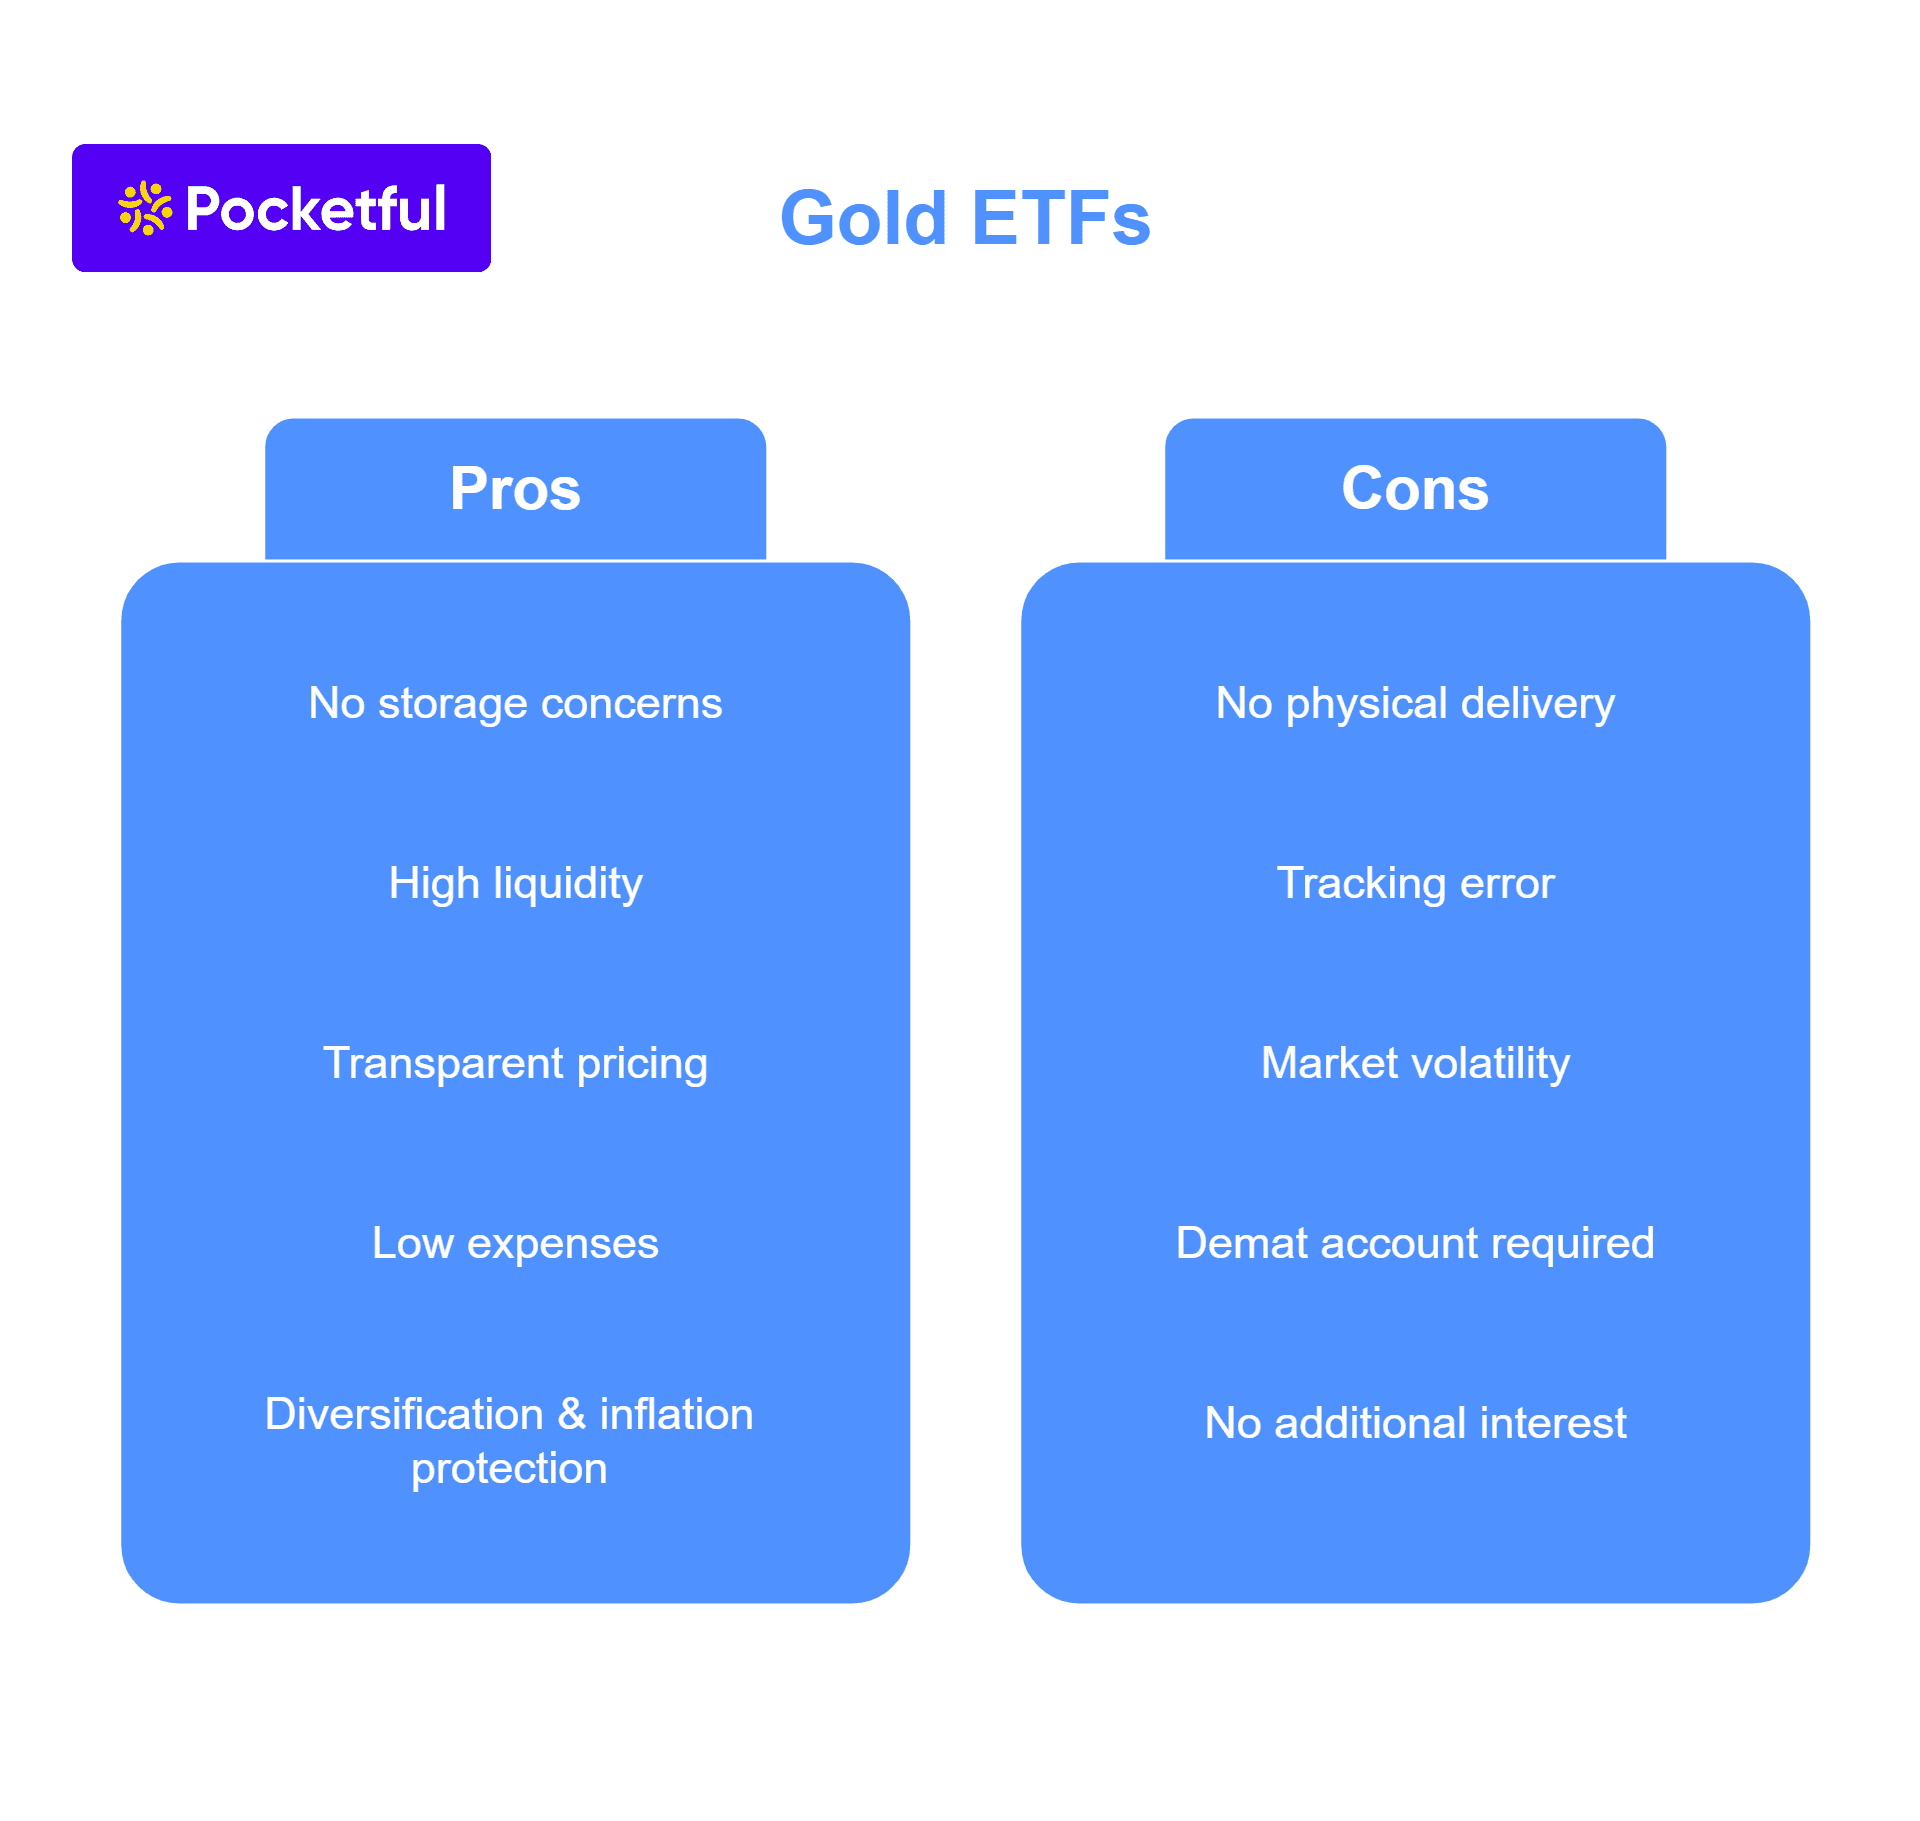
Various advantages of Gold ETFs are:
- No storage concerns: Unlike investing in physical gold, gold ETFs investors do not have to worry about safe storage or theft.
- High liquidity: Gold ETFs are traded on the stock market, so they can be easily bought or sold anytime during market hours.
- Transparent pricing: Gold ETF prices are directly linked to gold prices, which keeps ETF pricing transparent and unbiased.
- Low expenses: Compared to gold mutual funds, gold ETFs have lower management expenses (Expense Ratio), which reduces the overall cost of investment.
- Portfolio diversification and inflation protection: Gold ETFs help you diversify investments and also provide protection against inflation.
Overall, gold ETFs combine the benefits of investing in gold with the ease of equity investing, making it a simple, affordable and effective investment option.
Disadvantages of Gold ETFs
Disadvantages or risks associated with investing in Gold ETFs are listed below:
- No physical delivery: Gold ETFs cannot be redeemed for actual gold due to which some investors may prefer owning physical gold relative to investing in gold ETF.
- Possibility of tracking error: Sometimes the price of gold ETFs may differ slightly from the price of physical gold.
- Market volatility: The price of gold ETFs may fluctuate due to trading in the stock market.
- Demat account required: A Demat and trading account is required for investment, which some investors may not have.
- No additional interest: Unlike sovereign gold bonds, gold ETFs do not offer any additional interest or dividend.
For these reasons, it is important to understand all the risks and limitations before investing.
Should You Invest in Gold ETFs?
Below are the reasons behind why you should invest in Gold ETFs:
- Risk control: Gold ETFs are a good choice for investors who want to minimise risk and diversify their portfolio.
- Convenient digital exposure: Gold ETFs offer a seamless and transparent way to invest in gold through digital medium as compared to physical gold.
- Suitable for medium to long term investments: Gold ETFs are effective instruments for inflation protection and capital preservation during economic volatility.
- Begin Small: Some of the Gold ETFs trade below ₹100, making them accessible to small investors. Whereas, investing in physical gold requires substantial amounts of capital.
However, it is important to take expert advice regarding individual financial situations and investment goals before investing to make the right decision.
Read Also: How to Invest in Silver in India?
Conclusion
Gold ETFs are a smart, convenient and modern way to invest in gold. It is not only tax efficient but also safe and ideal for diversifying your investment portfolio. While avoiding the hassles of physical gold, Gold ETFs offer the simplicity of digital investing. To balance your portfolio, consider investing in Gold ETFs today with Pocketful.
| S.NO. | Check Out These Interesting Posts You Might Enjoy! |
|---|---|
| 1 | Mutual Fund vs ETF. Are They Same Or Different? |
| 2 | Best ETFs in India to Invest |
| 3 | ETF vs Stock – Which One is the Better Investment Option? |
| 4 | Gold ETF vs Gold Mutual Fund: Differences and Similarities |
| 5 | ETF vs Index Fund: Key Differences You Must Know |
Frequently Asked Questions (FAQs)
How to invest in Gold ETF?
To invest in Gold ETF, it is necessary to have a Demat and trading account. You can easily open an account with Pocketful, transfer funds, search for Gold ETFs and begin investing.
What are the tax implications of Gold ETF?
Holding for less than 12 months is taxed as per the income tax slab, and holding for more than 12 months is taxed at 12.5% LTCG.
Can Gold ETF be exchanged for physical gold?
No, Gold ETFs do not provide delivery of physical gold as they are only digital units.
Is Gold ETF better than physical gold?
Gold ETFs have several benefits over physical gold, such as no storage fees, more secure and highly liquid, making them a better option for many investors.